Event-Driven Instrumentation in Go is Easy and Fun
By Eben Freeman | Last modified on December 1, 2018One of many things I like about Go is how easy it is to instrument code. The built-in expvar package and third-party libraries such as rcrowley/go-metrics are delightfully simple to use.
But metrics aren’t quite enough! We’re here to encourage you to structure your instrumentation not just around metrics, but around events.
Let’s make that idea concrete with an example. Imagine a frontend API for a queue service. It accepts user input, and writes it into a Kafka backing store. Something like this:
func (a *App) handle(r *http.Request, w http.ResponseWriter) {
    userInfo := a.fetchUserInfo(r.Headers)
    unmarshalledBody := a.unmarshalInput(r.Body)
    kafkaWrite := a.buildKafkaWrite(userInfo, unmarshalledBody)
    a.writeToKafka(kafkaWrite)
}
With a timing helper, we can track — in aggregate – how long it takes to handle a request, and how long each individual step takes:
func (a *App) timeOp(metricName string, start time.Time) {
    a.timers[metricName].UpdateSince(start)

func (a *App) handle(r *http.Request, w http.ResponseWriter) error {
    defer a.timeOp("request_dur_ms", time.Now())
    // ...
}

func (a *App) fetchUserInfo(r.Headers) userInfo {
    defer a.timeOp("fetch_userinfo_dur_ms", time.Now())
    // ...
}

// ...
The limitation of this approach is that global timers can show you when an anomaly occurs, but not necessarily why. Let’s say we observe occasional spikes in overall measured request latency:
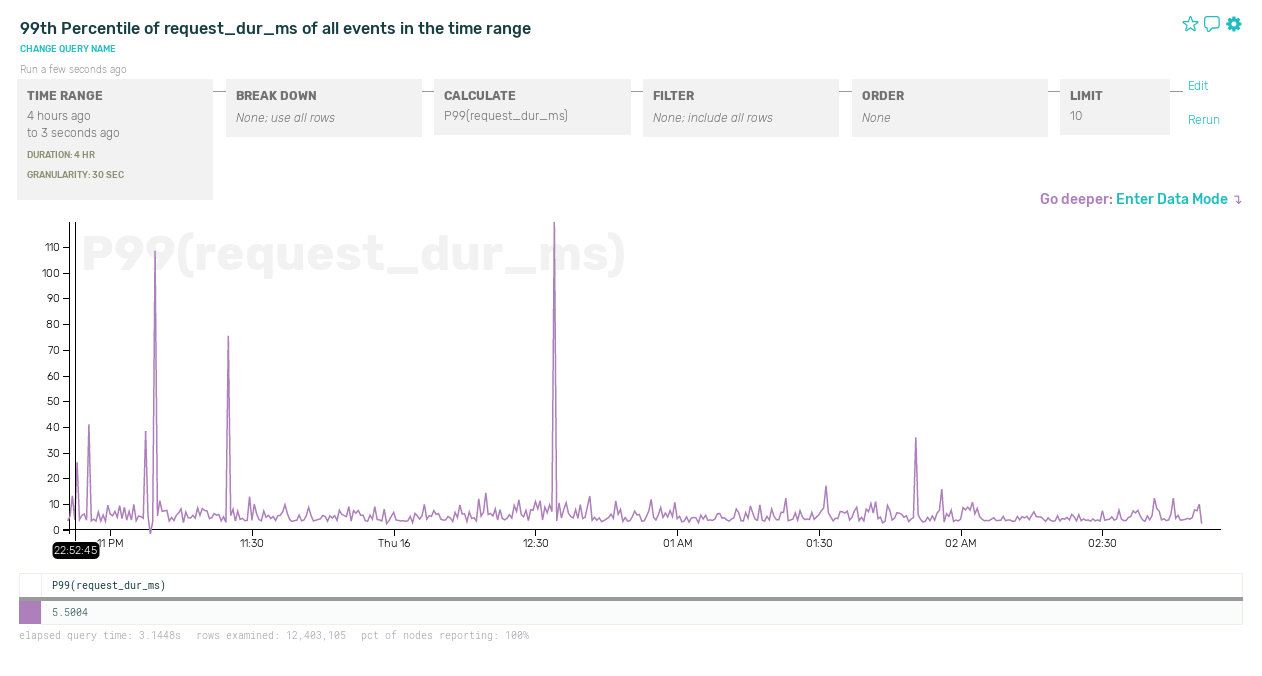
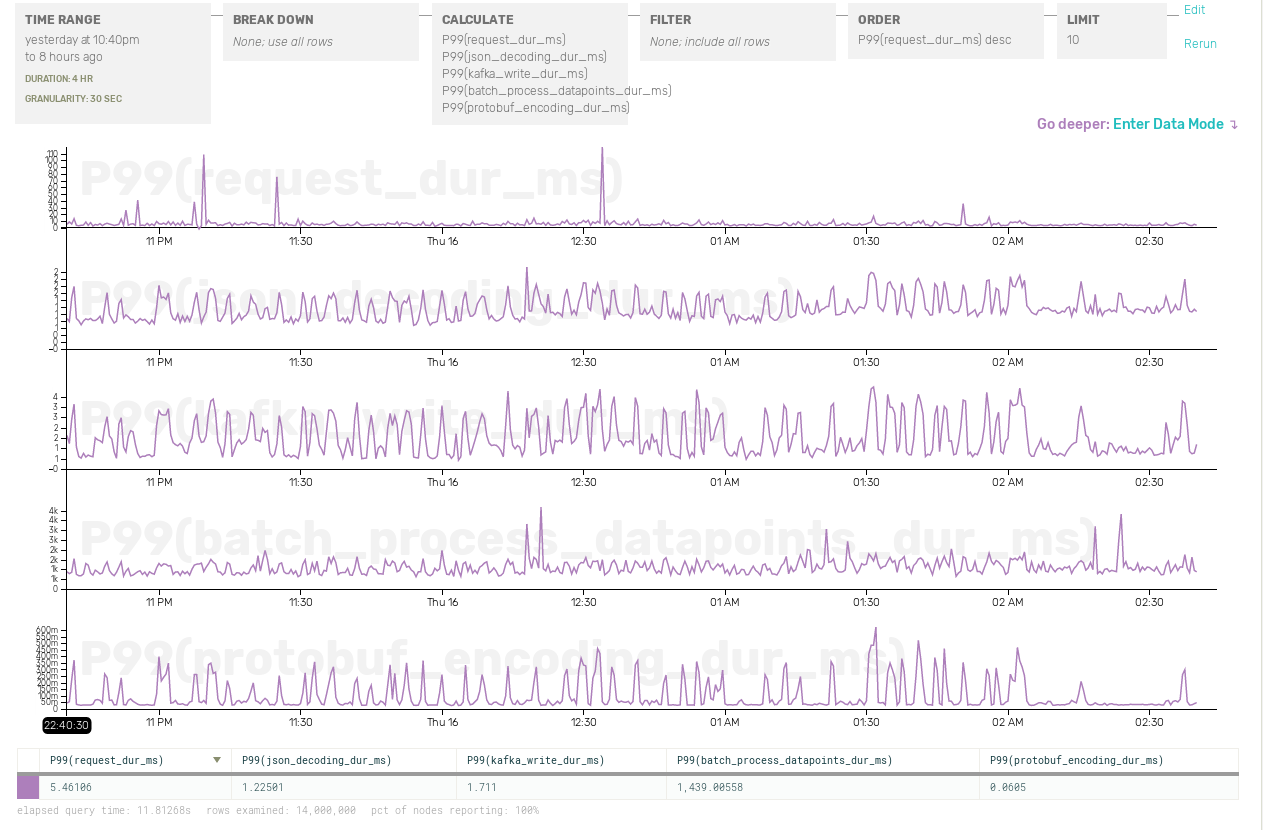
If all we have is sitewide metrics, it’s going to take lot more poking to figure out what’s going on. In fact, our other timing metrics might not have any correlation with those spikes at all:
Contrast this with event-driven instrumentation. It’s not that complicated! We just build up an event object with all the data we want to record: our original timers, plus request URL, user ID, and whatever other data we can think of. Once we’ve handled the request, we ship off the event.
func (a *app) handle (r *http.Request, w http.ResponseWriter) {
    start = time.Now()
    ev := libhoney.NewEvent()
    ev.AddField("url", r.URL.Path)

    userInfo := a.fetchUserInfo(r.Headers, ev)
    ev.AddField("user_id", userInfo.UserID)

    unmarshalledBody := a.unmarshalInput(r.Body, ev)
    ev.AddField("is_batch", unmarshalledBody.IsBatchRequest)

    kafkaWrite := a.buildKafkaWrite(userInfo, unmarshalledBody, ev)
    a.writeToKafka(kafkaWrite)

    ev.AddField("request_dur_ns", time.Now().Sub(start))
    ev.Send()
}
Here we’re using libhoney, Honeycomb’s lightweight library for Go. Honeycomb is built to handle exactly this type of wide, flexibly typed event data. Send it all! The more fields you can think of, the better.
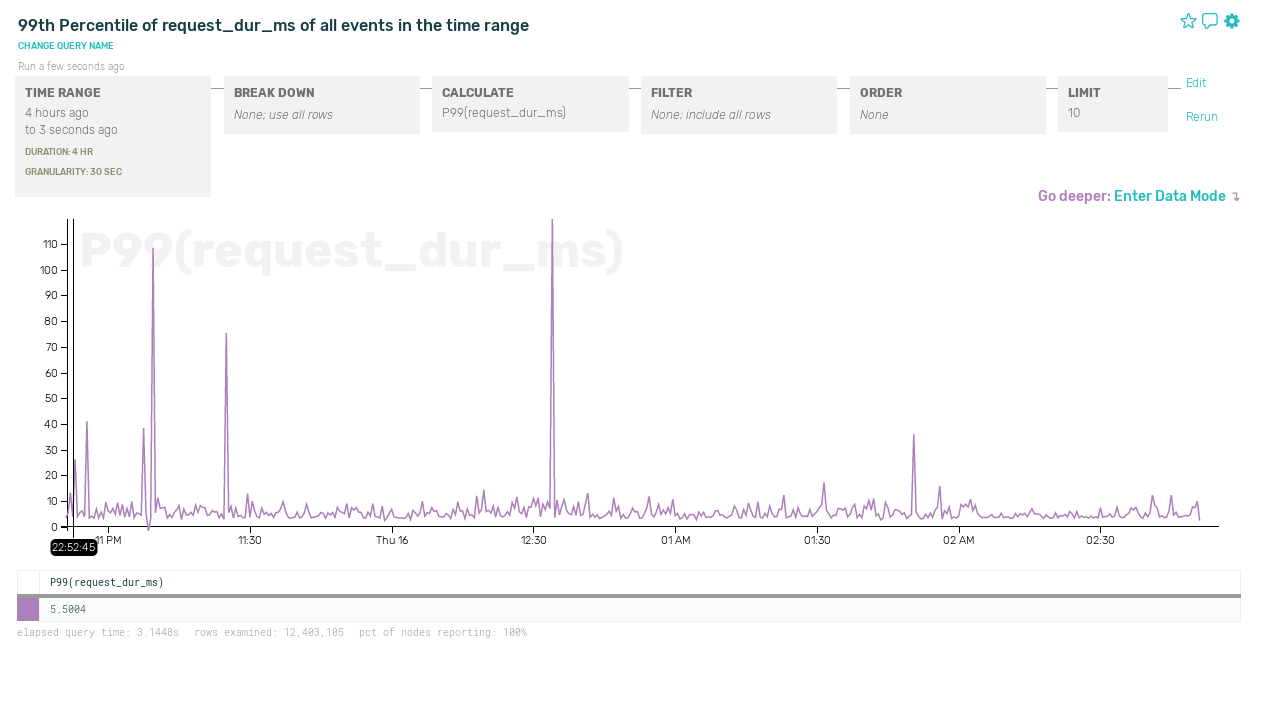
The usefulness of this approach becomes clear when tracking down actual problems. Let’s go back to that latency spike:
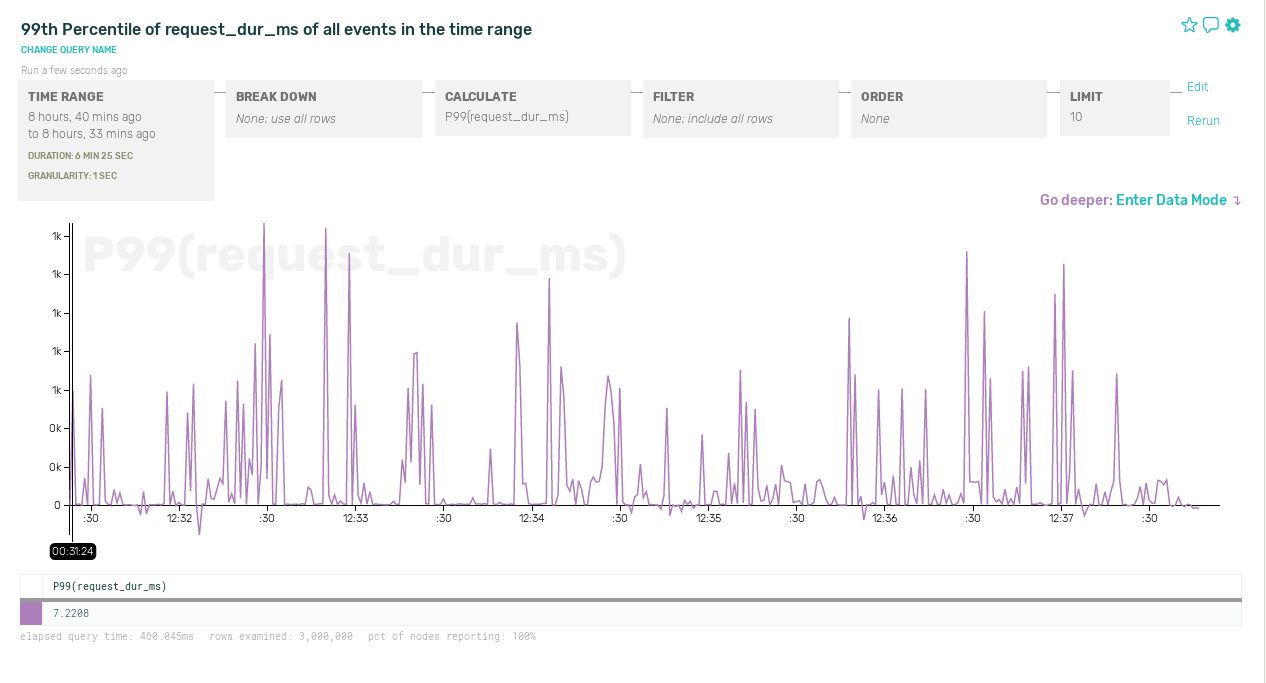
Zooming in on one of those spikes, 99th-percentile latency on a smaller time interval looks pretty erratic:
Let’s try to breaking down the data by URL:
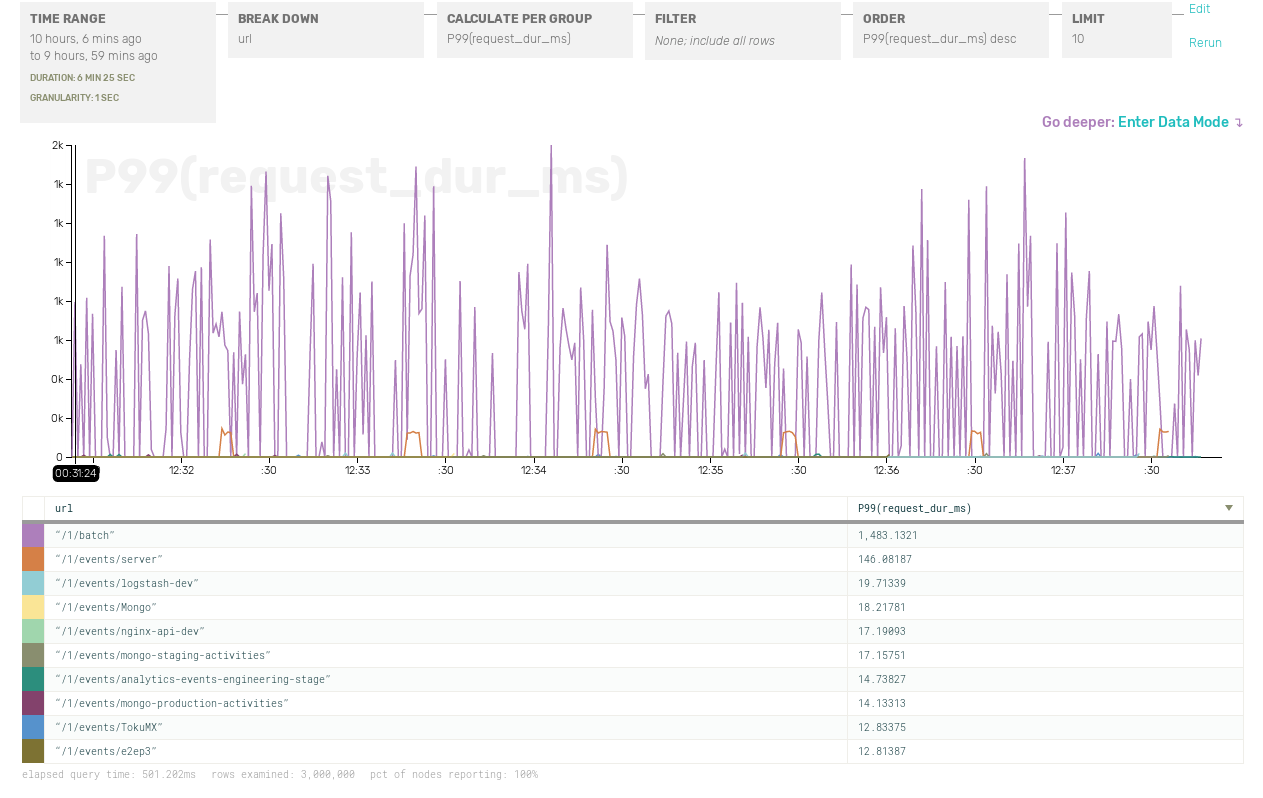
Aha! Looks like it’s requests to /1/batch that are slow. Zooming back out in time, but breaking down response times by URL, here’s what’s really going on. We have a pretty bimodal latency distribution — slow batch requests and fast normal requests — and sometimes this skews the P99 metric:
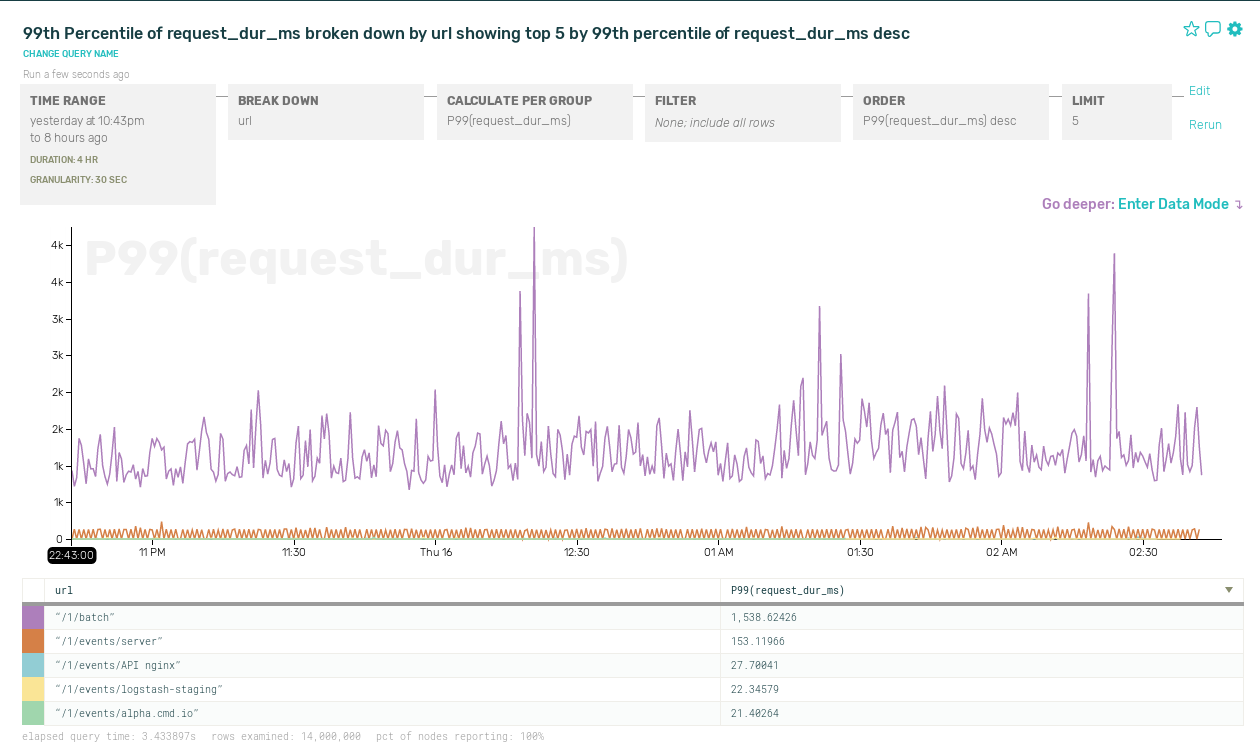
Of course, we could have figured this out by adding separate timing metrics for each API endpoint. But if you want to slice and dice by user ID, request length, server host, or any other criteria you can think of, you’ll quickly find yourself facing a combinatorial explosion of metrics.
So please, instrument in terms of events, not just metrics!
Head on over to https://ui.honeycomb.io/signup to get started, run go get github.com/honeycombio/libhoney-go, and add a couple lines of instrumentation to your code. Do it right now! Thank yourself later!
Related Posts
Instrumenting a Demo App With OpenTelemetry and Honeycomb
A few days ago, I was in a meeting with a prospect who was just starting to try out OpenTelemetry. One of the things that...
OpenTelemetry Best Practices #2 Agents, Sidecars, Collectors, Coded Instrumentation
For years, we’ve been installing what vendors have referred to as “agents” that reach into our applications and pull out useful telemetry information from them....
Safer Client-Side Instrumentation with Honeycomb's Ingest-Only API Keys
We're delighted to introduce our new Ingest API Keys, a significant step toward enabling all Honeycomb customers to manage their observability complexity simply, efficiently, and...