Markers: Observe your systems and your humans
By Chris Toshok | Last modified on January 11, 2019Honeycomb provides a powerful tool to ask questions about your systems, but your systems and users aren’t the only agents for chaos in your organization. Changes to your infrastructure, be they automated or manual, can introduce unforeseen effects. These operational events are often logged someplace but wouldn’t it be nice if they were also visible alongside all your service events?
We call them “markers” in honeycomb, and they’re so powerful (even the simple case of a marker per service deploy) that we intentionally don’t include them in our demo datasets - they make the investigation too easy. They render as a vertical dashed line in your graphs at particular points in time.
Among other things, we at Honeycomb add markers to all our datasets for all deploys. We find them invaluable in a couple of ways:
- To investigate an unplanned change in some metric - event count, request duration, etc
- To verify the effects of a beneficial change.
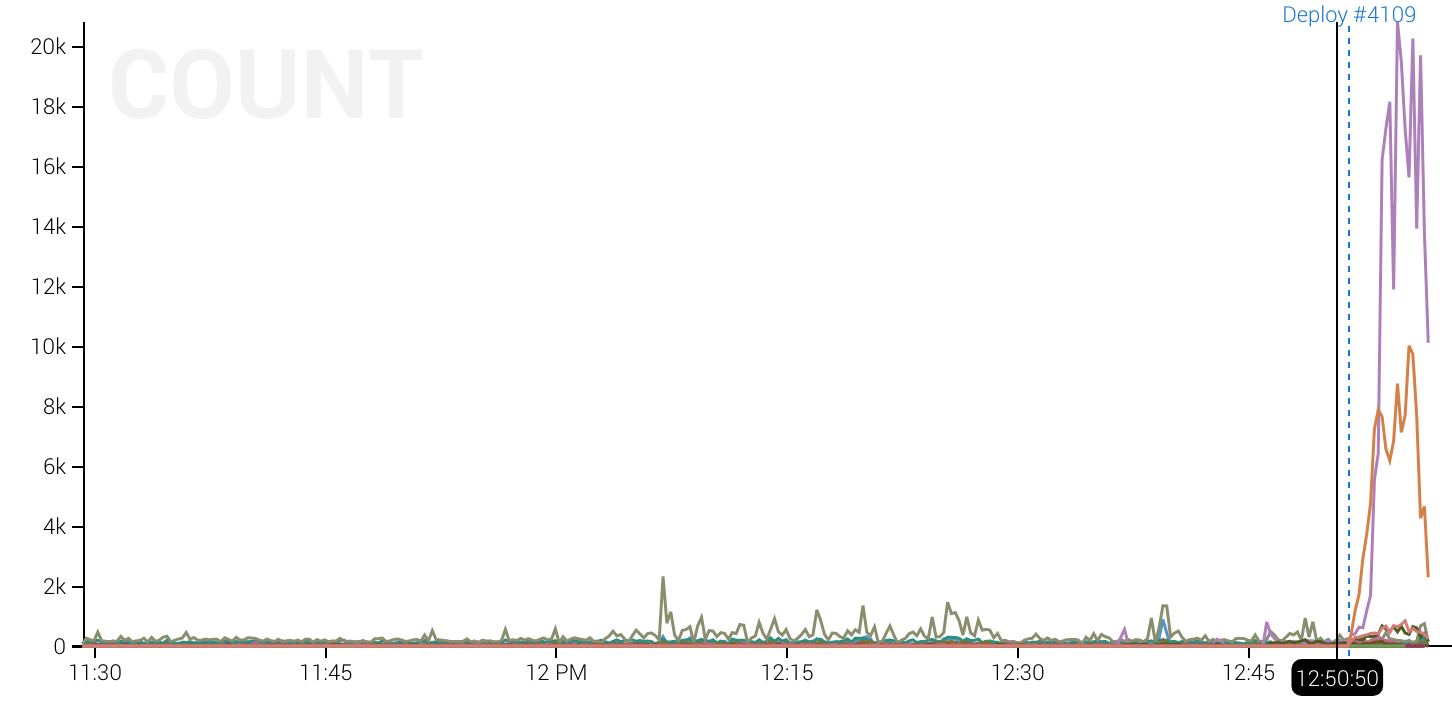
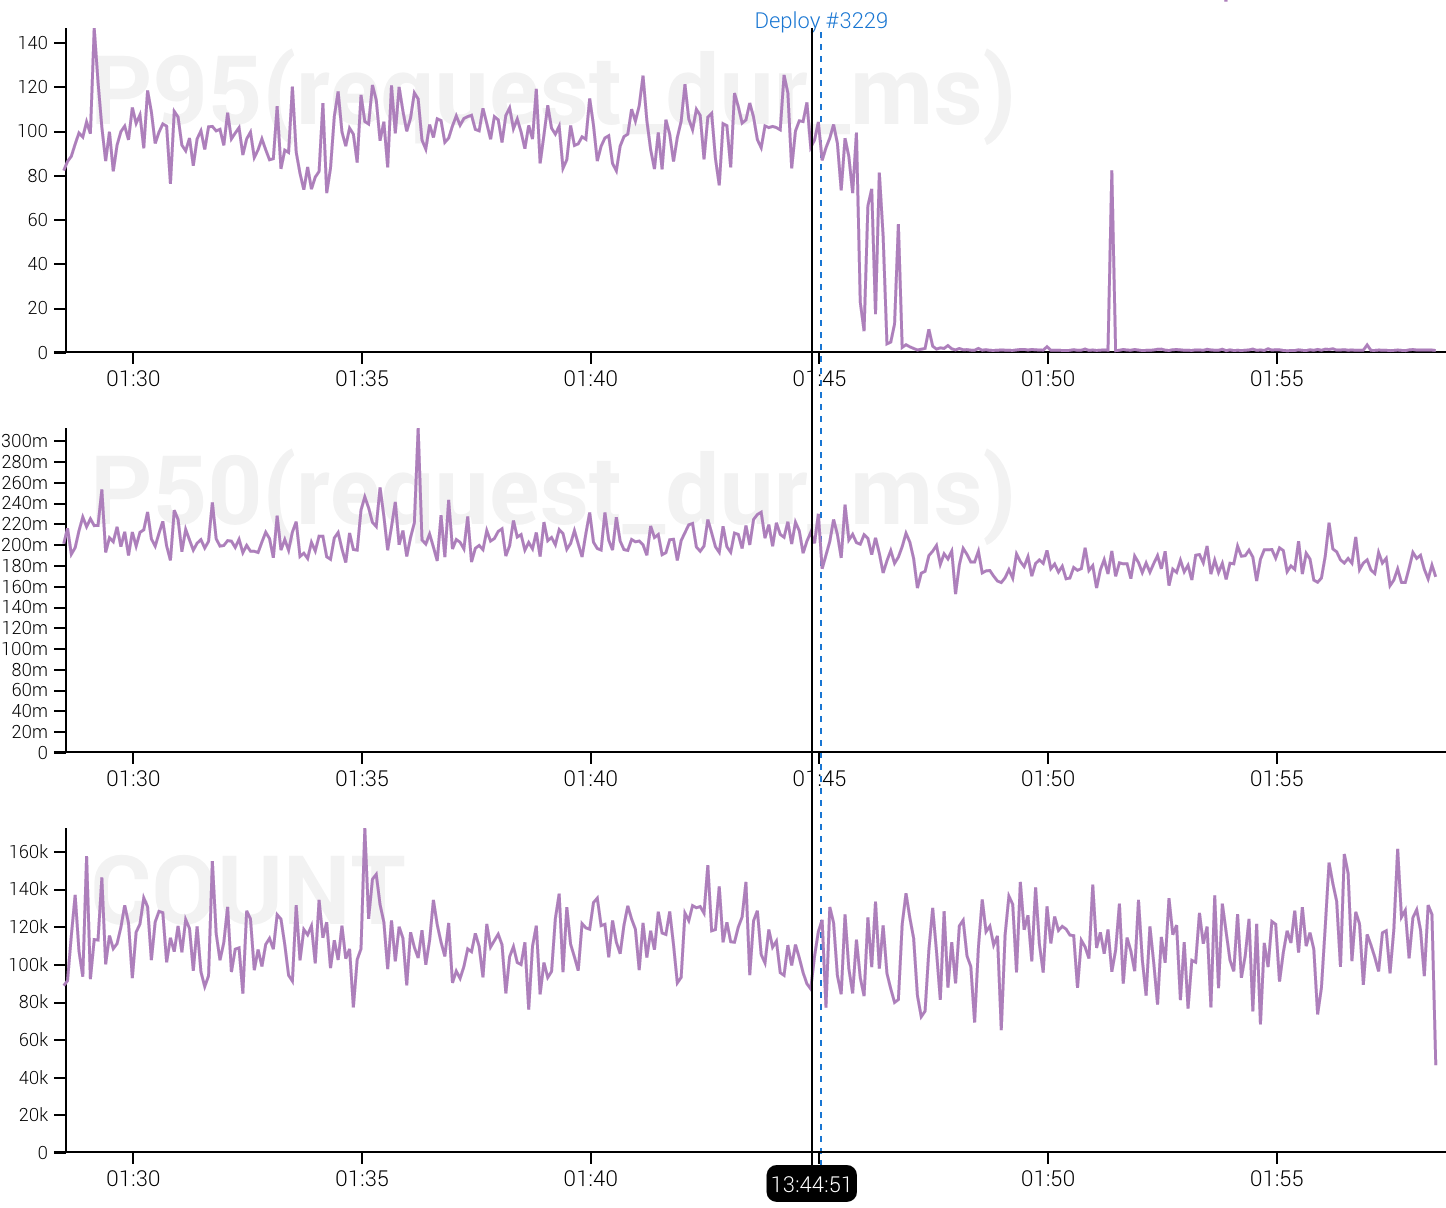
Examples from our production datasets
This may be really good, and it may be reallllly bad. Maybe go check out what got deployed as part of 4109?
Knocking out outliers in request duration. Deploy 3229 wins!
Managing markers
We’ve had a documented REST API for dealing with markers for a while now, but it can be a pain crafting the cURL command line to create one, let alone to list/update/remove them.
honeymarker is a tiny CLI for managing markers. We use it internally, and you should totally use it if you’re also sending us event data.
Adding a marker to a dataset is as simple as:
$ honeymarker --writekey <team write key>
              --dataset <dataset name>
              add
              --type deploy
              --msg "Deploy #3229" --url "https://travis-ci.com/...."
The above command doesn’t include any timestamps - it defaults to “now” if missing. In fact none of the add command args (--type, --msg, --url in this example) are required. If it’s more important to note the time for the marker, leave them off and go back and fill in details later with the update command.
The --msg is the string that shows up in the UI when you hover over the marker. The --url is where you go when you click on the marker text.
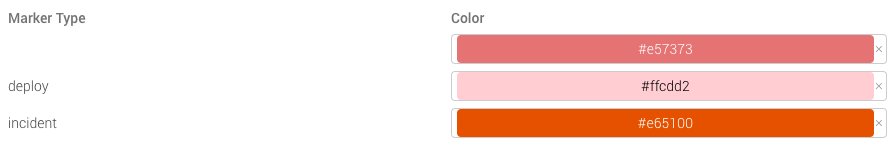
The --type flag deserves some additional explanation: All marker types that have been added to the dataset can have a color chosen in the UI in your dataset’s settings:
Evolving markers
The data model for markers has the slot for end_time to go along with start_time. We’ve envisioned this being useful for charting start/end time for outages, rollouts. We record the end time with our markers internally, but we haven’t added ranged marker rendering to the UI. Reach out to support@honeycomb.io or @honeycombio if this would be a killer feature for your team.
Related Posts
Safer Client-Side Instrumentation with Honeycomb's Ingest-Only API Keys
We're delighted to introduce our new Ingest API Keys, a significant step toward enabling all Honeycomb customers to manage their observability complexity simply, efficiently, and...
Now Available: Honeycomb Launches Data Residency in Europe
At Honeycomb, we are very concerned about privacy and data sovereignty—it’s something we take very seriously, and in an effort to serve our customers better,...
Introducing Honeycomb’s Microsoft Teams Integration for Enhanced Alert Management
Today marks an exciting milestone at Honeycomb, and we're thrilled to share it with you. We officially launched our integration with Microsoft Teams, a step...