Anatomy of a Cascading Failure
By Douglas Soo | Last modified on May 8, 2019In Caches Are Good, Except When They Are Bad, we identified four separate problems that combined together to cause a cascading failure in our API servers. This followup post goes over them in detail, and shows how we used Honeycomb to help ourselves understand and illustrate how feedback loops and amplification can turn a small issue into a major outage.
Flushing logs stalls MySQL
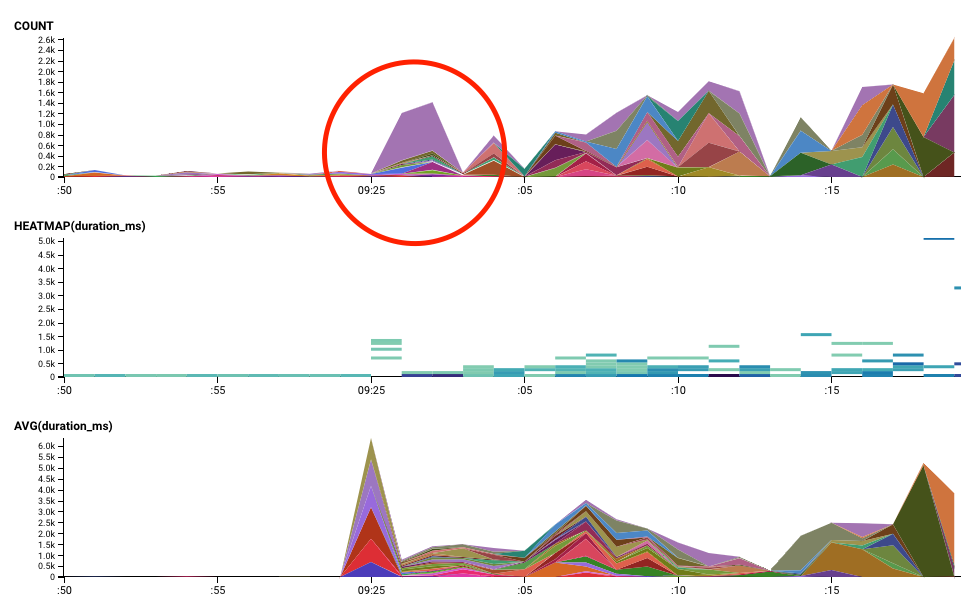
As mentioned in the Incident Review, we believe that the trigger for the feedback loop was a longer than usual blocking flush logs database call. Why do we think this was the case? Let's inspect our mysql slow query log, which sends an event for every database call to the database. What do we see in the first few seconds?
|
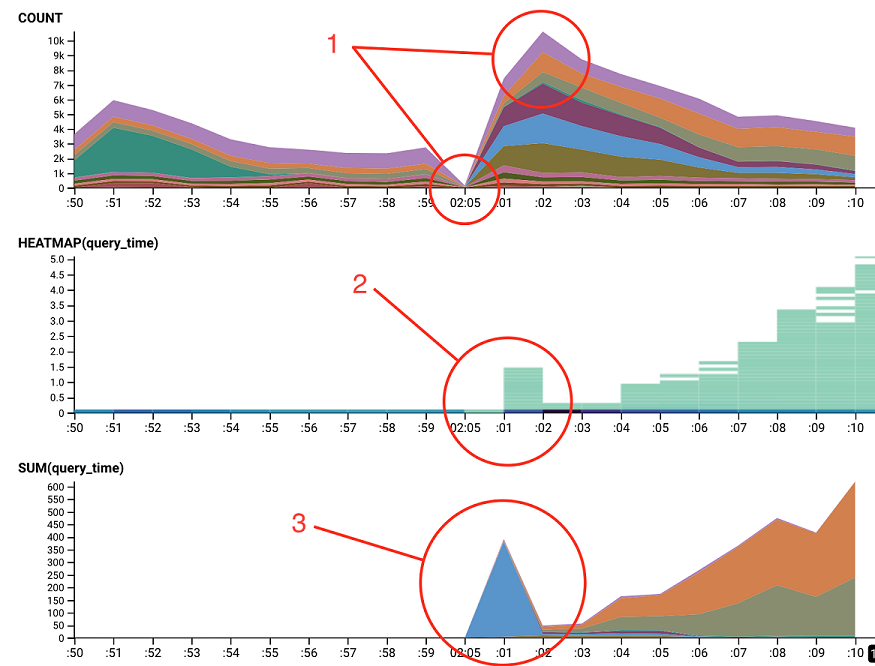 |
Okay, so this definitely indicates that the database was blocking on something. How did we identify flush logs as the likely culprit? In the case of any sort of resource stall, it is usually a reasonable guess that one of the first events that completes after the stall is the culprit. We can also assume that the query that caused the database stall was unusual in some way - otherwise, this would be happening far more frequently. Honeycomb has a tool that helps with identifying these kind of anomalies in a dataset - BubbleUp.
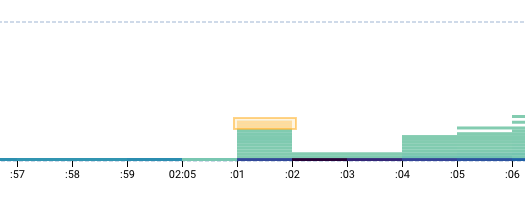
| Looking at our chart, we use BubbleUp to select queries that took a long time immediately after the stall window - letting BubbleUp do the work to compare this subset of queries against the broader set of queries that ran. |
 |
Looking at the differences between the baseline and selection, you can immediately see a few interesting things:
|
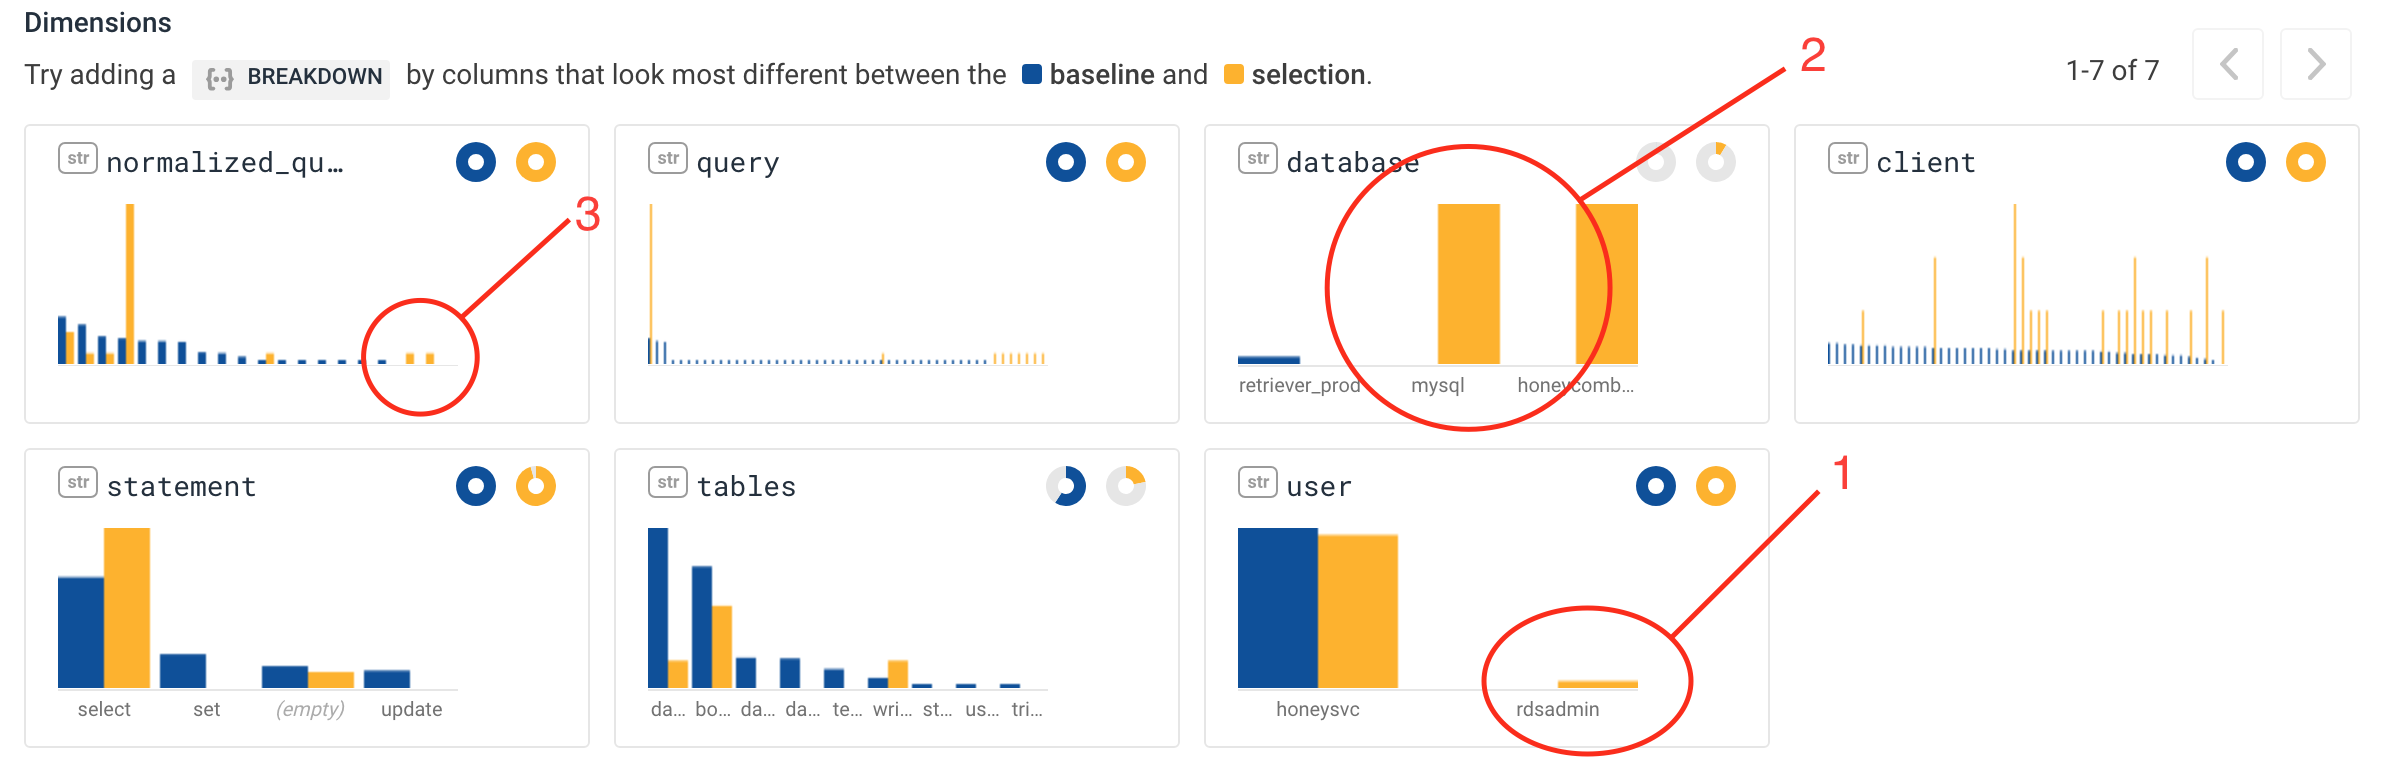 |
Hovering over the queries that only happened in the selection, you see this one: flush logs. This is the likely culprit, a MySQL query that, among other things, flushes the binary logs used for replication. This would likely stall many or all database queries while the log was being flushed and reopened. |
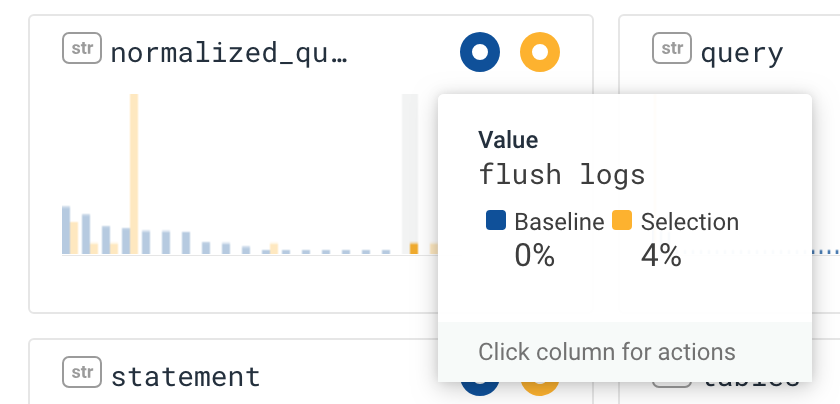 flush logs is a query that was only run in the selected area of the heatmap. |
So now we're reasonably sure that we've verified that a flush logs command generated the database stall that kicked off our failure. Now let's examine some of the issues that amplified this issue.
Cache expiration behavior
Honeycomb's API servers are responsible for extremely high volumes of data ingest, and thus need to be optimized both for performance, as well as producing the minimal amount of load possible on our central database server. In this case, we are caching a lookup translating from user-friendly dataset names to our own internal dataset IDs.
This happens via this code (simplified and summarized in psuedocode for compactness):
func FetchDatasetFromTeamAndName(teamAndName) {
    if (id = cache.Get(teamAndName)) {
        return id
    }
    id = FindDatasetByTeamAndSlug(teamAndName)
    cache.SetWithTTL(teamAndName, id, nil)
    return id
}
There are a few things to note about this implementation:
- The
teamAndNamecache key is a cache key with an TTL (time to live) - in this case, one of 60 seconds. TheGetcall will either returnnilor an expired value, depending on how it was initialized withSetWithTTL- more on that below. - If there is no entry found in the cache, the
FindDatasetByTeamAndSlugmethod is used to retrieve a value to use to fill the cache. This method invokes a database call, which can take a potentially arbitrary amount of time to execute. cache.SetWithTTLhas anilas the third argument. This means that we are not providing a function to refill the cache. If a refresh function is provided, thecache.Getcall will return an expired value and invoke a refresh function (only once) to fill the cache. Sincenilwas provided, however, the cache will returnnilif the TTL has expired.
So what does this mean?
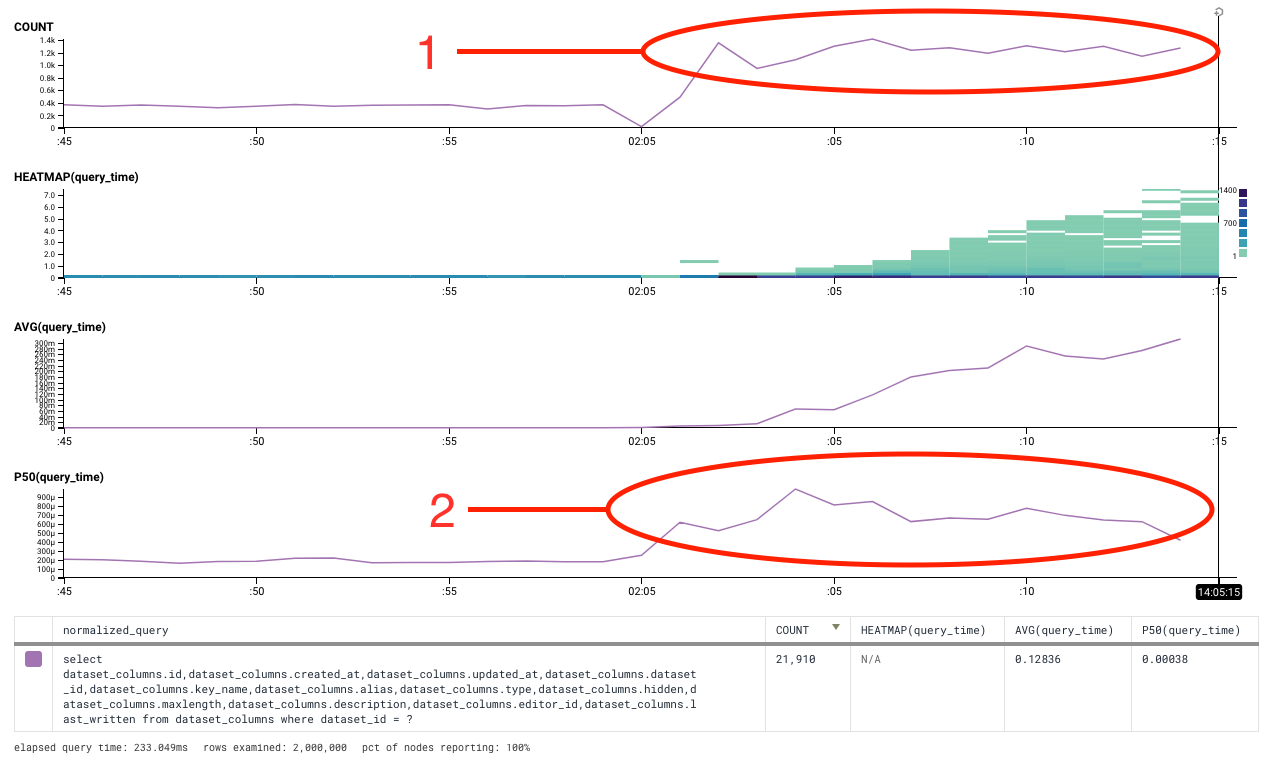
For every call to FetchDatasetFromTeamAndName after the cache has expired, we will make an additional call to FindDatasetByTeamAndSlug, invoking an additional database call. How did this manifest in the incident? Let's take a look at the database queries associated with this query in the first few seconds after the database stall.
Breaking down our calls to FindDatasetByTeamAndSlug broken down by cache key, we can see that:
|
 |
If we HAD implemented the cache.SetWithTTL refresh function, e.g. cache.SetWithTTL(teamAndName, id, FindDatasetByTeamAndSlug), we would have avoided this entirely.
Cache bug/misdesign inadvertently clears caches
In addition making unnecessary cache fill calls between expiration and the cache being refilled, there was also another issue with the design of the cache that amplified the problem. Let's look at the implementation of the Get call in the cache (again in simplified pseudocode to improve readability):
func Get(key string) {
    RLock() // cache read lock
    defer RUnlock()

    val, found := store[key]
    if !found {
        return nil, false
    }

    if val.isValid(time.Now()) {
        return val.value, true
    }

    if val.callback == nil {
        // no refresh callback.  delete the entry and return.
        defer func() { go Delete(key) }()
        return nil, false
    }

    // ... some code to call and fill if we have a refresh callback ...

    return val.value, true
}
The important line to note here is this one: defer func() { go Delete(key) }(). This means that rather than deleting the key immediately, the key is deleted in a goroutine spawned AFTER the body of Get completes (golang read locks can't be promoted to read/write locks). In normal conditions, this Delete happens immediately after the Get.
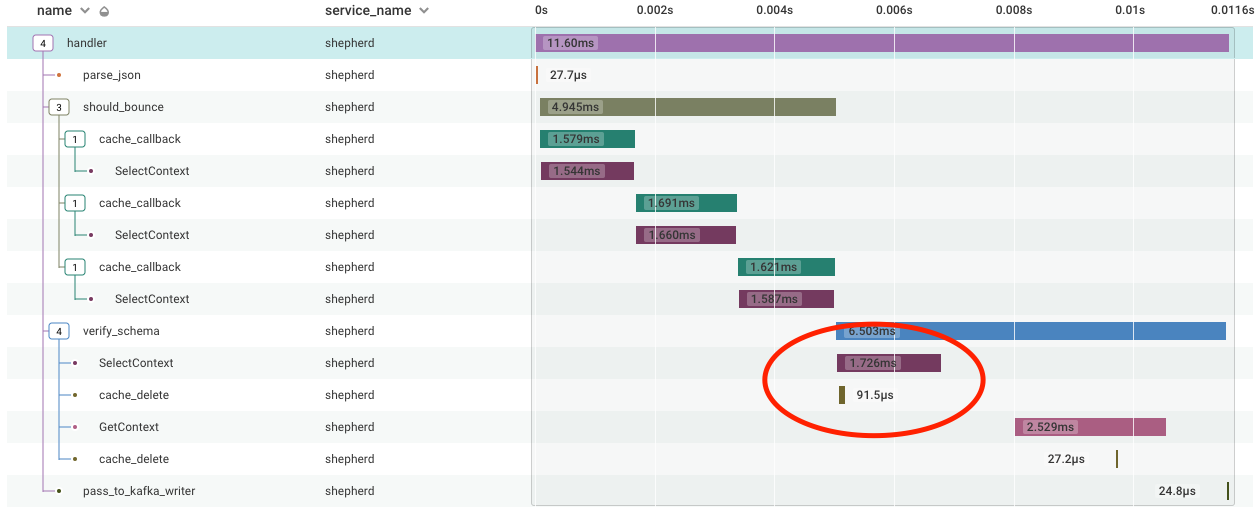
If you look at FetchDatasetFromTeamAndName, remember that if the Get returns nil, it invokes a FindDatasetByTeamAndSlug to retrieve a value to fill the cache. In normal operation Delete happens more quickly than FindDatasetByTeamAndSlug, as the latency on a database call is usually longer than that of a local goroutine spawn and execution. Let's take a look at an example in normal operation (note that we are using traces for verify_schema, which implements a similar pattern).
You can see that in the verify_schema function, the cache_delete calls begin after the associated database call (SelectContext) but completes before those database calls complete, successfully deleting the cache. |
 |
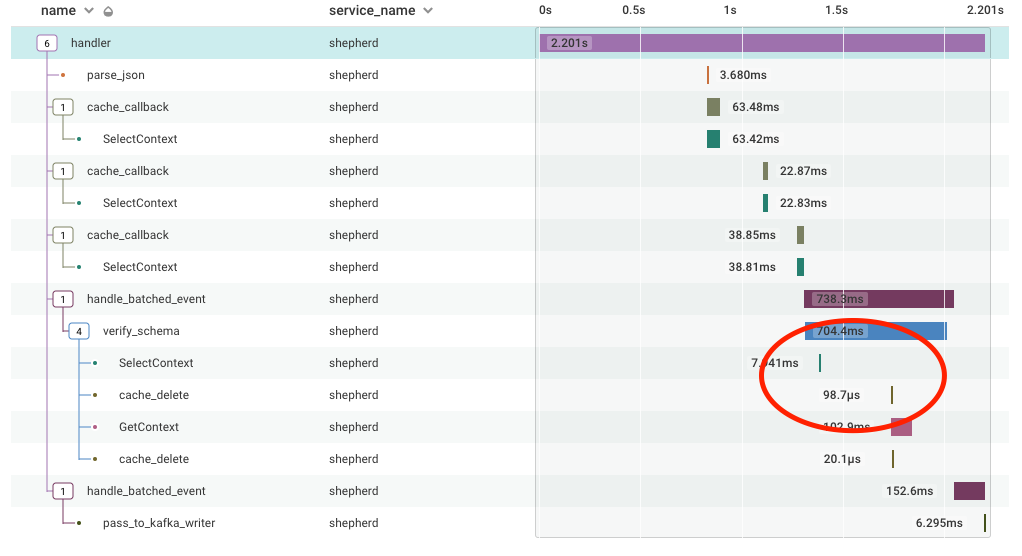
But what happens if there are a significant number of goroutines and resource contention? There isn't a guarantee on how long it takes for the goroutine to spawn and execute the Delete, and thus there is no guarantee that the Delete happens before the user fills the cache. Let's take a look at a trace that happened during the outage:
You can see that this time in verify_schema, the cache_delete call happens after the SelectContext call which fills the cache, meaning that less than a second after the cache was filled with a new value, the new value was deleted! |
 |
The net result of this is that even once we filled the cache, these delayed deletes would clear the cache well before the normal 60 second expiration, causing more cache fills (and more Deletes. In the long run, this not only made the cache ineffective, but generated many thousands of extra goroutines and Delete calls adding to lock contention on the single global lock.
Database queueing adds latency and reduces throughput
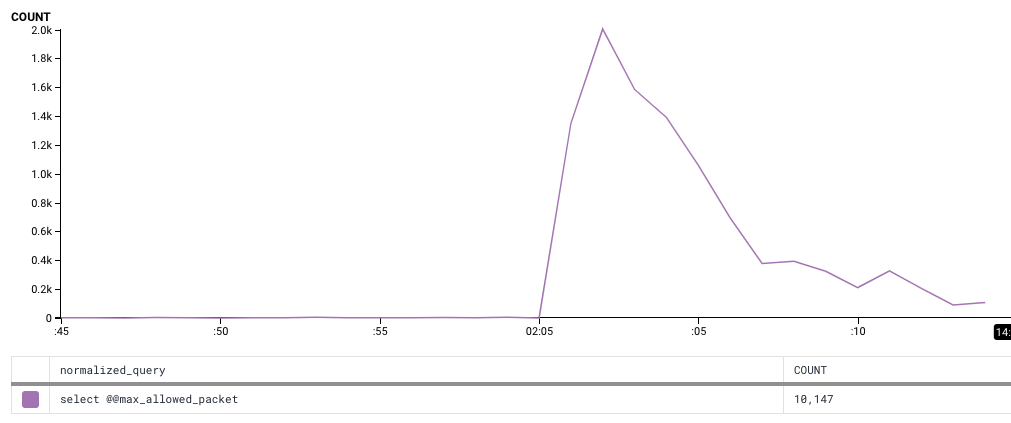
In the first discussion of cache expiration above, we mentioned that until the cache was filled, every request for the cache value would induce additional database load. Thus, the longer it took to fill the cache, the more load was induced. In addition to the database itself being under more load and taking longer to execute, we also mentioned that there was additional latency being introduced by database calls queueing on the API servers waiting for a free connection from the connection pool to be available. How do we know this?
The graph to the right represents the number of queries that are run when establishing new connections (select @@max_allowed_packet is run on each new connection). You can see the huge spike in the number of new connections, and that it dwindles to near zero after about ten thousand connections are created. This corresponds to the number of API servers * the maximum connection pool size on each server. In other words, all of our connections are used and active. |
 |
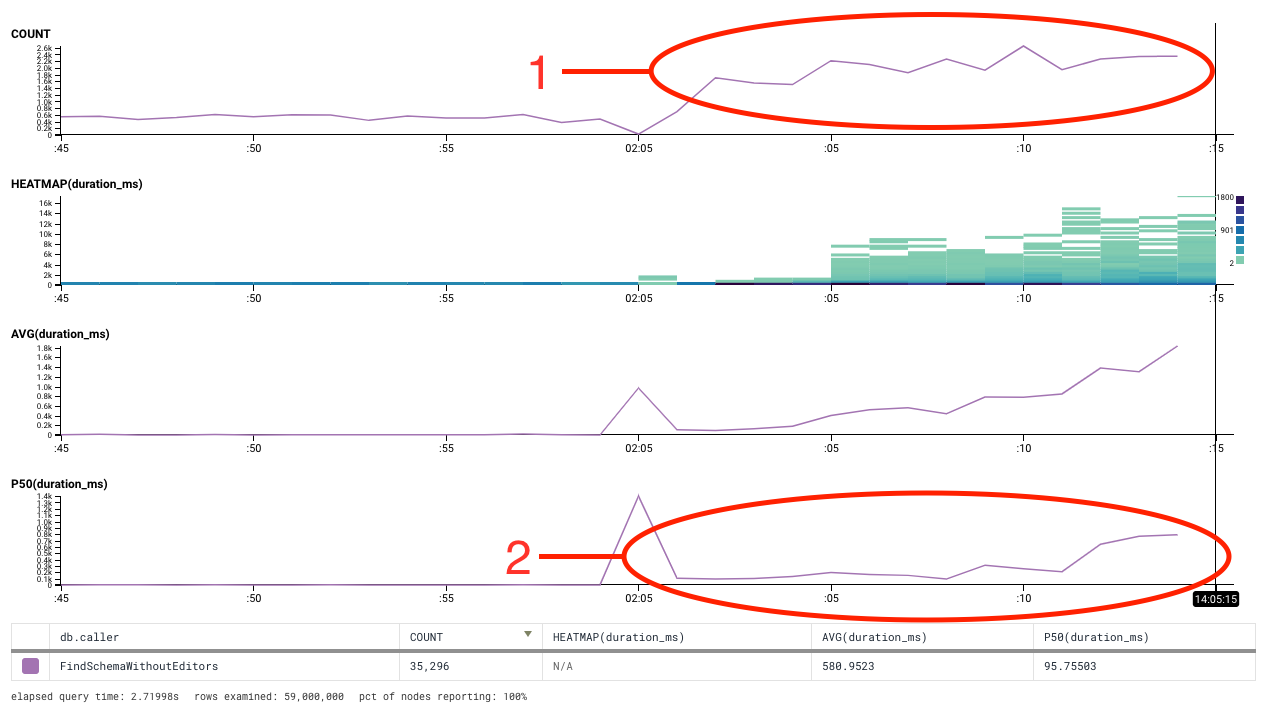
Now let's take a look at the latency of querying, as observed by the database and the API server. First, let's take a look at the database.
|
 |
Now let's take a look at the API server's query latency, as measured outside of the go DB driver layer. Initially, it looks very similar.
|
 |
Since it only happens on the API server, the guess that we had is that it was related to queuing of queries by the database driver. We don't do any manual queuing of our own, so our guess was that the database driver did some queuing of its own. One of our engineers (lizf) dove into the golang SQL code, and discovered that the current golang SQL connection pooler essentially services queued requests in random order. This meant that once the connection pool was saturated, it could take an essentially random amount of time for any individual request to be serviced.
In summary, this meant that once we had more outstanding requests than connections, there was no guarantee that a request would be serviced - instead, there was just a probability that a query would be serviced based on how many outstanding queries were waiting to be fulfilled. This would result in requests being fulfilled at an AVERAGE of 50% of the outstanding query count * query duration, but individual queries could be fulfilled in an arbitrarily short or long time. This explains the spread in heatmap values over time in the graph.
This results in suboptimal behavior, where server resources are sitting idle waiting for queries that take an arbitrary, but increasing amount of time. One of those resources is the connection from the load balancer to the API server - which means that we are artificially reducing our throughput by reducing the average requests per second each load balancer connection can perform.
In general, we would rather have 90% of our requests succeed quickly and 10% fail, rather than have almost 100% of our connections time out, having accomplished nothing.
Instead of this behavior, there are a couple of different options:
- Perform no queueing at all, and simply reject queries if all of the connections are full.
- Service requests LIFO (last in first out), so that most requests are serviced quickly, and some connections time out.
If you are interested in more details, we have filed an issue filed against the go database driver: https://github.com/golang/go/issues/31708
Combining it all together
Combining all the above factors together, we end up with a situation where a single 1.5 second spike in database load that:
- Induced more load on the database in the form of excess cache refresh calls for an expired cache.
- Which slowed down future cache refresh calls.
- Which were more frequent because of the cache deletion bug that inadvertently cleared caches, especially under heavy load.
- Which resulted in database requests taking longer to fulfill because they were queued.
- Which resulted in requests taking substantially longer to fulfill.
- Which resulted in highly degraded throughput on our API servers.
- Which resulted in our API servers rejecting most incoming traffic.
Let our pain be your gain
Hopefully this detailed analysis of the underlying causes of our outage help you understand the nature of a feedback loop-based outage - and how to use Honeycomb to analyze and understand your system's behavior.
Here are some of the things we've learned:
- Don't assume that things that are behaving fine now will behave properly in the future. Changes in usage of your system, as well as changes to the system itself can cause problems that seem to be small to become larger in the future.
- Don't assume that an asynchronous process starts executing immediately. Think about what happens if there is a significant delay in execution. Don't make assumptions about about local execution time vs. remote execution time.
- Understand the behavior of your queues. Order of execution, queue length, and queue timeouts can greatly impact behavior and can result in higher latency, resources being underutilized, and work being executed that is no longer useful.
- Latency is as important as utilization. Even if your resources have low utilization, latency can have significant impacts on the stability and throughput of your services. Make sure you understand how latency impacts your services.
And, of course, once you learn from an incident, you need to use that knowledge in order to help prevent future incidents. See our first blog post about this outage, Caches Are Good, Except When They Are Bad to see the list of remediation items that will help us reduce the likelihood of this and other cascading failures from happening in the future.
Want your observability tooling made by folks who know what it means to run a modern production service? Try out Honeycomb for free.
Related Posts
What Is Application Performance Monitoring?
Application performance monitoring, also known as APM, represents the difference between code and running software. You need the measurements in order to manage performance....
Where Does Honeycomb Fit in the Software Development Lifecycle?
The software development lifecycle (SDLC) is always drawn as a circle. In many places I’ve worked, there’s no discernable connection between “5. Operate” and “1....
How We Leveraged the Honeycomb Network Agent for Kubernetes to Remediate Our IMDS Security Finding
Picture this: It’s 2 p.m. and you’re sipping on coffee, happily chugging away at your daily routine work. The security team shoots you a message...