Ask Miss O11y: As a developer, how can I try out observability?
By Jessica Kerr | Last modified on July 20, 2023Dear Miss o11y,
What's the first small thing to do in o11y that would teach me something, bring something valuable, and open the way for something else?
Observability doesn’t have to be a big, company-wide project. It can be useful locally and individually. A little playing around can get you some crucial insight into how your software works. Try it as a team, or in a pair, or by yourself.
It takes 3 steps:
- Make a place to send your data
- Tell your app to send the data
- Profit!
Step 1 is easy. The other two might take ten minutes, or maybe more like a day.
Make a place to send your OpenTelemetry data
The trick is to hook up OpenTelemetry libraries as you run your application locally, and let it send events to a local-development environment in Honeycomb. This keeps your events separate from production events. If you don’t have the access you need, a free Honeycomb team will be plenty for your purposes. Sign up, create an environment called “dev” or “test” or whatever you’d like, and snag your API key.
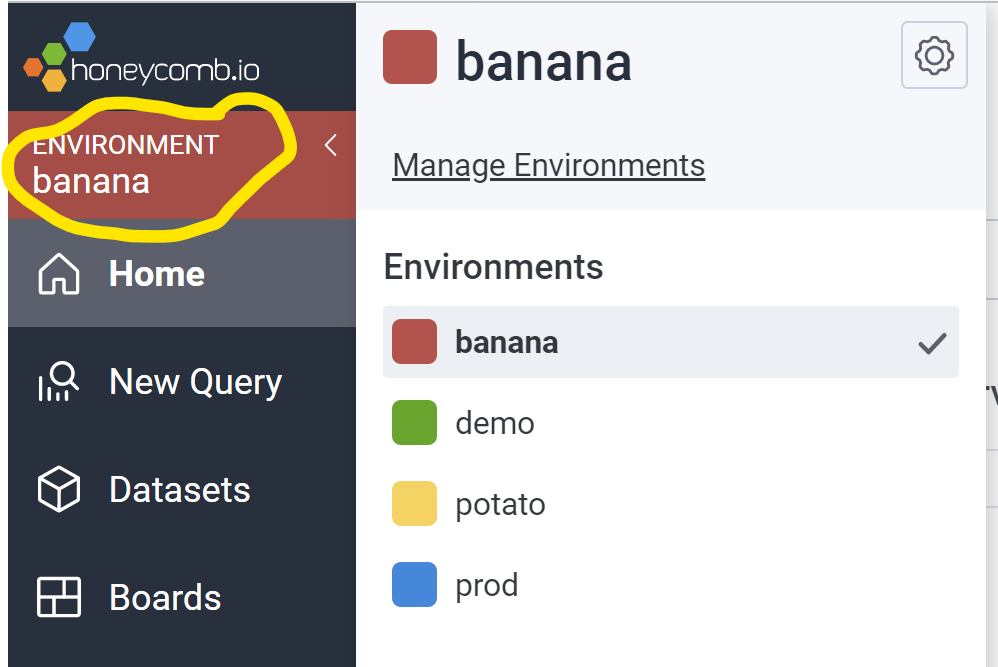
If you’re using an existing team, bring up the Environments menu by clicking on the colored environment selector in the top left, under the Honeycomb logo. You can create a new one or find API keys for existing environments by choosing “Manage Environments.”
Get that API key, put it in an environment variable called HONEYCOMB_API_KEY.
Also! Give your service a name in an environment variable called SERVICE_NAME. That will determine the dataset your events land in.
Now for the part that’s different for everyone….
Tell your app to send the data
Bring in OpenTelemetry libraries to get your application to send events to Honeycomb. This is auto instrumentation: when the library happens to know that you probably want to hear about incoming and outgoing requests, database calls, etc.
This part might be easy. I’m going to use the two easiest ones as examples.
If you work on a Java app: download a javaagent jar, and then add a JVM argument: --javaagent honeycomb-opentelemetry-javaagent-1.1.1.jar when you start your application.
Then again, there’s a lot behind “when you start your application.” That’s different in each environment and developer setup. In IntelliJ, check your Run Configuration. If you use Maven, you might add the agent to the POM (example). For everything else, there’s the OpenTelemetry and Honeycomb documentation.
If you work on a Node.js app: create a tracing.js file with contents from this gist. Install the dependencies listed there. Then! Wherever you start your app, add a new argument to `node` to require that file you created. If tracing.js is at the project root, It’ll look something like:<node --require ./tracing.js <more arguments> <whatever your main file is>.js
Then again, “wherever you start your app” might be hard to find. Development environments vary. Instead, you can import tracing.js at the top of your application’s starting file. If you’re using TypeScript, you may have to turn off strictness for the moment.
For every other application: there’s OpenTelemetry documentation for eleven languages as I write this (June 2022). Honeycomb provides additional help with .NET (docs, sample app), Ruby (docs), Node.js (docs, sample app), JS in the browser (docs), Go (docs, sample app), and Python (docs, sample app). When in doubt, google “<your language and framework> OpenTelemetry” – open source support is forever growing!
Getting your application to send data is easy when it works, frustrating when it doesn’t. Each Honeycomb docs page linked above has a Troubleshooting section at the bottom. If you want personalized help, your Honeycomb team comes with an invitation to our Pollinators Slack. Bonus: you can chat with Miss O11y herself during office hours – we love helping you get up and running in Honeycomb so please tell us what you’re stuck on!
Oh! Don’t forget: after you run your application, do something in it. Trigger some requests, whatever it is you do for manual testing locally.
And then when it does work–when you finally get data in–what then?
Profit!
I promised you insight into your software. Where does that come from? Looking at data! But what data? It’s hard to know where to start. We have a whole workshop for this, but meanwhile–
Here’s a hint:
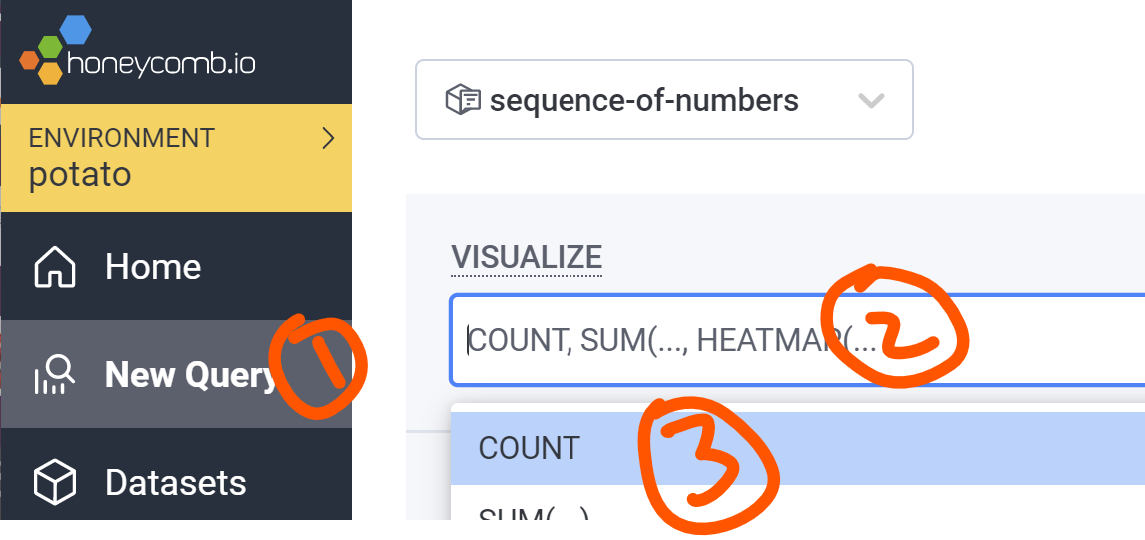
- New Query
- Click in Visualize
- Choose Count
- Ctrl-Enter (or push Run Query)
Maybe you’ll see some exciting purple spikes, indicating something.
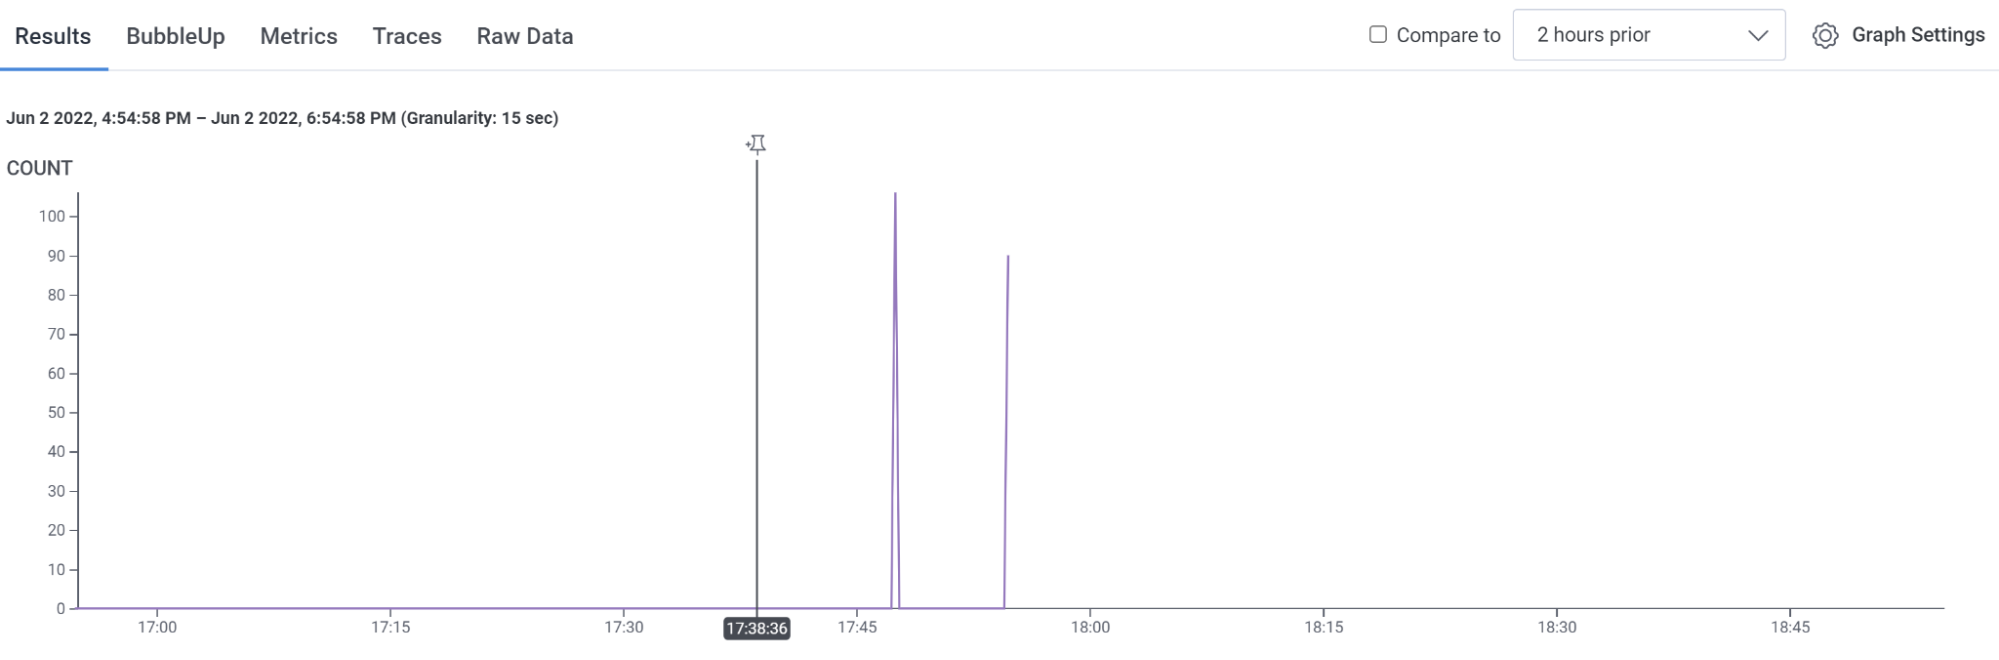
Next hint!
- Click one of the spikes. Click on it near the top, where a round dot appears under your cursor.
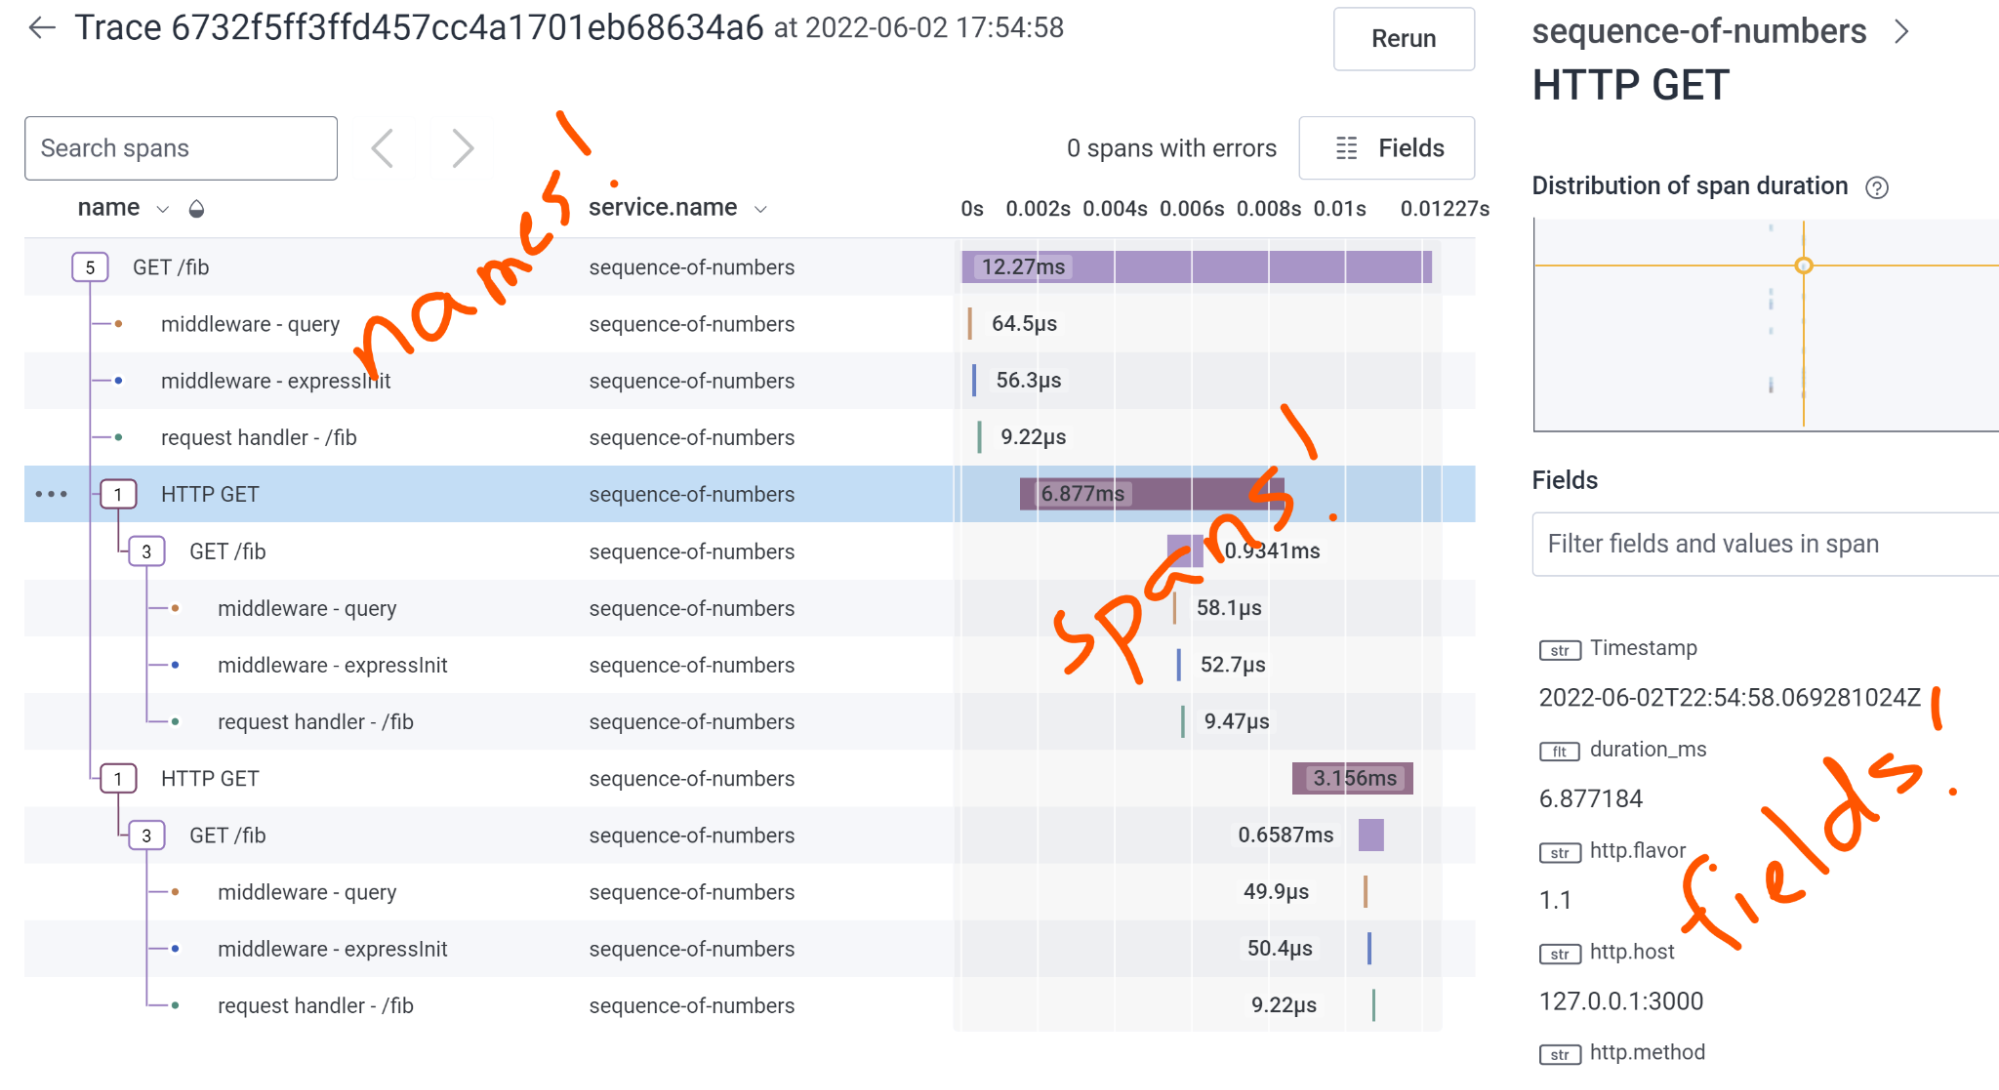
- A trace appears! (“ohhhhhh”)

- Click on its rows, which are spans. See its fields on the right. See how long each took in the pretty waterfall view.
Hint: If nothing happens when you click on a spike, cheat. Select “Traces” above the graph. Then scroll down to see a list of traces; choose one and click its icon on the left to view it.
Now you see a trace! Hopefully.
Now for the insight!
Look at the names of the spans on the left, starting with the root span on the top. Do you recognize it? Is this a request that you sent on purpose?
Look at the times of the spans. Are they fast? It’s a local test, so probably. Look at the tree structure on the left. Does it express what caused each child to happen? Can you explain why?
Click on different rows (spans) and see their fields on the right. Scroll or search in that section to see more. Do any of them represent a database query? See if the query string is shown. Does it match what you expect?
Every trace is different. While some fields are standardized, the auto instrumentation for each framework sends what it chooses. Click around and see what you can see.
The magic happens when you combine your knowledge of the software with what the trace has to say. Can you find any surprises?
Does anything make you say, “wait, It’s doing what??” (This is more common in prod than local testing, but you might get lucky.) At Honeycomb, we call this “Mean Time To WTF” and it’s a measure of successful tracing.
Once you can see traces from your local environment, you have the power of observability during development.
Next Steps
If you’ve succeeded at finding some profit in tracing, then share it with your team. Can you use the trace to explain to a new team member what the software does?
Then maybe they’ll all want to put it in production. And, maybe other teams will choose to join in, and then you will see distributed traces across production service calls, and that’s where the real profit is. The most interesting WTFs are waiting for you in production events.
Meanwhile, wherever you’re stuck, we want to hear from you! Or if you got a trace that you like, we’d love to see it! Join our next Intro to Observability Workshop or talk to us in office hours, on Twitter, or send us an email. Be warned: any questions you ask may appear in future editions of this column. :-)
Related Posts
Real User Monitoring With a Splash of OpenTelemetry
You're probably familiar with the concept of real user monitoring (RUM) and how it's used to monitor websites or mobile applications. If not, here's the...
Transitioning to OpenTelemetry
This article touches on how we at Birdie handled our transition from logs towards using OpenTelemetry as the primary mechanism for achieving world-class observability of...
Instrumenting a Demo App With OpenTelemetry and Honeycomb
A few days ago, I was in a meeting with a prospect who was just starting to try out OpenTelemetry. One of the things that...