Exploring AWS Costs Beyond the Service Level
By Ben Hartshorne | Last modified on June 21, 2022Honeycomb uses AWS Lambda as a core part of our query execution architecture; Lambda’s ability to quickly allocate lots of resources and charge us only for use is invaluable to keeping Honeycomb fast and affordable. Our total Lambda bill is easily accessible in the AWS Console, but how do we know which customers or application areas dominate this bill? How do we judge the cost of changes we make to our own software?
This post will talk about using a derived column to directly connect individual customer experiences to the cost of providing that service with AWS Lambda. By leveraging these tools, we can better understand when our product is used in costly ways, and also provide tooling to better analyze and understand the cost effects of configuration changes.
AWS Lambda pricing
First, a little background on AWS Lambda and how the charge structure works there. AWS’ Lambda pricing page has all the details, but I’ll highlight the parts that are relevant for this post. For us, the cost is a function of three things:
- The architecture of the Lambda (ARM or x86 - ARM is cheaper)
- The size of the Lambda, as measured by RAM (cost by RAM is linear: twice the RAM is twice the cost)
- The duration of the Lambda invocation, in milliseconds
AWS provides a table of costs for common RAM configurations, but since the relationship is linear, it’s easy to set up a formula using the largest Lambda size. Using the largest Lambda as our baseline, the price per millisecond for a Lambda of arbitrary size will be (configured RAM / 10240) * Lambda price. From the pricing page table, the price for a 10240 sized x86 Lambda in US-East (Virginia) is $0.0000001667, more easily written as $1.667E-07. If we were to launch a Lambda with 2560MB RAM (1/4 the maximum size), the cost would be $4.168E-08 per millisecond (1.66E-07 divided by 4). By multiplying this value by the duration of our lambda invocation, we have the cost for that specific Lambda to run.
Instrumentation
There are a couple of ways to get this data into Honeycomb. You can use CloudWatch Logs to get invocation records directly from AWS that include all three of the needed attributes (architecture, configured memory, and duration), but they won’t have any application-specific data.
Given this is Honeycomb, I want to be able to know not just overall summaries but per-customer or per-query data. For this, we need to use in-app instrumentation. Thankfully, direct instrumentation using OpenTelemetry or the Honeycomb Beeline is easy. Instrumentation can then be sent directly to Honeycomb or sent out of band using the Honeycomb Lambda Extension.
When our query engine spins up a Lambda function as part of calculating a result, it includes some customer-specific identifiers (the Dataset ID) as well as the source of the query that’s running (whether it came from a person clicking the “Run Query” button or loading a Board, looking at a Trace waterfall, and so on). It also interrogates its environment; the configured memory for the Lambda is available as an environment variable named AWS_LAMBDA_FUNCTION_MEMORY_SIZE.
The first thing the Lambda function does when it starts is open a new span with all these fields. By adding a hook to ensure the last thing the function does is close that span, we have a span that represents almost* the entirety of the Lambda invocation. It includes everything we need, from the Lambda architecture and configuration through the specific part of the application being exercised—and all the way to customer-specific data.
*(I say “almost” here because it doesn’t count Lambda initialization time, for which you are billed. But that is relatively constant, so for our use it’s ok to ignore it. At worst, it will result in minor under-reporting.)
{
   "app.dataset_id": 1234,
   "app.query-source": "trace",
   [plenty of other good stuff here too]
   "duration_ms": 594.359,
   "lambda_fn_arch": "amd64",
   "lambda_fn_memory": 4423,
   "name": "Invoke",
   "service_name": "lambda",
   [tracing fields omitted]
}
The derived column
Now that we’ve got our source data, let’s put it together into a derived column! Refer to the Derived Column Syntax documentation for help building your own.
In this derived column, we start with a few equality filters to ensure the values only appear on the specific span that has the instrumentation we need. These filters are on the service name and the span name, “Lambda” and “Invoke” respectively. By using the two-clause form of IF (the conditional and the “true” case, we’ve left out the “false” case), we will only run the calculation for spans that match name and service name, increasing clarity when looking at results. Finally, for spans that match our filter, we then multiply the duration by the calculated cost based on architecture and configured memory.
IF(
  AND(
    EQUALS($service_name, "lambda"),
    EQUALS($name, "Invoke")
  ),
  MUL(
    $duration_ms,
    MUL(
      DIV(FLOAT($lambda_fn_memory), 10240),
      IF(EQUALS($lambda_fn_arch, "arm64"), 1.33e-7, 1.67e-7)
    )
  )
)
Understand current patterns
Let’s put it to use! Which costs more, in terms of Lambda use: the Honeycomb Triggers product, or Service Level Objective (SLO) calculations?
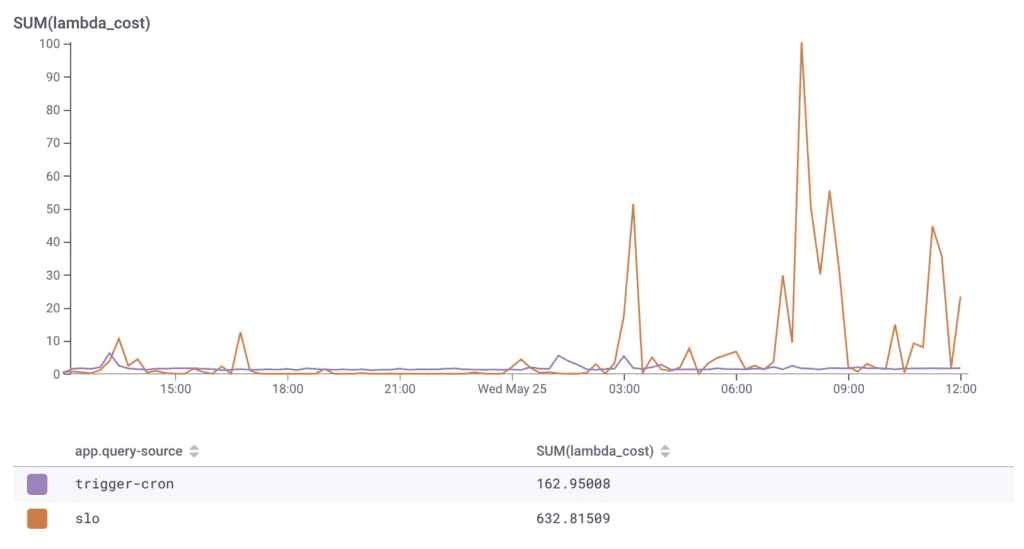
SLOs and triggers are both pretty cheap, from a Lambda cost perspective. SLOs are a bit more expensive, but they’re also wildly more useful to our customers—so in terms of the cost-to-value ratio, it’s a good place to be. For full transparency, this isn’t really a fair comparison: both triggers and SLOs are designed to try and stay off Lambda as much as possible. But it does well as a starting point.
This derived column also gives us a method to validate our expectations of customer use—if a customer is incurring a much larger (or smaller) Lambda bill than other similar customers, it’s an interesting thing to explore. Further, it lets us set up some triggers to let us know when something new is happening that might incur a large Lambda cost.
From the graph above we see that trigger costs are normally pretty low ($150/day), but a few times in the past, we’ve been surprised by triggers costing more than we expected. We set up a Trigger that says “please let us know when any individual customer exceeds $100 in Lambda costs from their triggers in a single day.” SUM(lambda_cost) WHERE app.query-source = "trigger-cron" GROUP BY app.dataset_id.💥
Now we’ll get an alert in Slack, and it will let us look more closely at what’s going on there to see if there’s a bug or a product improvement we could make. Yes, we’re using triggers to trigger us if triggers are misbehaving, triggering oncall trigger triggers. Trigger.
Running new experiments
All this is great to understand our current usage, but how does this come into play when it’s time to make improvements or run experiments? We recently wondered if our chosen Lambda size was correct. If we ran Lambdas that were half the size, would they take twice as long? Or would Lambdas run out of memory calculating partial results? It’s not super clear whether they’re constrained on CPU, RAM, or the network, so we ran real-world experiments to find out.
We used this derived column to get actual dollar numbers for each configuration, right there next to the performance of the code! Shoutout to the AWS Lambda Power Tuning tools—they’re really great for helping manage this kind of analysis.
To shorten the story, I’m going to jump past the actual experiment configurations: a mix of ARM and x86 Lambdas with a collection of sizes: 7076 (our starting config), 5307, 4423, and 3538. We look at how the changes impact runtime (via average, p50, p95, and p99) as well as the overall cost, in dollars (There’s more detail on the x86/ARM comparison in our blog post about Graviton3.)
Normally, given the large mix of configurations, determining cost savings would be a complicated spreadsheet with data copied from several different sources. It becomes even more difficult when you bring variable runtime durations into the picture. In the end, we continue to run a mix of x86 and ARM Lambda instances. We did decrease our memory needs and retained the overall runtime of any given invocation.
How much did we save with these two efforts? I made a copy of the Lambda_cost derived column that assumed a fixed size and assumed 100% x86 Lambdas, representing our original configuration. By using both derived columns in one graph, we can clearly see the savings vary as we tweak our experiment parameters.
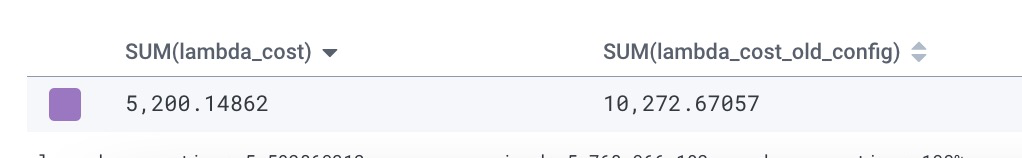
Woooo! 50% lower Lambda costs while providing a consistent customer experience is a big win.
Wrapping up
Maybe we should keep going and continue to tune it! Or maybe we shouldn’t, as sometimes continued optimization yields half the benefit for twice the work.
The thing about using a derived column that translates mysterious “compute” units into real dollars is that it can anchor the more challenging conversations around optimizations in a practical reality. Should we invest in reducing the cost of feature A or B? When is it more important to shift from optimization work back to feature development work? Having the effects of these changes reflected in real dollars can help guide a conversation around developer time and makes it easier to set thresholds for when to stop doing optimization work—as well as highlight when it’s really worth the effort.
Take this derived column for a spin in your own Lambda instrumentation (or any other resource that is billed by time—this isn’t just for Lambda! Get creative.) and let us know how it goes! Will you discover insights into your application resource costs or specific customer behavior that you didn’t see before? Can you more easily set a bar for when intervention is necessary, and set triggers to let your customer-facing staff have more targeted conversations with the customers that most impact your bottom line?
Please share what you find by chatting with our Slack Pollinators community or Tweeting at us: @honeycombio. I look forward to hearing your stories!
By the way, we are a Graviton Ready Partner, so we’re as ready as ever to continue supporting our customers as they optimize with any AWS integrations.
Related Posts
Driving Culture Change: Phorest's Observability Transformation
Phorest delivers a premier software solution that empowers their salon and spa business customers to thrive. Ensuring every engineer has access to an observability tool...
What Is Application Performance Monitoring?
Application performance monitoring, also known as APM, represents the difference between code and running software. You need the measurements in order to manage performance....
Where Does Honeycomb Fit in the Software Development Lifecycle?
The software development lifecycle (SDLC) is always drawn as a circle. In many places I’ve worked, there’s no discernable connection between “5. Operate” and “1....