Adding Code Tags to Your OpenTelemetry Spans
By Martin Thwaites | Last modified on July 25, 2022In this article, I’m going to walk you through adding attributes to your spans in .NET that contain information about the code that generated the span. We’ll also look at ways to do this automatically using a library I’ve created.
What is OpenTelemetry?
OpenTelemetry is an amazing project that provides a standardized way of sending telemetry information between your services, and also to systems that can visualize that information (referred to as Telemetry Analysis tools or Backends).
What are span attributes?
One of the reasons that OpenTelemetry is great at doing this is that a lot of the common attributes you may find on a span are given standard names, so the systems receiving the data to visualize them don’t need to know the specifics of your system. This is really a superpower of OpenTelemetry, as it gives a level playing field for consumers of that information—meaning that you, as a developer, can forget about vendor-specific things.
Some examples of this are when you’re working with a HTTP API. The URL will be http.url, the method will be http.method, and the status code will be in http.status_code.
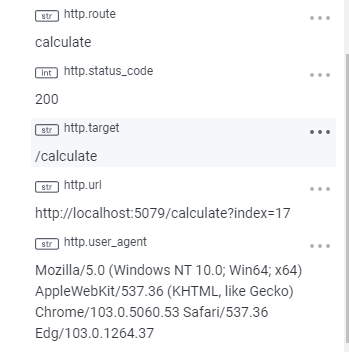
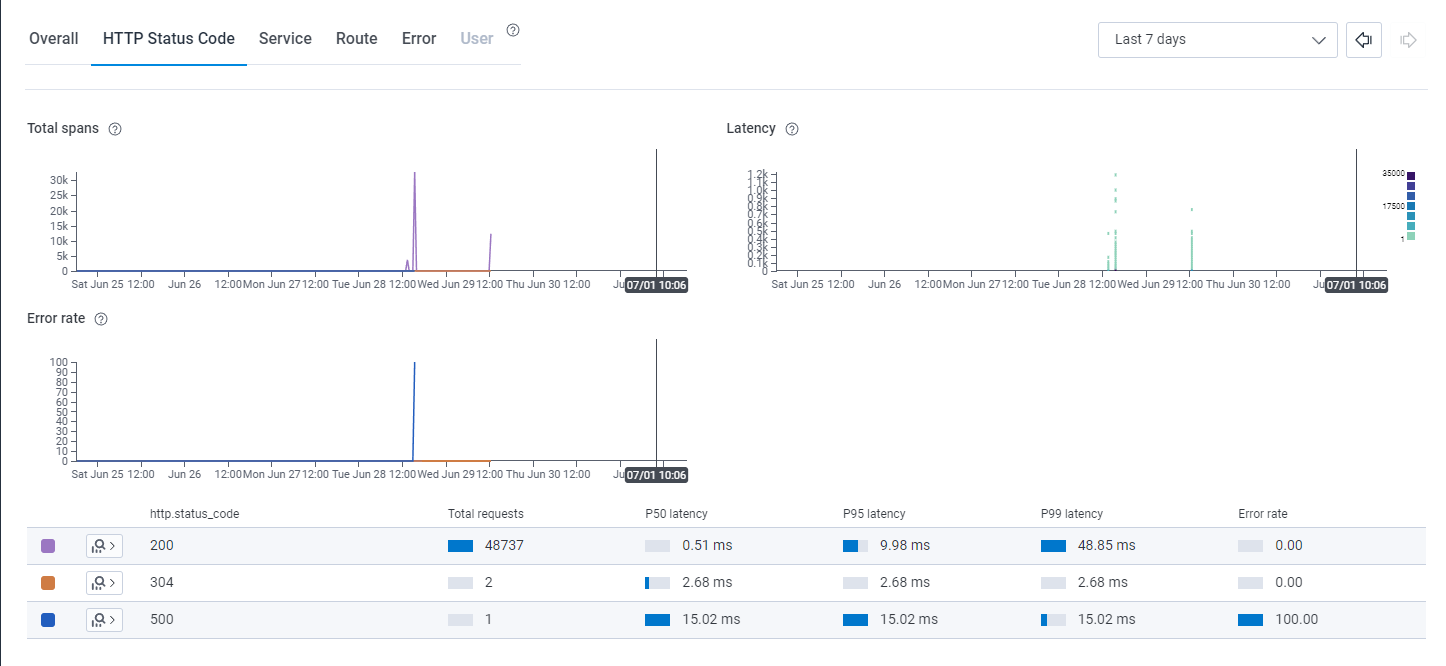
This allows the visualization system to show cool things. It knows more about your system from day one, as you can see from this example of the Honeycomb environment dashboard.
What I’m referring to here, however, are the attributes that specifically relate to the code information. These all sit under the prefix code.* in the trace semantic conventions documentation on https://opentelemetry.io.
What do the code attributes give us?
On their own, code attributes will give you information about the code that produced the data. This, in and of itself, is useful. The things that are currently defined in the OTel specification are:
code.linenowhich should point to a line numbercode.filepathwhich should point to a file for the file that generated the spancode.functionwhich should by the name of the calling function
These are pretty generic and obviously built to be language-agnostic.
How can we add the attributes in .NET?
Within the .NET framework, we have access to a few methods that will provide this information in a managed way. These are part of the Caller Information attributes that the framework gives us.
We can create a single static method that will give us all the information:
public static (string filepath, int lineno, string function)
      CodeInfo(
          [CallerFilePath] string filePath = "",
          [CallerLineNumber] int lineno = -1,
          [CallerMemberName] string function = "")
       => (filePath, lineno, function);
This will provide a Tupleback with the file path, the line number that called the method, and the name of the function.
We can then use this method to extract the attributes and apply them to the span:
using var span = ActivityHelper.Fibonacci.StartActivity("calculation");

var (filepath, lineno, function) = CodeInfo();
span?.AddTag("code.function", function);
span?.AddTag("code.lineno", lineno - 2);
span?.AddTag("code.filepath", filepath);
Note: the line number is actually reduced by 2 as there is an offset, and we want to represent the line number of the span creation, not the line number of the line where we get the code information.
This will give you some attributes that look like this:
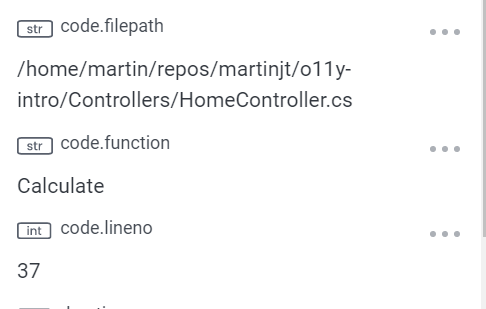
That can be incredibly useful when trying to pinpoint the issues in your code from your tracing.
Adding code attributes automatically
As we’ve established in the above section, code attributes are really useful. Adding the code manually every time you use Activity APIs would be error-prone and noise in the code.
I’ve created a package, using source generators, that will automatically augment your manual instrumentation with those code attributes.
To use this, you install the nuget package:
dotnet add package ActivitySourceCodeAttributes --prerelease
That’s it. Now, all the spans you create will automatically have those attributes. As an added bonus, the library will introduce a new attribute called code.urlwhich will contain a link to your repository in GitHub (only the GitHub cloud is supported right now).
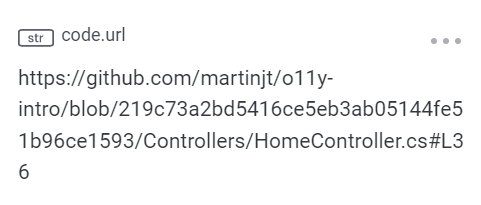
Specifically, this url will take you directly to the commit that generated the code that generated the span. This provides some powerful capabilities in the observability backend to drill from the spans right into your code.
Conclusion
Code attributes are really useful and powerful. They can be onerous to add, and will likely be seen as noise in the code by the developers—therefore, automating them is key.
There is now a package that you can install, and it will do all the boilerplate actions for you.
If you’d like to try this out in a lightweight environment, you can spin up a free account in Honeycomb and see the data without any other infrastructure.
Related Posts
Introducing Relational Fields
Expanded fields allow you to more easily find interesting traces and learn about the spans within them, saving time for debugging and enabling more curiosity...
Real User Monitoring With a Splash of OpenTelemetry
You're probably familiar with the concept of real user monitoring (RUM) and how it's used to monitor websites or mobile applications. If not, here's the...
Transforming to an Engineering Culture of Curiosity With a Modern Observability 2.0 Solution
Relying on their traditional observability 1.0 tool, Pax8 faced hurdles in fostering a culture of ownership and curiosity due to user-based pricing limitations and an...