Dashboards Can Be More Than Just Expensive TV
By Sasha Sharma | Last modified on August 29, 2022Someone once described dashboards to me as “expensive TV for software engineers.” At first, I stood there quietly shocked—dashboards had informed many root cause analyses (RCAs) in my life as a developer. Dashboards can be expensive TV—and sometimes even harmful false cocoons of safety (“Uh, p90 looks okay 🤷♀️!”) —but, approached instead with an analytical lens, they should be a pulse check for overall system health and a jumping-off point for investigations.
How not to use dashboards
I asked this wise naysayer why they dismissed dashboards so thoroughly and their answer was a great lesson in the socio-technical element of debugging. Often, as engineers, we tend to apply preformed notions of our systems to our observability efforts. Dashboards then become formulaic reflections of these preformed notions: performance is defined by nines rather than by user experience, latency in parts of the application hides behind unintuitive metrics like p90, and error rates become noise.
Worse still, these preformed notions are tied to contextual biases and construed vastly differently by different users of the dashboards. And, as systems change over time, signals tracked in a dashboard proliferate to diminishing returns, or they fall by the wayside but persist in old dashboards taking up cognitive cycles during incidents and RCAs.
Dashboards as vital signs
It doesn’t have to be this way. Combining Honeycomb’s powerful query engine with the Honeycomb Terraform provider is a great way to create dashboards that matter: things like overall service health, release performance, infrastructure metrics, and application-level metrics are all vital signals for the various parts of your systems.
This post will show you how you can:
- Use the Honeycomb Terraform provider to create dashboards that serve as pulse checks for your services
- Use metrics dashboards in Honeycomb to contextualize your tracing data
Creating dashboards that matter
The Honeycomb Terraform provider includes support for managing your queries, query annotations, and boards. This means that with just a few lines of code, you can spin up new dashboards as you onboard new services, infrastructure, or teams onto Honeycomb!
What exactly should we add to these high-level overview dashboards, and how do we do it with Terraform?
With modules in Terraform, you can create Honeycomb queries and query annotations once and simply reuse them when spinning up new services, teams, or infrastructure.
Any web or mobile application may have several services, each with their own unique underlying database, release cadence, request volume, etc. A services overview dashboard that tracks query performance, request count and duration, and latency broken down by release version can be useful for any such application. Below is an example of a query specification to track request count and duration for all the services in your dataset in a Terraform module:
data "honeycombio_query_specification" "service-latency" {
  calculation {
    op     = "P95"
    column = "duration_ms"
  }

  calculation {
    op     = "P90"
    column = "duration_ms"
  }

  calculation {
    op     = "P75"
    column = "duration_ms"
  }

  calculation {
    op     = "P50"
    column = "duration_ms"
  }

  calculation {
    op     = "HEATMAP"
    column = "duration_ms"
  }

  filter {
    column = "meta.annotation_type"
    op     = "!="
    value  = "link"
  }

  filter {
    column = "meta.annotation_type"
    op     = "!="
    value  = "span_event"
  }

  breakdowns = ["service.name"]
}

output "service-latency-query-json" {
  value = data.honeycombio_query_specification.service-latency.json
}
Within a `hny_service_overview` module, you can then add this query and an annotation describing the query to your overview board, like so:
# Query specification outputs
resource "honeycombio_query" "service-latency-query" {
  dataset    = var.traces_dataset
  query_json = module.query.service-latency-query-json
}

resource "honeycombio_query_annotation" "service-latency-query" {
  dataset  = var.traces_dataset
  query_id = honeycombio_query.service-latency-query.id
  name     = "Latency by service"
}

# Board definition
resource "honeycombio_board" "services" {
  name  = "Services Overview"
  style = "visual"
  query {
    dataset             = var.traces_dataset
    query_id            = honeycombio_query.service-latency-query.id
    query_annotation_id = honeycombio_query_annotation.service-latency-query.id
  }
}
Et voilà! Simply swap out the dataset variable value and developers now have a go-to place to check the overall status of the service(s) their teams are working on, and cross-functioning teams have a better understanding of how services that impact their work are performing!
If you’re sending infrastructure metrics to Honeycomb, you can also use the provider to build metrics dashboards. For example, you might want to monitor your Kubernetes cluster hosting your online boutique. A simple query specification to track memory utilization for your pods might look like this in a Terraform module:
data "honeycombio_query_specification" "k8s-node-cpu-and-memory" {
  calculation {
    op     = "AVG"
    column = "metrics.cpu.usage"
  }

  calculation {
    op     = "AVG"
    column = "metrics.memory.usage"
  }

  filter {
    column = "k8s.resource.type"
    op     = "="
    value  = "pod"
  }

  breakdowns = ["k8s.pod.name"]

  order {
    column = "metrics.cpu.usage"
    op     = "AVG"
    order  = "descending"
  }
}

output "k8s-node-cpu-and-memory-query-json" {
  value = data.honeycombio_query_specification.k8s-pod-cpu-and-memory.json
}
Then, you can define the `k8s_metrics` board:
# Query specification outputs
resource "honeycombio_query" "k8s-pod-cpu-and-memory-query" {
  dataset    = var.metrics_dataset
  query_json = module.query.k8s-pod-cpu-and-memory-query-json
}

resource "honeycombio_query_annotation" "k8s-pod-cpu-and-memory-query" {
  dataset  = var.metrics_dataset
  query_id = honeycombio_query.k8s-pod-cpu-and-memory-query.id
  name     = "k8s pod cpu and memory usage"
}

# Board definition
resource "honeycombio_board" "k8s-metrics" {
  name  = "K8s metrics"
  style = "visual"

  query {
    dataset             = var.metrics_dataset
    query_id            = honeycombio_query.k8s-pod-cpu-and-memory-query.id
    query_annotation_id = honeycombio_query_annotation.k8s-pod-cpu-and-memory-query.id
  }
}
When looking at your trace data in Honeycomb, you can then click on the Metrics tab and see how your trace data correlates with the underlying infrastructure metrics in the same view, giving you the context you need to understand how one impacts the other.
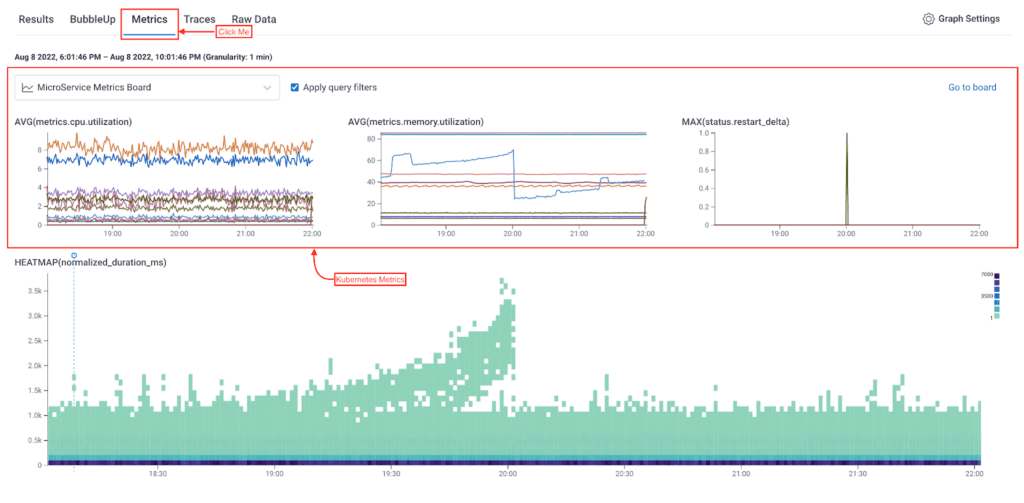
Looking at our metrics dashboard, we can see the latency spike in our application coincides with a spike in memory utilization.
The Terraform provider makes it easy to spin up new dashboards that serve as pulse checks for new services you might onboard, new infrastructure you’re bringing online, etc. For example, we can oversee the health of this online boutique that comprises 10 different microservices at the service level with the services overview dashboard, see any error spikes in an errors dashboard. We can even look at the infrastructure metrics flowing in from the Kubernetes cluster where the application is running, and view the metrics in the context of our tracing data when running an RCA.
Try it yourself
The Honeycomb Terraform provider is now available in the Terraform Registry. You can read more about the Honeycomb Terraform provider in the provider’s documentation. If you don’t have a Honeycomb account, check out our free tier to get started.
You can find all the code used in this post and more interesting Honeycomb dashboards here! To set up the boards defined in this post, you must have Terraform installed (follow these directions to install for your platform).
You will also need a Honeycomb API key with the adequate permissions to create boards, queries, and more. Once you have the API key, you can export it like so:
export HONEYCOMBIO_APIKEY=<YOUR_API_KEY>Alternatively, you can define it via the api_key variable.
Next, create a <your-filename>.tfvars file with the following variables:
metrics_dataset = "<YOUR-METRICS-DATASET>"
traces_dataset = "<YOUR-TRACES-DATASET>"
Then, to run terraform plan or apply for all modules in this directory (terraform), run:
terraform init
terraform plan --var-file="<your-filename>.tfvars" -out tfplan.out
terraform apply --var-file="<your-filename>.tfvars"
If you try this new feature, be sure to share feedback in our Pollinators Slack Community to let us know what you think. You can find us in the #discuss-terraform-provider channel.
Related Posts
Real User Monitoring With a Splash of OpenTelemetry
You're probably familiar with the concept of real user monitoring (RUM) and how it's used to monitor websites or mobile applications. If not, here's the...
Transforming to an Engineering Culture of Curiosity With a Modern Observability 2.0 Solution
Relying on their traditional observability 1.0 tool, Pax8 faced hurdles in fostering a culture of ownership and curiosity due to user-based pricing limitations and an...
Honeycomb + Google Gemini
Today at Google Next, Charity Majors demonstrated how to use Honeycomb to find unexpected problems in our generative AI integration. Software components that integrate with...