Event Latency: What It Is and Why You Should Care
By Ian Wilkes | Last modified on May 13, 2021Recently, we added a new derived column function to Honeycomb, INGEST_TIMESTAMP(), which can help customers debug event latency and/or inaccurate timestamps. A meaningful minority of the events sent to Honeycomb are already old when they arrive, and a very special few claim to have been sent from the future. Has this happened to you?
Let's do an experiment. Go run a simple COUNT query i link n absolute time mode, which pins the query time to a specific, repeatable range (available in the time drop-down menu in the query builder). Then wait a couple of minutes and run that same query again. Same query, same time range, so the results should be identical, right?
Chances are, they aren't. If they are, good for you! You can stop reading. If they aren't, read on.
Here's an example from one of Honeycomb's internal datasets:
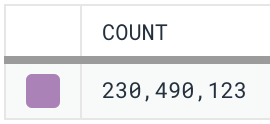
The first query result.
One minute later.
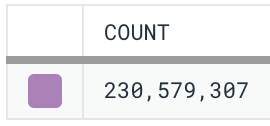
So what's going on here? Simply put, when we ran the first query, which had an end time very close to "now," there were still events in flight. They had been generated, but hadn't arrived at Honeycomb in time to show up in the query result. Once it does arrive, an event typically takes about 300ms to become available in queries, so the impact of internal delay is extremely small. There are a few ways the more significant, external latency can happen:
- Trace spans are timestamped when they start, but aren't sent until they end. This can appear as latency unless you correct for the span's duration.
- Almost all event pipelines do some amount of buffering, delaying event transmission to accumulate batches. Proxies such as Refinery can add additional latency.
- Event pipelines also sometimes stall or become bottlenecked.
- Sometimes, timestamps can be incorrect to begin with, due to an incorrect system clock on the host which generated them.
If you have events that seem to take more than a few seconds to arrive, it's likely there's some sort of stall in your pipeline. Does that matter? It depends. During an incident, we're often looking for up-to-the minute information. Ideally, it's actually true and not full of gaps due to late-arriving events. Likewise, triggers can run as often as every minute, always on the most current data. Events that arrive two minutes late won't ever be noticed—even if they've got something very important to say about your system. (In contrast, SLOs rebuild their data over time and so they will notice eventually.)
Just about every observability system has this problem to some degree—a ragged edge of incomplete data just shy of "now" that is still being filled in. Usually, this latency is entirely opaque, but with Honeycomb, you have the ability to debug it using the INGEST_TIMESTAMP() derived column function. This tells you exactly when any given event was accepted by our API, and by comparing it with the event timestamp, you can find out how long it took to get to us. This can reveal some surprising patterns and glitches in your data pipeline.
Digging into the dataset from the example above reveals some stunning numbers: a maximum latency of almost 15 minutes! Nothing in our pipeline should take this long. This is a tracing dataset, so breaking down by service and name reveals a surprising pattern. The worst-case latency is highest for a particular span in our code that runs on AWS Lambda. Everything else is consistent with a small Refinery-induced delay due to our very long-running traces.
Finding this span in the code quickly uncovers the problem. It's run by a background thread, which can be problematic on Lambda. The event is generated, but the process is frozen before it can be dispatched, causing it to show up very late when the process is eventually thawed (or never, if the process never re-awakens). So here we've found a potential problem not just with event delivery, but with the code itself.
That’s one internal example, but the sources of event latency range from the extremely mundane and easy to fix (e.g., a bad ntpd configuration or a log processor which only runs every five minutes) to the genuinely unexpected and confounding (a client with a clock set two weeks into the future in order to cheat at a video game).
I encourage readers to take a look at their event latency using the example derived column code. You might find some surprises. If you do, let us know in Pollinators. Also, remember that Honeycomb support is here to help and, if need be, can configure your datasets to override any dubious timestamps when they arrive. If you’re not a Honeycomb user, consider what you might be missing—and remember it’s easy to sign up for a free Honeycomb account!
Related Posts
Safer Client-Side Instrumentation with Honeycomb's Ingest-Only API Keys
We're delighted to introduce our new Ingest API Keys, a significant step toward enabling all Honeycomb customers to manage their observability complexity simply, efficiently, and...
Now Available: Honeycomb Launches Data Residency in Europe
At Honeycomb, we are very concerned about privacy and data sovereignty—it’s something we take very seriously, and in an effort to serve our customers better,...
Introducing Honeycomb’s Microsoft Teams Integration for Enhanced Alert Management
Today marks an exciting milestone at Honeycomb, and we're thrilled to share it with you. We officially launched our integration with Microsoft Teams, a step...