Metrics now generally available in Honeycomb
By Yeesheen Yang | Last modified on September 8, 2021Join us for a live tour & Q&A session on Honeycomb Metrics. Ready to get hands-on? Honeycomb Metrics is already included in Enterprise subscriptions. Existing Free or Pro customers can request an Enterprise trial to try Honeycomb Metrics.
Starting today, Honeycomb Metrics is now generally available to all Enterprise customers.
You’ve adopted our event-based observability practices, in part to overcome the debugging roadblocks you hit when using custom metrics to identify application issues. But metrics do still provide value at the systems level. Now, you can easily see and use your metrics data alongside your event data in Honeycomb—all in one interface.
A modern approach to metrics
When we announced the Honeycomb Metrics beta at o11ycon+hnycon, we called it a new approach to metrics. Before we go any further, it’s worth unpacking that stance a bit.
In 1988, by way of SNMPv1 (Simple Network Management Protocol), the foundation of traditional monitoring practices was born: the metric. A metric is a single number, with tags optionally appended for grouping and searching those numbers. It’s a simple and incredibly effective measure, originally used to periodically report different aspects of hardware performance.
The metric is so simple and effective that our industry built many sophisticated apparatuses atop that one concept, including time series databases, statistical analyses, graphing libraries, fancy dashboards, on-call rotations, ops teams, and escalation policies—as well as a remarkably complex series of small robots periodically checking various aspects of applications and infrastructure and diligently reporting their single numbers and tags.
What makes the metric so effective is that its simple operational scope remains unchanged. It measures one particular aspect of whatever it is monitoring over a set period of time and reports that measurement as an aggregate number: over [period of time] (the last minute, 5 minutes, 10 seconds, or some regular interval of time), this [aspect of system performance] was [number]. That scope works very well for things like reporting the utilization of a network switch. It works less well (read: not at all) for reporting things like the performance of an individual user request along a microservice architecture execution path.
In an era where we have distributed tracing, columnar datastores, and querying capabilities that let you slice and compare billions of rows of data about your systems across thousands of high-cardinality dimensions to find tiny deviations in a handful of requests in just a few seconds, does it really make sense to keep trying to make the metric do things it was never intended to do?
At Honeycomb, we (and you, our customers) know it’s time to reevaluate how, when, and where we use metrics. A modern approach to understanding every aspect of your application services means using the right tool for the right job—and for today’s complex environments, metrics work best for measuring your systems, events work best for understanding your applications.
Honeycomb Metrics gives you the ability to use the best debugging tools available today in ways that make sense for a modern world where compute and storage are both unfathomably more powerful and unreasonably more affordable than they were 30+ years ago.
How Honeycomb Metrics works
It’s fairly simple: You send your native-format time series metrics data to Honeycomb, and we convert that data into events before putting it into our columnar data store. Then, you query and visualize your metrics data just like you do with everything else in Honeycomb.
It’s an integrated experience. No bespoke tooling, no bolt-on products, no separate data store, no afterthought process. It’s everything you need, all in one place, using a workflow you already know. Honeycomb Metrics also provides a customizable set of visualizations that help you correlate system issues when you’re investigating app performance issues.
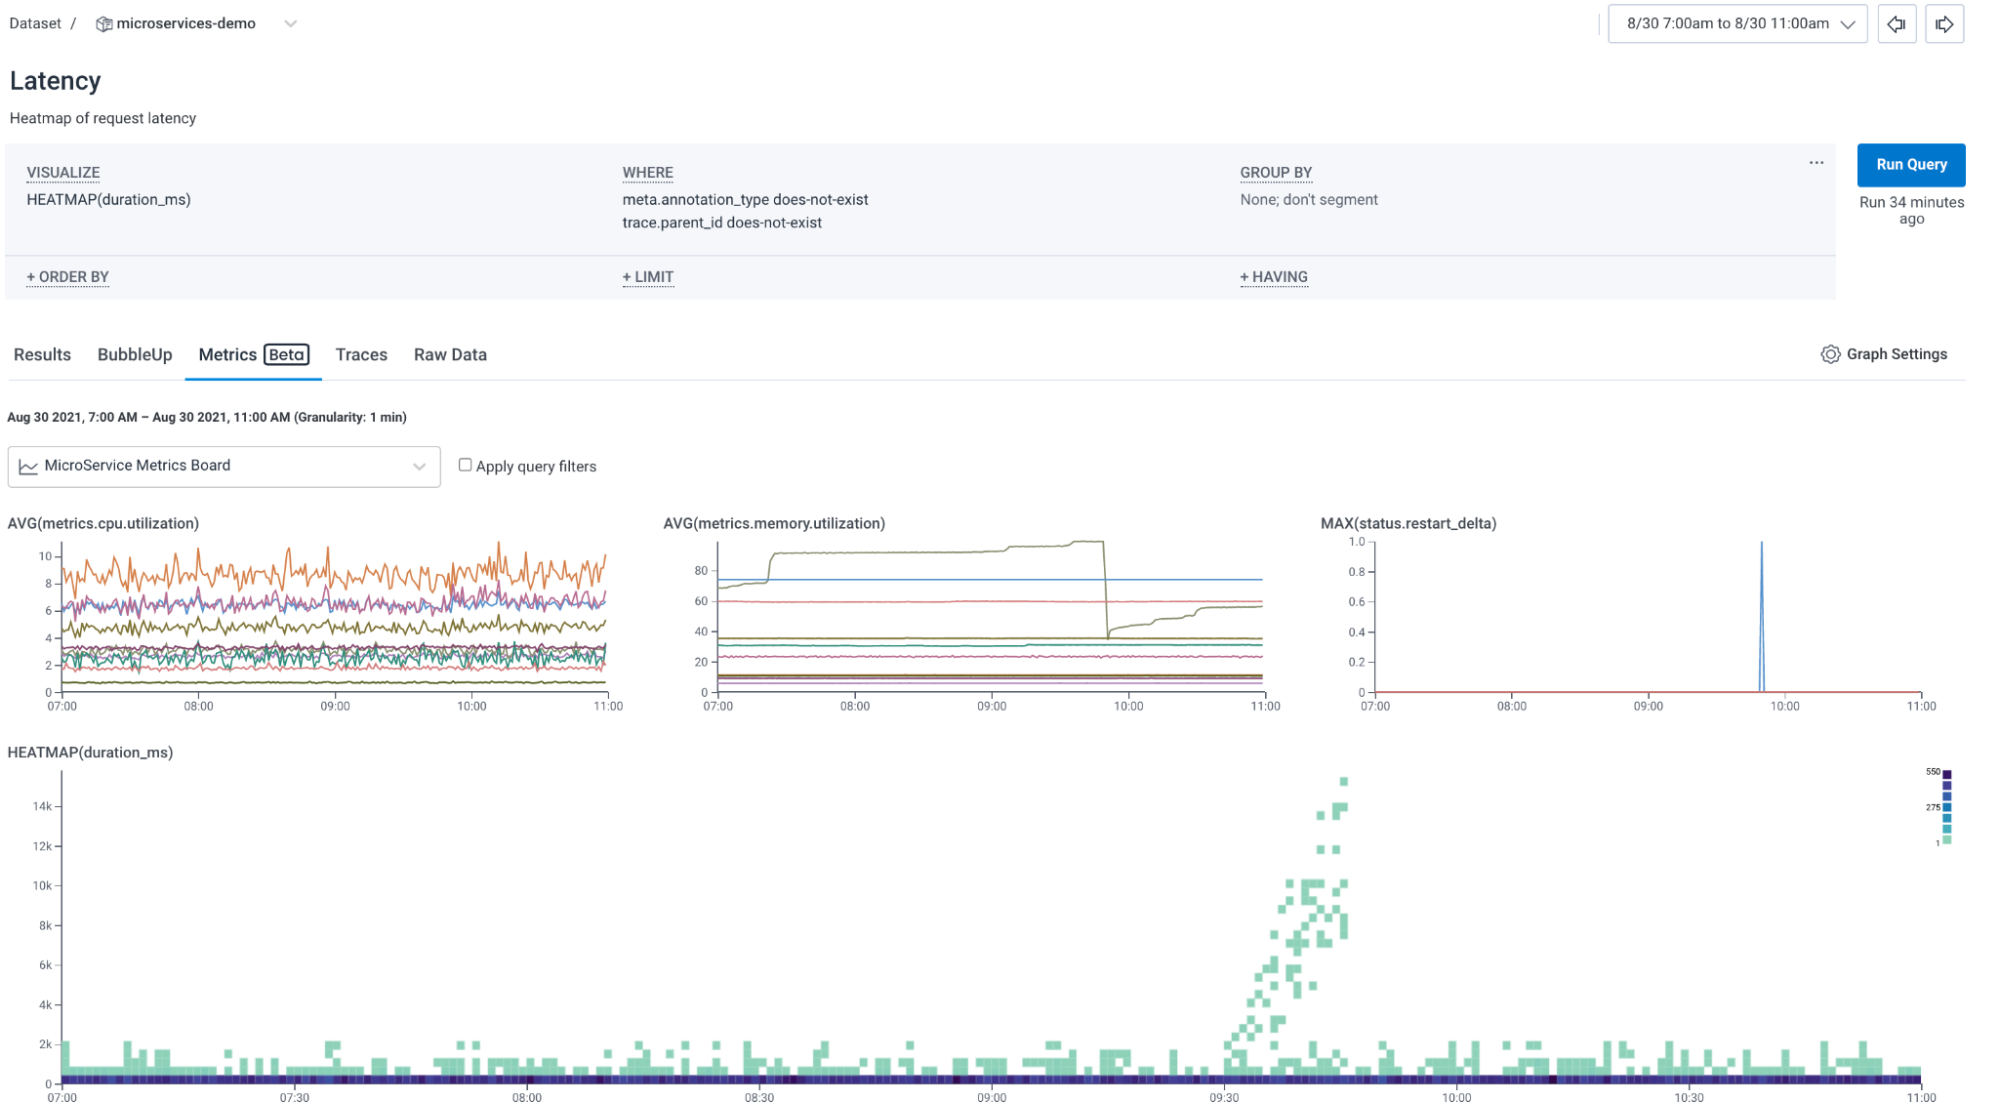
In the example screenshot, a standard Honeycomb query (built with the Query builder at the top of the screen) creates a heatmap visualization (shown at the bottom of the screen). The heatmap shows a spike in application performance latency. By clicking on the Metrics tab (middle), three metrics visualizations are revealed. These visualizations are either pre-built or generated from automatic suggestions. When opened via the correlations tab, Honeycomb automatically runs those metrics queries using the same timeframe applied to your main query. In our example, we’re able to quickly confirm that the latency spike is correlated with a drop in underlying system memory and a runtime restart counter—the latency was due to underlying system components restarting, not an issue in our application code.
An integrated experience means there’s no need for you to carry context between tools, manually finding and mentally stitching necessary puzzle pieces together. You can get the right level of understanding you need to quickly find issues wherever they’re occurring. Fast. In one place. With cohesive context.
That’s observability.
Simplified metrics pricing
While metrics (as a construct) might be simple, what you pay to use them with other solutions is anything but simple. One of the core values you get with Honeycomb’s pricing model is simple, predictable, and transparent pricing with no hidden fees. The same is true when using Honeycomb Metrics.
Your metrics get converted to events when getting stored in Honeycomb. With Honeycomb Metrics, you have a new ability to send us metrics from many providers and formats, including AWS CloudWatch, Prometheus, and OpenTelemetry metrics. By routing metrics data through the OpenTelemetry collector, we’re able to flatten and transform your data into wide events that map a metrics collection to a predictable number of events.
As a conversion example, 1 monitored resource in CloudWatch generating metrics every 1 minute translates to creating 1 Honeycomb event every 1 minute. Like traces, what you decide to do with the fidelity of those metrics may increase the number of generated events. But unlike traces, the predictable interval-based nature of metrics collection also means you can offset increased volume by sending metrics less frequently.
There’s no additional charge for using Honeycomb Metrics, other than the same standard event-based volume pricing you’ve come to expect from Honeycomb. In practice, when you use metrics for your systems and events for your applications, metrics volume tends to be a small (i.e., single digit) percentage of overall event volume. You don’t just get a modern take on how you use metrics, you also get a modern take on how you pay for them.
Try Honeycomb Metrics now
There’s more to know about the intricacies of Honeycomb Metrics. But the best way to understand everything it has to offer is to try it for yourself. If you’re an existing Honeycomb Enterprise customer, you already have access and can get started right away.
If you’re an existing Free or Pro customer, you can request an Enterprise trial and take Honeycomb Metrics for a test drive.
As always, let us know what you think or if you have any questions by joining us in the Pollinators Slack group. You can also join us for a live tour and Q&A session.
Related Posts
How Metrics Behave in Honeycomb
Honeycomb has the ability to receive events from application. These events can take the shape of Honeycomb wide events, OpenTelemetry trace spans, and OpenTelemetry metrics....
Three Ways to Make the Most out of Honeycomb Metrics
A while ago, we added Metrics to our observability platform so teams could easily see system information right next to their application observability data—no tool...
Ask Miss O11y: To Metric or to Trace?
Dear Miss O11y, I remember reading quite interesting opinions from you about usage of metrics and traces in an application. Did you elaborate on those...