OpenTelemetry Logs, OpenTelemetry Go, and the Road Ahead
By Phillip Carter | Last modified on August 31, 2022We’ve got a lot of OpenTelemetry-flavored honey to send your way, ranging from OpenTelemetry SDK distribution updates to protocol support. We now support OpenTelemetry logs, released a new SDK distribution for OpenTelemetry Go, and have some updates around OpenTelemetry + Honeycomb to share. Let’s see what all the buzz is about this time! 🐝🐝
Support for OpenTelemetry logs (beta)
The vision of OpenTelemetry is that it supports all major telemetry signal types, including logs! The OpenTelemetry logs data model specification is now stable, which means the many logging libraries can now become compliant. Although it’s still early days, we’ve already seen high demand from our customers to support ingesting OpenTelemetry logs.
OpenTelemetry logs are structured logs. This makes them a great fit for how we think logs should be created in the first place, except they also come with an amazing addition: automatic correlation with traces. If you configure both tracing and logging in your OpenTelemetry SDK, you can connect all of your existing structured logs with traces—with only a few lines of code. This is already supported in the .NET SDK, with other language support coming soon.
Here’s how you can set up automatic traces and logs with .NET.
First, add some packages. You’ll need to use prerelease packages for now because logs exporters in SDKs are still in prerelease:
dotnet add package OpenTelemetry --prerelease
dotnet add package OpenTelemetry.Extensions.Hosting --prerelease
dotnet add package OpenTelemetry.Exporter.OpenTelemetryProtocol --prerelease
dotnet add package OpenTelemetry.Exporter.OpenTelemetryProtocol.Logs --prerelease
dotnet add package OpenTelemetry.Instrumentation.AspNetCore --prerelease
Then, set up your tracing and logging exporters, like so:
using OpenTelemetry;
using OpenTelemetry.Resources;
using OpenTelemetry.Trace;
using OpenTelemetry.Logs;

var builder = WebApplication.CreateBuilder(args);
var app = builder.Build();
var honeycombApiKey = Environment.GetEnvironmentVariable("HONEYCOMB_API_KEY");
var honeycombEndpoint = new Uri("https://api.honeycomb.io");
var serviceName = "phillips-happy-fun-time";
var serviceVersion = "1.0.0";

var appResourceBuilder = ResourceBuilder.CreateDefault()
    .AddService(serviceName, serviceVersion);

using var tracerProvider = Sdk.CreateTracerProviderBuilder()
    .AddSource(serviceName)
    .SetResourceBuilder(appResourceBuilder)
    .AddAspNetCoreInstrumentation()
    .AddOtlpExporter(option =>
    {
        option.Endpoint = honeycombEndpoint;
        option.Headers = $"x-honeycomb-team={honeycombApiKey}";
    })
    .Build();

using var loggerFactory = LoggerFactory.Create(builder =>
{
    builder.AddOpenTelemetry(options =>
    {
        options.SetResourceBuilder(appResourceBuilder);
        options.AddOtlpExporter(option =>
        {
            option.Endpoint = honeycombEndpoint;
            option.Headers = $"x-honeycomb-team={honeycombApiKey}";
        });
    });
});
var logger = loggerFactory.CreateLogger<Program>();

using var MyActivitySource = new ActivitySource(serviceName);

app.MapGet("/", () =>
{
    using var activity = MyActivitySource.StartActivity("app.manual-span");
    activity?.AddTag("app.manual-span.message", "Hello from a span!");

    logger.LogInformation("Hello from {person}.", new Person("Phillip", 31));
});

app.Run();

record Person(string Name, int Age);
When you run your app, you’ll get a trace with logs attached!
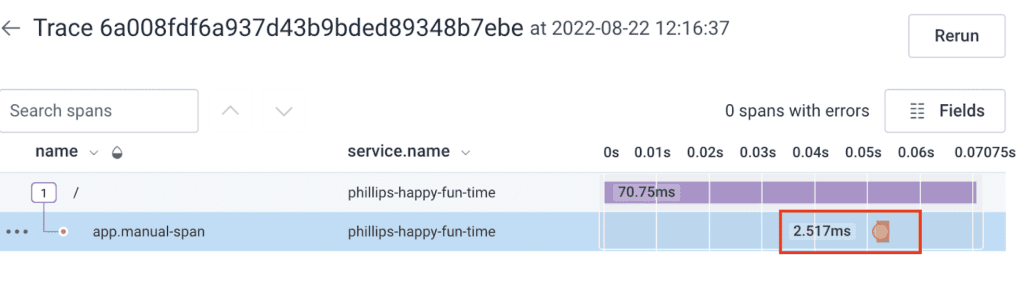
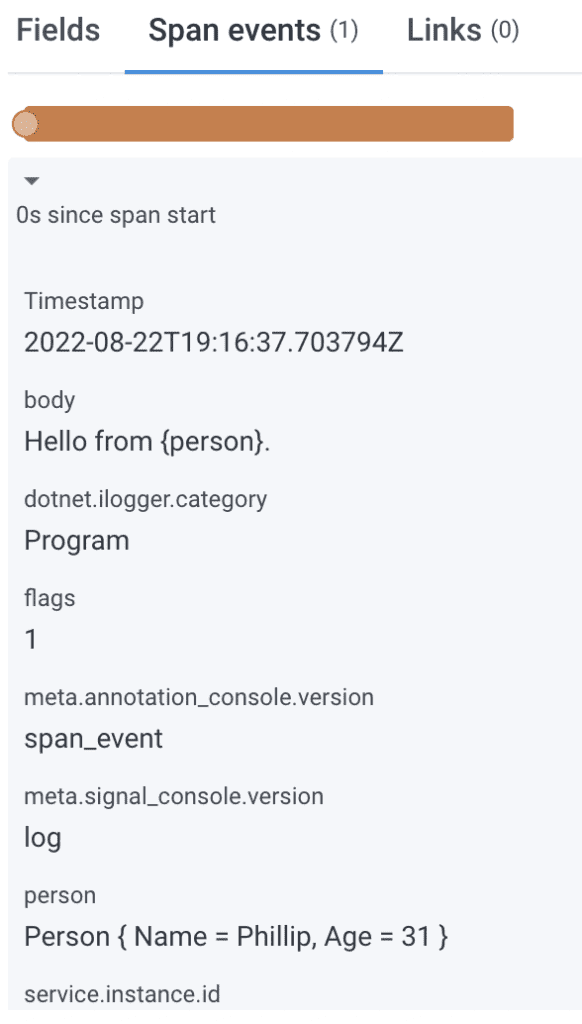
The log data, shown as a span event:
Additionally, you can use an appropriate OpenTelemetry Collector Receiver (such as the Kubernetes Events Receiver) to accept logs from another source, such as Kubernetes, Fluentbit, Splunk, and more, forward those logs into an OpenTelemetry Collector, and send to Honeycomb.
Here's an example of how you can send Kubernetes Events to Honeycomb as OpenTelemetry Logs:
receivers:
  k8s_events:
    auth_type: serviceAccount

processors:
  batch:

exporters:
  otlp/k8sevents:
    endpoint: api.honeycomb.io:443
    headers:
      "x-honeycomb-team": YOUR_API_KEY
      "x-honeycomb-dataset": kubernetes-logs # your dataset name here

service:
  pipelines:
    logs:
      receivers: [k8s_events]
      processors: [batch]
      exporters: [otlp/k8sevents]
When installed as a ConfigMap into your Kubernetes cluster, this will scrape Kubernetes Events and send them to Honeycomb as OpenTelemetry logs.
Our support for OpenTelemetry logs is in beta. Here’s a little clarification on what should work “as expected” with little to no change in behavior:
- Ingesting logs is expected to work for any OpenTelemetry log
- Querying in the Query Builder UI should work as expected. For example, you can query for the presence of a column that is defined in a log as a part of your service dataset
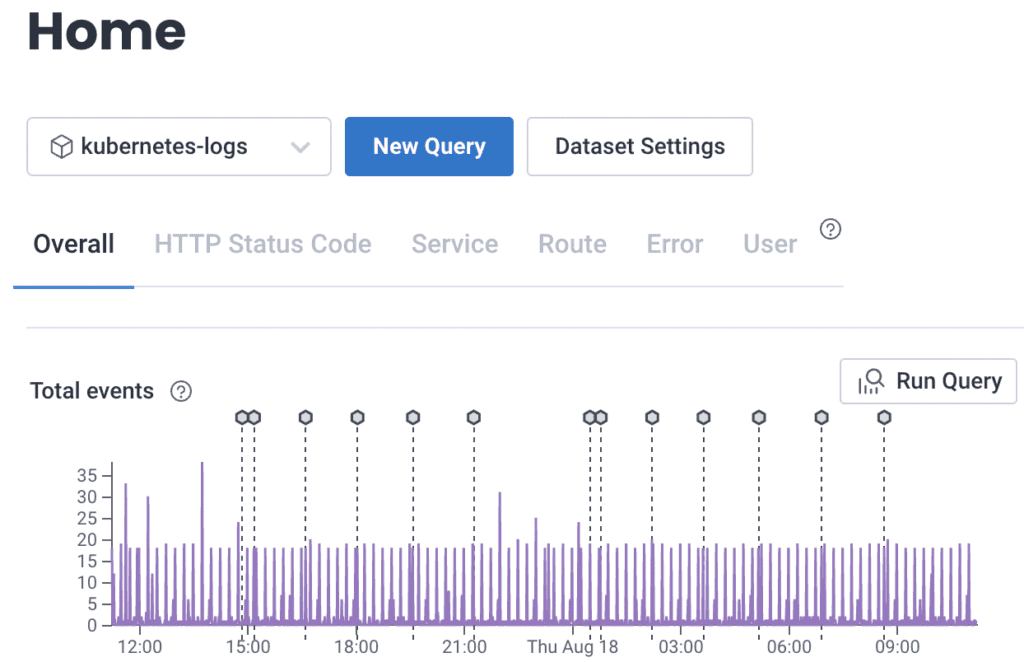
- Logs will be counted on the Home page when looking at Total Events
However, the way we display log data on a Trace Waterfall view may change over time. Today, we are treating OpenTelemetry logs as equivalent to Span Events in the UI, with the same annotation on a trace and the log data available on the Span Events tab. Our reason for doing this is that logs and Span Events are conceptually similar, but we also recognize that our work is not done yet.
Here’s an example of how OpenTelemetry logs look on the Home page when not created in the context of a span:
We want your feedback on the best way to display logs data in the Trace Waterfall and elsewhere! Correlated logs and traces are fundamentally new to Honeycomb, and although we have evaluated several ways to display this data already, we can only make the right decisions with your input. You can send us feedback across several channels—and if you’re in our Pollinators slack, the #discuss-opentelemetry channel is the best place to chat with us and other members of the community about OpenTelemetry logs support.
How are logs related to traces?
OpenTelemetry logs are an on-ramp to modern Observability.
We still believe that traces that capture application-specific data on spans is the best way to instrument an app. But the reality is that many systems in the world already make use of structured app logs that contain this kind of information, and it’s a very large lift to rewrite these logs into traces. That kind of activity might make sense for apps that are under heavy development, but not for all apps.
The reason why OpenTelemetry logs are an on-ramp is because, when you do add traces, the logs will be automatically correlated with those traces for you. This means that you can add an OpenTelemetry logs exporter for your existing logs, then set up automatic tracing, and now your structured logs will be correlated with requests! Over time, you can add more spans to your traces, and that correlation will remain intact. This lets you progressively improve your observability over time, but never having to do a big rewrite to get there.
Honeycomb distribution for OpenTelemetry Go
One of the biggest challenges in getting started with OpenTelemetry and Go is the amount of code you need to write to properly initialize tracing and metrics. For advanced users, the amount of configurability at every step of initialization is a blessing. But for most users we talk to, it’s simply too hard. That’s why we released the first version of our SDK distribution for OpenTelemetry Go!
Here’s how you can get started with a simple HTTP Server.
First, install the distribution and OpenTelemetry HTTP instrumentation packages:
go get github.com/honeycombio/honeycomb-opentelemetry-go \
  go.opentelemetry.io/contrib/instrumentation/net/http/otelhttp
Then, initialize OpenTelemetry in your app:
package main

import (
    "fmt"
    "log"
    "net/http"

    // NOTE: this pulls the honeycomb configuration into scope
    _ "github.com/honeycombio/honeycomb-opentelemetry-go"
    "github.com/honeycombio/opentelemetry-go-contrib/launcher"

    "go.opentelemetry.io/otel"
    "go.opentelemetry.io/contrib/instrumentation/net/http/otelhttp"
)

func httpHandler(w http.ResponseWriter, r *http.Request) {
    fmt.Fprintf(w, "Hello, World")
}

func wrapHandler() {
    handler := http.HandlerFunc(httpHandler)
    wrappedHandler := otelhttp.NewHandler(handler, "hello")
    http.Handle("/hello", wrappedHandler)
}

func main() {
    otelShutdown, err := launcher.ConfigureOpenTelemetry()
    if err != nil {
        log.Fatalf("error setting up OTel SDK - %e", err)
    }
    defer otelShutdown()

    wrapHandler()
    log.Fatal(http.ListenAndServe(":3030", nil))
}
Run the app by setting environment variables:
export OTEL_SERVICE_NAME="your-service-name"
export HONEYCOMB_API_KEY="your-api-key"
go run main.go
See our documentation that covers the full set of configuration options beyond what’s shown here.
Prior to our distribution, this app would have been over 100 lines of code. However, our distribution does more than just reduce the amount of code you have to write. It also comes with these features:
- A baggage span processor so you can propagate metadata across a trace
- A dynamic attributes span processor that lets you assign metadata at initialization time that will be attached to every span
- A deterministic sampler based on a Honeycomb sample rate
- Several other configuration options, like setting alternative endpoints and respecting OpenTelemetry environment variables
The distribution is in beta today. Most changes we make between beta and GA will be additional features, but we may also change some names based on user feedback and work done in the upstream OpenTelemetry Go repositories. That’s because this distribution isn’t just for Honeycomb—we’re collaborating with the OpenTelemetry Go developers to contribute the vendor-neutral core of it!
This SDK distribution can be thought of as two components:
- A Honeycomb-authored library (or layer) with Honeycomb-specific configuration and features
- A vendor-neutral library that makes configuration easy
The second component is the bulk of the distribution. This component is built in collaboration with our friends at Lightstep, who originally built their own “Launcher” SDK for Go, and have graciously offered to collaborate on a fork that makes things vendor-neutral to allow vendors like us to layer our own libraries on top of it. We’re currently working with the OpenTelemetry Go SIG to design this component thoughtfully and ultimately contribute it to the project so that all OpenTelemetry Go users have a better experience when getting started.
Enabling better use of Honeycomb during development
Martin Thwaites, one of our Developer Advocates and our resident .NET fan for life, implemented an amazing feature for our .NET OpenTelementry SDK distribution that makes Honeycomb significantly easier to use at development time! Here’s how it works:
Let’s say you’re adding tracing to your .NET app and want to see if it’s doing what is expected. You could write some unit tests, yes, but you’d need to set up a testing harness and learn a lot more about the OpenTelemetry SDK than you need to. But even then, unit tests aren’t production. How do you know that your trace looks the way you think it should in Honeycomb? Simple: enable local visualizations, with the latest .NET distro version (0.23 or higher).
First, in your appsettings.json file, ensure that EnableLocalVisualizations is set to true:
"Honeycomb": {
  "ApiKey": "my-apikey",
  “ServiceName”: “my-dotnet-app”,
  "EnableLocalVisualizations": true
}
Then, simply run the app:
$ dotnet run
Trace for /my-http-route
Honeycomb link: http://ui.honeycomb.io/my-team/environments/dev/datasets/my-dotnet-app/trace?trace_id=b10d085465bb8e173a86720a818e6a57
Bam! Instead of having to hunt in Honeycomb for the trace I just created in my dev environment, I get a permalink directly to the trace that was just created.
Additionally, we have support for this in the newly-release OpenTelemetry Go distribution. Simply run your app with the HONEYCOMB_ENABLE_LOCAL_VISUALIZATIONS flag:
export OTEL_SERVICE_NAME=your-service-name-goes-here
export HONEYCOMB_API_KEY=your-api-key-goes-here
export HONEYCOMB_ENABLE_LOCAL_VISUALIZATIONS=true
go run app.go
This will produce similar output:
Trace for /my-http-route
Honeycomb link: http://ui.honeycomb.io/my-team/environments/dev/datasets/my-go-app/trace?trace_id=b29917a4219627c130e1c21cf1ef5ea1
This is a part of what we’re calling Observability during development, and it’s a pattern we may enable in all our distributions. We’ll likely explore other ways to enhance development-time use of Honeycomb and OpenTelemetry.
OpenTelemetry grows and grows
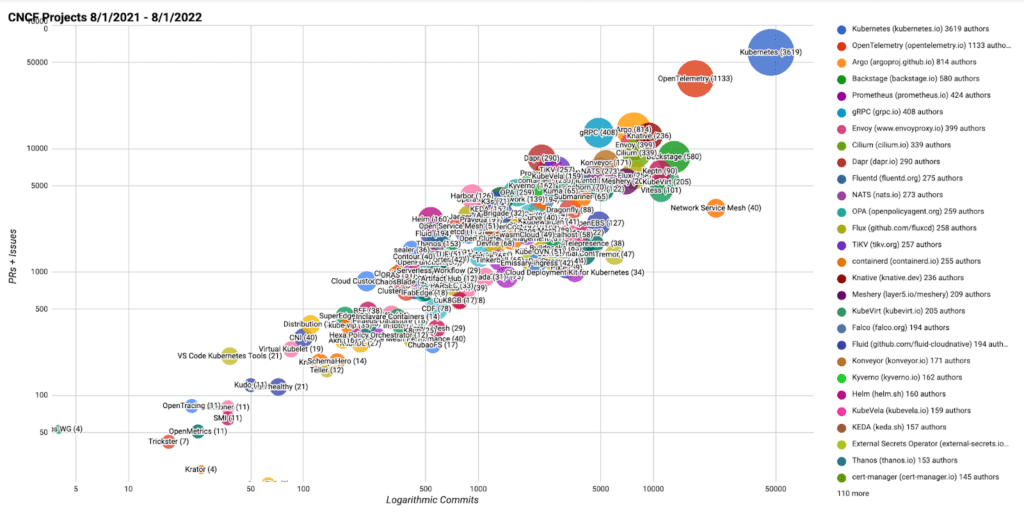
From our vantage point, OpenTelemetry is on a massive growth trajectory. For starters, this can be quantified with the CNCF Velocity project. For the past several iterations, OpenTelemetry has been the #2 most active project in the CNCF landscape, with over 1100 unique authors—second only to Kubernetes.
This has also manifested into broader and deeper support for things across the project:
- 8 of the 11 language SDKs are stable for tracing
- 4 of the 11 language SDKs are stabilizing or stable metrics
- Nearly all observability vendors now support OTLP on ingest
- The OpenTelemetry Operator makes setting up an OpenTelemetry Collector and automatic instrumentation easier than it has ever been
- Kubernetes will soon use OpenTelemetry tracing to instrument API requests in kubelet: https://github.com/kubernetes/kubernetes/pull/105126
- Jaeger now supports OpenTelemetry directly
- Envoy is standardizing on OpenTelemetry for traces it generates
We’ve also seen this manifest here at Honeycomb:
- A year ago, we had a little over 100 teams sending us OpenTelemetry data. Now it’s close to 900 teams, and has far outgrown the number of teams sending us data with Beelines
- Nearly 100% of new teams, week over week, send us data with OTel instead of another means
- Within a month of OTel logs stabilizing in the data model, we had several teams knocking down our door asking to support OTel logs so they could send their structured app and system logs, too
- Excellent support for OpenTelemetry continues to be a big factor for large, enterprise organizations who evaluate Honeycomb for their Observability needs
And finally, anecdotal experiences paint a similar picture. Every single event we attend has a large OTel presence. At Kubecon EU, nearly every person who came to our booth asked if we supported OTel, and had OTel on their immediate roadmap. At Monitorama PDX this year, nearly 90% of the audience raised their hand when asked if they’ve got OTel on their roadmap. We’ve seen high attendance in webinars and virtual events where we give talks on OpenTelemetry, too. And every person we talk to acknowledges its importance today and eventual ubiquity in the long-term.
The road ahead
For the remainder of the year, we’re focusing on completing our planned OpenTelemetry SDK distributions for Node.js and Python. We’re also going to work towards completing our OpenTelemetry logs support in the UI and calling it GA. Lastly, we’re looking to add OTLP+http/json protocol support this year—especially to help front-end developers have a lower barrier to entry with OpenTelemetry + Honeycomb.
Finally, we’re looking forward to seeing people at Kubecon North America and AWS Re:Invent! We’ll be staffing the booth to take your questions, participating in OpenTelemetry events, and more! If you’re going, stop by and chat us up. We’d love to talk about OpenTelemetry.
Related Posts
Real User Monitoring With a Splash of OpenTelemetry
You're probably familiar with the concept of real user monitoring (RUM) and how it's used to monitor websites or mobile applications. If not, here's the...
Transitioning to OpenTelemetry
This article touches on how we at Birdie handled our transition from logs towards using OpenTelemetry as the primary mechanism for achieving world-class observability of...
Instrumenting a Demo App With OpenTelemetry and Honeycomb
A few days ago, I was in a meeting with a prospect who was just starting to try out OpenTelemetry. One of the things that...