Announcing General Availability of the Honeycomb Query Data API
By Phillip Carter | Last modified on October 5, 2021The Query Data API is a Honeycomb Enterprise feature. With a Honeycomb Enterprise account, you can use this API today. Head over to our API docs to learn how to get access to your data.
If you aren’t yet a Honeycomb Enterprise user, try it out by requesting an Enterprise Trial.
Starting today, Honeycomb Enterprise customers can use the Honeycomb Query Data API to programmatically run queries and retrieve their results, and pull query results into any data visualization tool of their choice.
In this post, I’ll walk through a few examples of interesting ways you can use data from query results.
Visualize results anywhere
A primary use case (that we hear from many of you!) is using the Query Data API for data visualization needs that extend beyond the capabilities of Honeycomb. Honeycomb Boards let you pin useful queries and graphs you want to reference in one place. However, some orgs want to use that data in other custom dashboards that may also visualize data from other sources.
Enter the Honeycomb Query Data API.
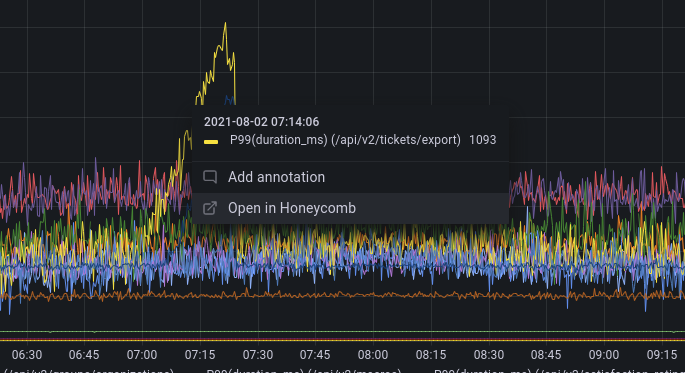
The Query Data API lets you pull query results into any data visualization tool of your choice. A great example of that is showcased in Grafana’s official plugin for Honeycomb. We partnered with Grafana to enable a smooth integration for our mutual customers. This plugin helps teams already using Grafana to also surface data from Honeycomb within their Grafana dashboards. This particular plugin creates a connection from your Grafana dashboards back to Honeycomb by letting you click the graph to open that exact query as a starting place for further investigations, as shown in the screenshot below.
Another Query Data API visualization use case is to customize how you expose data to other parts of your organization that may not have direct access to Honeycomb. This type of information-sharing pattern can be common in larger organizations that need to relay information across a number of teams. This API gives you the flexibility and control you need to deliver insights from your observability data to any developers who will benefit.
For example, one of our enterprise customers has a platform team that supports a number of mobile app and firmware teams within their company. The platform team runs data validation on what the devices are sending to the platform, which in turn gets sent to Honeycomb. Using the Query Data API, the platform team now surfaces data validation errors coming from mobile devices into a bespoke dashboarding tool used by the device teams. The Query Data API allows the platform team to meet their stakeholders where they already operate, saving both teams time by allowing device teams to self-serve information that previously required manual communication via email or Slack.
Additional visualization options for your Honeycomb data is a great starter use case, but the possibilities that open when you’re able to programmatically use query results anywhere else is just the beginning.
Further analyze your observability data in new ways
A use case we hear less commonly is using other analysis tools to work with your Honeycomb data. Honeycomb’s analysis features (like heatmaps and BubbleUp) are powerful debugging features. But there are times when you may want to do things like forecast usage or identify distribution patterns in ways that go beyond typical Honeycomb observability use cases.
Enter the Honeycomb Query Data API.
Now that you can easily extract query data from Honeycomb, that means you can also ship it to any other sort of analysis tool of your choice. With a little effort, you can plumb your data through any data visualization library and produce any number of figures that can help you understand it in different ways.
For example, you could load up a Jupyter Notebook (the de facto tool for data analysis and interactive programming) and surface more patterns within your data beyond what the Honeycomb UI affords you today. To demonstrate, here’s a Jupyter Notebook written in .NET/F# that does the following:
- Uses the Query Data API to retrieve query results showing how Honeycomb customers use OpenTelemetry SDKs (limiting the number of results)
- Massages the data a bit so that it’s easier to plot
- Visualizes that time series information in several ways with Plotly, including bar charts, tables, and a small re-creation of the default Honeycomb visualization for the given query
- Creates a boxplot view into event distribution per minute by teams using those SDKs
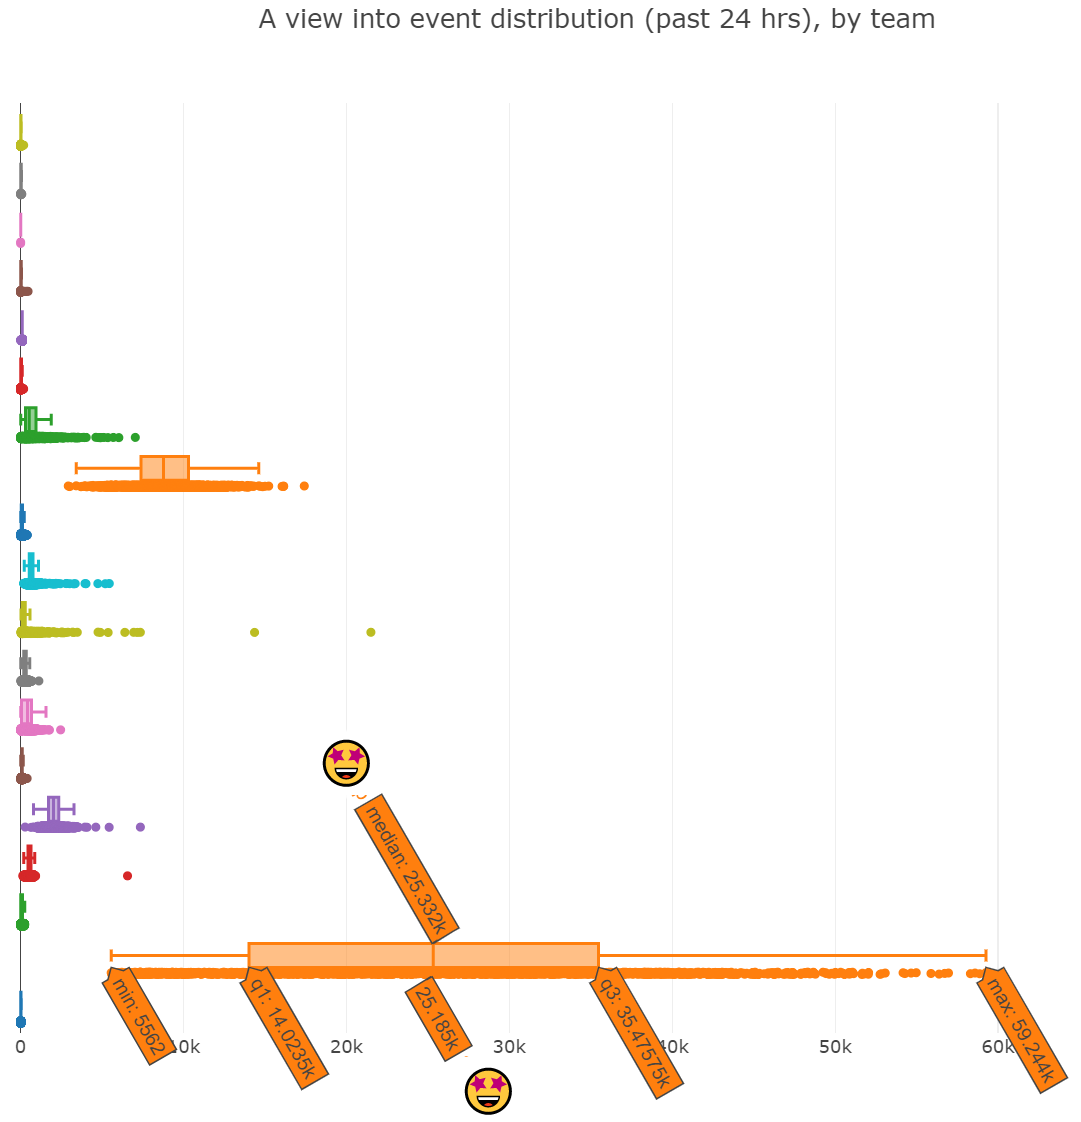
A boxplot of event rate distribution by team lets you answer questions like, “What is the distribution of events generated by different entities?” Exporting your observability data to other visualization and analysis tools opens up a world of data analysis rabbit holes that can go deeper than typical Honeycomb use cases. How does data get distributed by other criteria? Are there correlations to explore? Could you start to predict values and forecast things?
Honeycomb’s Query Data API gives you the actual data returned by any query you can possibly run. That means getting an answer to any question you can ask about that data is constrained only by your own creativity.
Honeycomb’s own visualization and analysis tools are much faster to use and designed for iterative observability-driven analysis. But when you need more flexibility to visualize and analyze your data in various ways, the Query Data API can be used to make that possible (while trading off ergonomics, speed, and prescriptive direction).
Supercharge your continuous deployments
An emerging, but incredibly interesting use case, is using the Honeycomb Query Data API to level up your software delivery lifecycle.
When it comes to CI/CD today, many engineering organizations practice continuous integration (CI): Before you can merge a pull request into the main branch of a repository, all tests should pass. But that latter part—continuous deployment (CD)—is practiced by far fewer organizations. “All our tests pass, so this is probably good to go live, right? … Right?”
The reality is that effective end-to-end testing of an entire system is hard. You can do your best to build complex non-production infrastructure that simulates user behaviors and constantly maintain that complexity as your systems change, but very few developers have the time or resources to do that. However, just because some testing approaches can be difficult, time-consuming, and fragile, it doesn’t mean that continuous deployment is out of reach.
Enter the Honeycomb Query Data API.
Using the Query Data API, you can create and run a suite of queries against canary deployments that can automatically validate whether it is safe for your deployment to proceed. Now, you can set up your pipelines to test the performance of new deployments where it matters most: production.
For example, Blackbaud, which provides cloud computing services to social good organizations, uses the Query Data API to automatically validate deployment performance in various stages of their progressive delivery strategy. Rather than relying on manual performance verification with the Honeycomb UI, releases are cleared for promotion with automated tests that are powered by Honeycomb queries. You can use a similar approach in your own delivery mechanisms. To do that you would:
- Use the Honeycomb UI to develop queries that analyze performance and establish reasonable bounds for behavior in your system—either in parts or as a whole.
- Write tests that execute those same queries programmatically with the Query Data API and use them in your canary deployment pipelines to verify that performance results fall within the behavioral bounds you’ve established.
- When deployment behavior meets established bounds, automatically promote them to the next delivery stage.
- When deployment behavior falls below or beyond established bounds, halt the deployment and manually debug and introspect the deployment using the Honeycomb UI before proceeding.
Organizations with mature observability practices use tools like Honeycomb proactively rather than reactively. Instead of diagnosing problems after they affect user experience, they closely watch deployments as they’re released into production. By validating deployment performance in production in stages, they’re able to detect possible issues earlier and resolve them before they become customer impacting. Now, the Query Data API allows that validation to happen automatically.
The Honeycomb Query Data API unlocks the ability for organizations to adopt mature observability practices as part of progressive release patterns and continuous deployment.
Try out today
The Query Data API is a Honeycomb Enterprise feature. With a Honeycomb Enterprise account, you can use this API today. Head over to our API docs to learn how to get access to your data and get creative with it.
If you aren’t yet a Honeycomb Enterprise user, try it out by requesting an Enterprise Trial.
As always, the best way to let us know what you think is to drop into the Pollinators Slack group to give us your feedback. Happy automating!
Related Posts
Safer Client-Side Instrumentation with Honeycomb's Ingest-Only API Keys
We're delighted to introduce our new Ingest API Keys, a significant step toward enabling all Honeycomb customers to manage their observability complexity simply, efficiently, and...
Now Available: Honeycomb Launches Data Residency in Europe
At Honeycomb, we are very concerned about privacy and data sovereignty—it’s something we take very seriously, and in an effort to serve our customers better,...
Introducing Honeycomb’s Microsoft Teams Integration for Enhanced Alert Management
Today marks an exciting milestone at Honeycomb, and we're thrilled to share it with you. We officially launched our integration with Microsoft Teams, a step...