Honeycomb Differentiators Series: SLOs That Tell the Whole Story
By Jason Harley | Last modified on February 1, 2022In the recent past, most engineering teams had a vague notion of what Service Level Agreements (SLAs) and Service Level Objectives (SLOs) were—mainly things that their more business-focused colleagues talked about at length during contract negotiations. The success or failure of SLAs were tallied via magic calculations (what is “available” anyway?!) at the end of the month or quarter, and adjustments were made in the form of credits or celebrations in the break room.
It’s fair to say that there was a disconnect from these measures and the day-to-day operations of the business. This disconnect is rooted in the lack of a shared language and the inability to measure the actual customer experience against a codified target. This is where SLOs come in—to help tie engineering and product decisions to the business.
In this blog, I’ll share how Honeycomb SLOs can help you reduce the amount of time spent investigating an issue and restoring service.
What’s so special about Honeycomb SLOs?
Lots of vendors have shipped some sort of SLO product, and countless orgs have hacked together some "SLO" numbers of their own. If you dig down to see how the sausage is made, it usually contains some form of aggregated metrics across time series intervals, or Service Level Indicators (SLIs), that are computed at write time and aggregated repeatedly.
These SLO products have a widely varying degree of accuracy, even for different SLOs within the same exact tool. Many involve taking averages of averages, or aggregates of aggregates, checking at defined buckets, or sampling.
Honeycomb SLOs are different because they evaluate your SLI on every event received down to a result of true (goal met), false (goal not met), or null (not applicable). We record and store your raw events long enough that we can calculate the SLIs and SLOs—as defined by you—with perfect accuracy from scratch, anytime you ask to see them.
We consider the canonical text on SLOs to be the Google SRE book and implemented our SLOs to that spec.
Another useful thing to know about Honeycomb SLOs is we compute them from the same events you may use while interacting with your data. So you may start from the very top (e.g., something is impacting our users) and follow the trail of breadcrumbs all the way to the specific answer, like "db query is slow" or "x user is flooding us with traffic," without having to jump from one tool to another to answer increasingly specific questions.
This is a big improvement over the status quo, where users begin by jumping from high-level aggregate graphs, to metrics dashboards, to logs, to traces, and back and forth again, which requires many leaps of fancy.
Driving down the MTTR metric with data-driven exploration
While SLOs are transformative tools, the intention is to operate systems more reliably with reduced mean-time-to-recovery (MTTR) during incidents. MTTR is one of the four DORA Metrics and one of the more crucial metrics that many customers come to Honeycomb looking to improve upon.
Traditionally, debugging techniques are steeped in your organization’s technical history, with leaps of intuition made by individual engineers. This may involve knowing that Sarah’s team likes to use RabbitMQ and emit structured logs while Alex’s team is a big StatsD metrics fan, or that Dimitry has a habit of just swooping in and resolving issues without being great at sharing what led to the resolution. It may also result in you jumping between a half dozen teams, tools, or sources of truth in the middle of trying to orient and find your ultimate cause.
Most teams are left with these hunches and the biases of recent failures as their primary sources of data heading into their discovery processes, even to this day. This worked okay when systems tended to fail repeatedly in similar ways, but falls apart with today’s more complex systems, where you deal with primarily unknown-unknowns—these biases can instead send you down misleading paths while burning precious time during an incident.
Your ability to observe your systems and quickly orient yourself in the current problem space improves dramatically when you embrace observability. You no longer need to know the elaborate social and technical history of a particular piece of software or infrastructure, but instead can begin asking questions about what your customers are actually experiencing and use this data to guide your investigation.
Leveling up your incident response with Honeycomb SLOs, error budgets, and burn alerts
To illustrate how Honeycomb SLOs can help quickly lead you through an investigation, let’s take a look at a sample incident and use a Honeycomb SLO to guide us through the investigation, from start to finish. In this scenario, you are an engineer who has just been alerted that your error budget is being burned down too quickly—and if you don’t investigate and intervene you will prematurely exhaust your error budget.
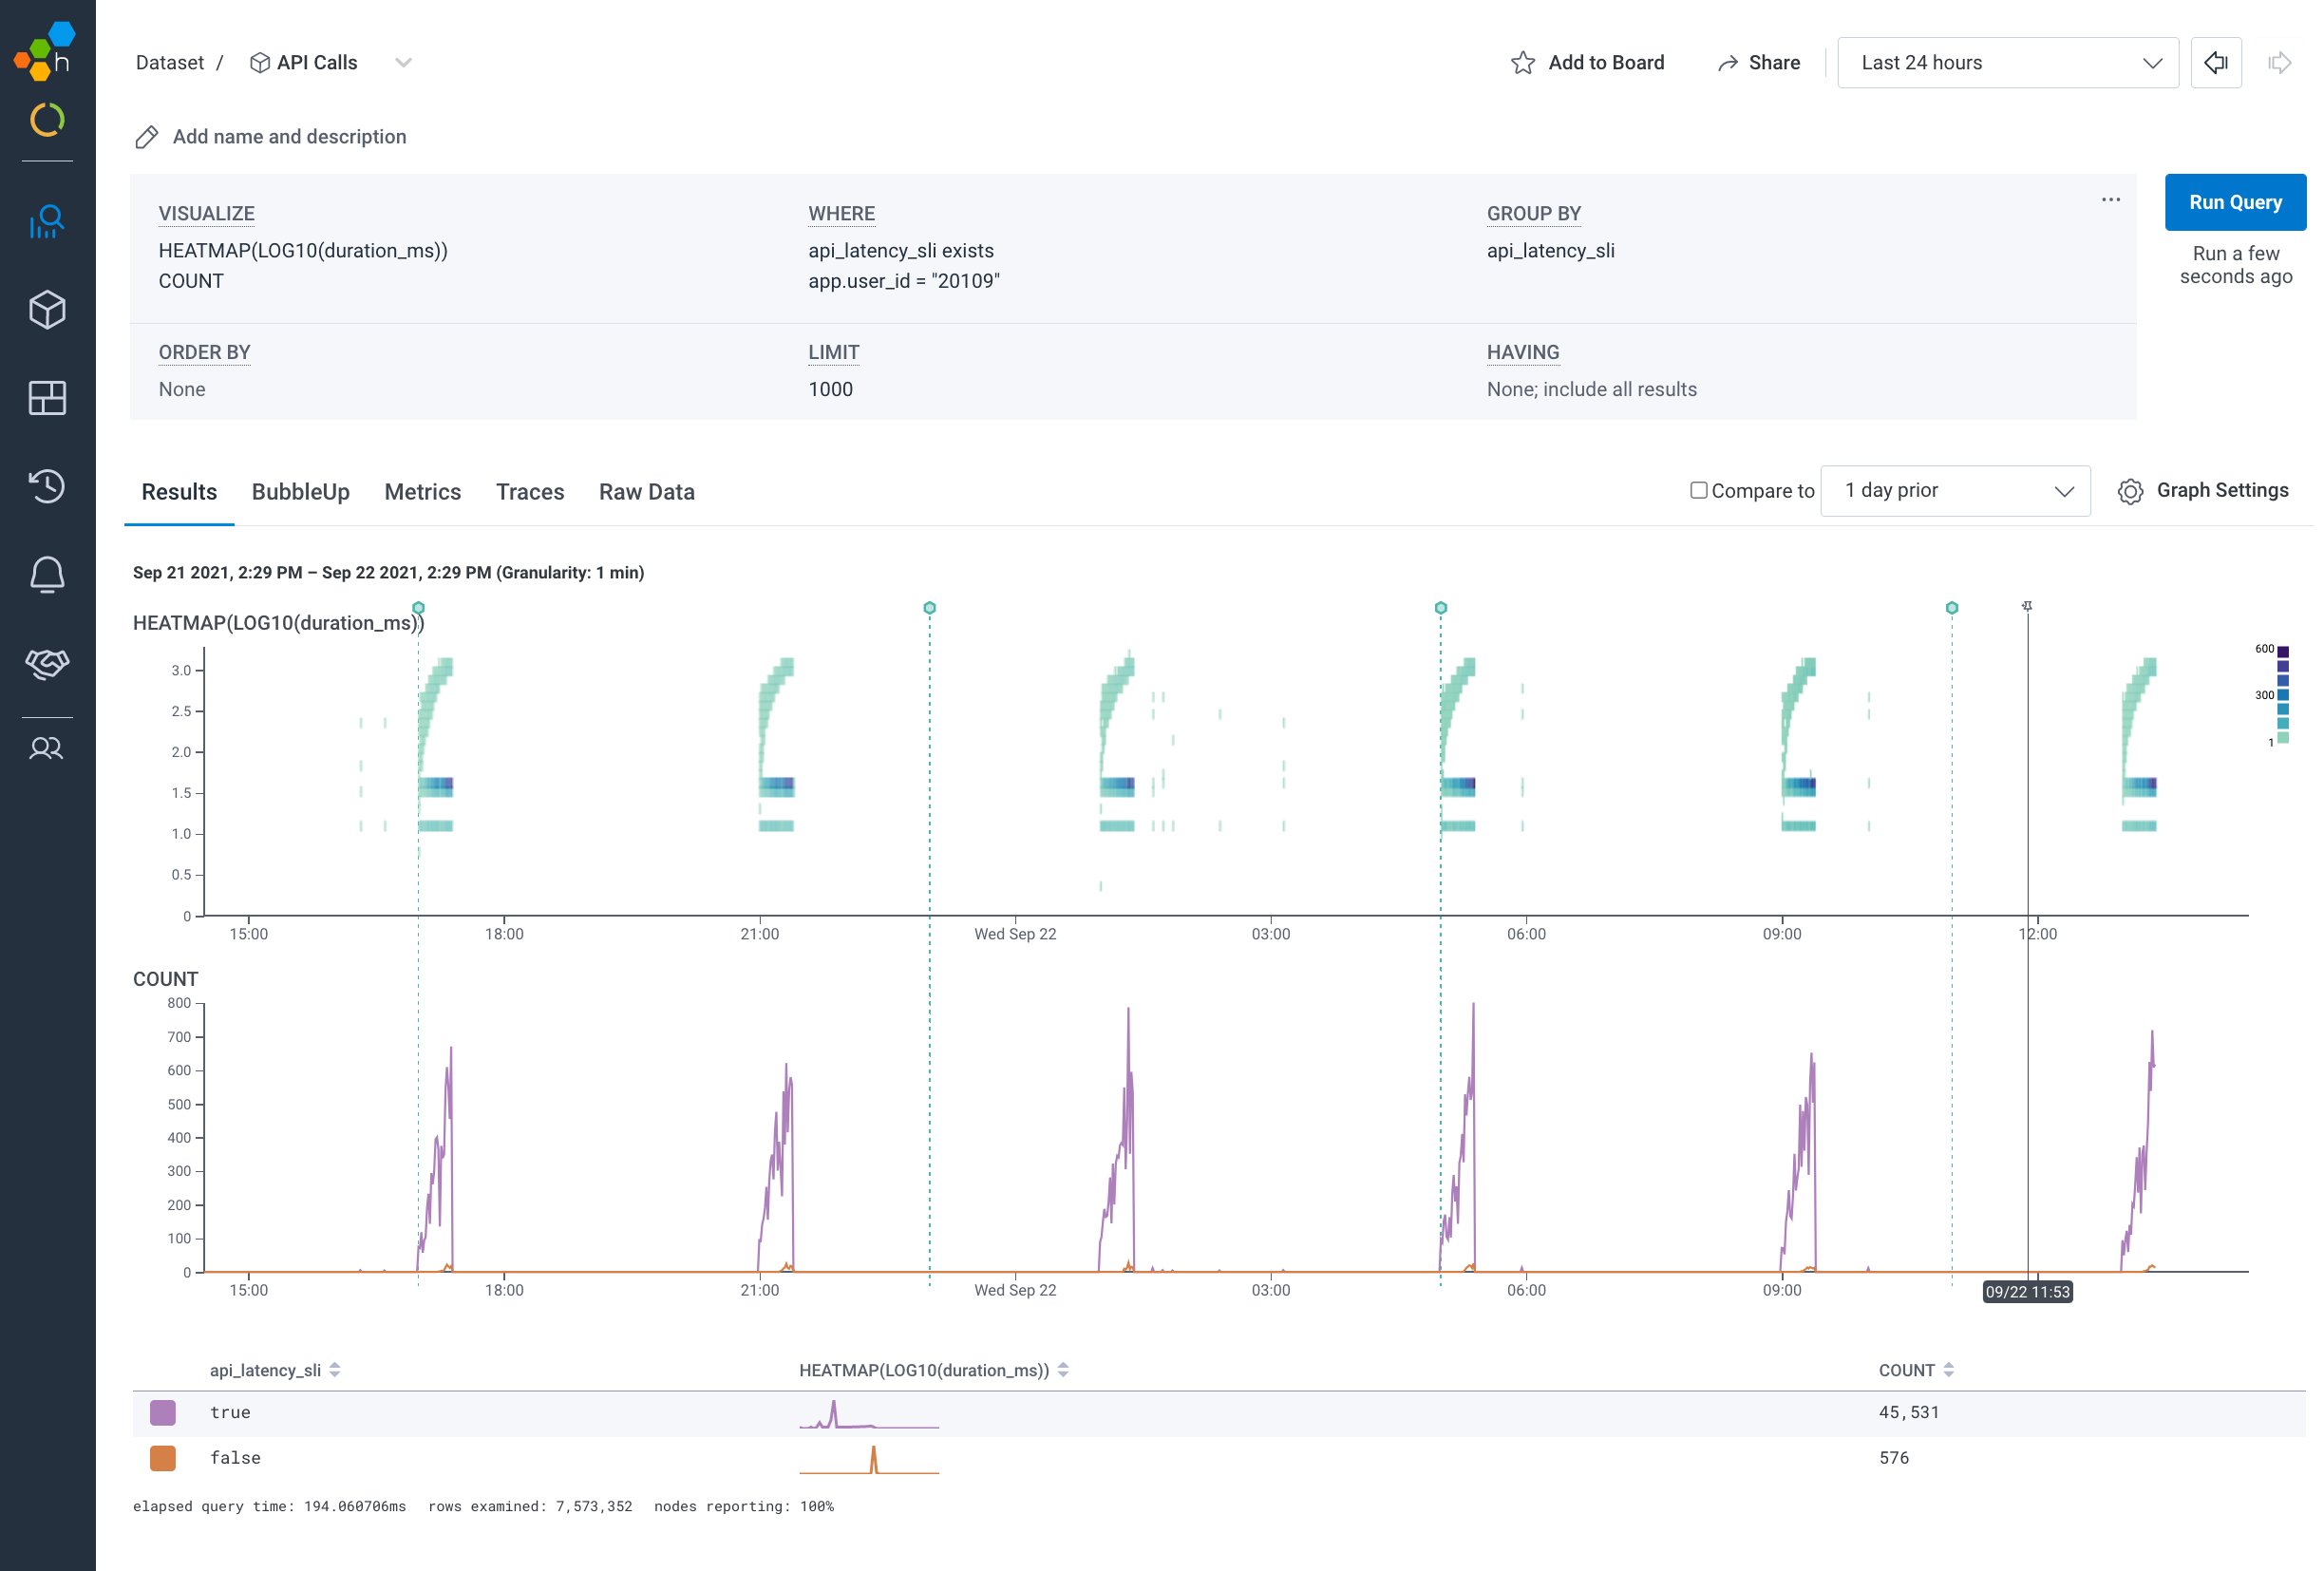
This is the Honeycomb SLO screen showing our API Latency SLO, which will be the jumping-off point for our investigations:
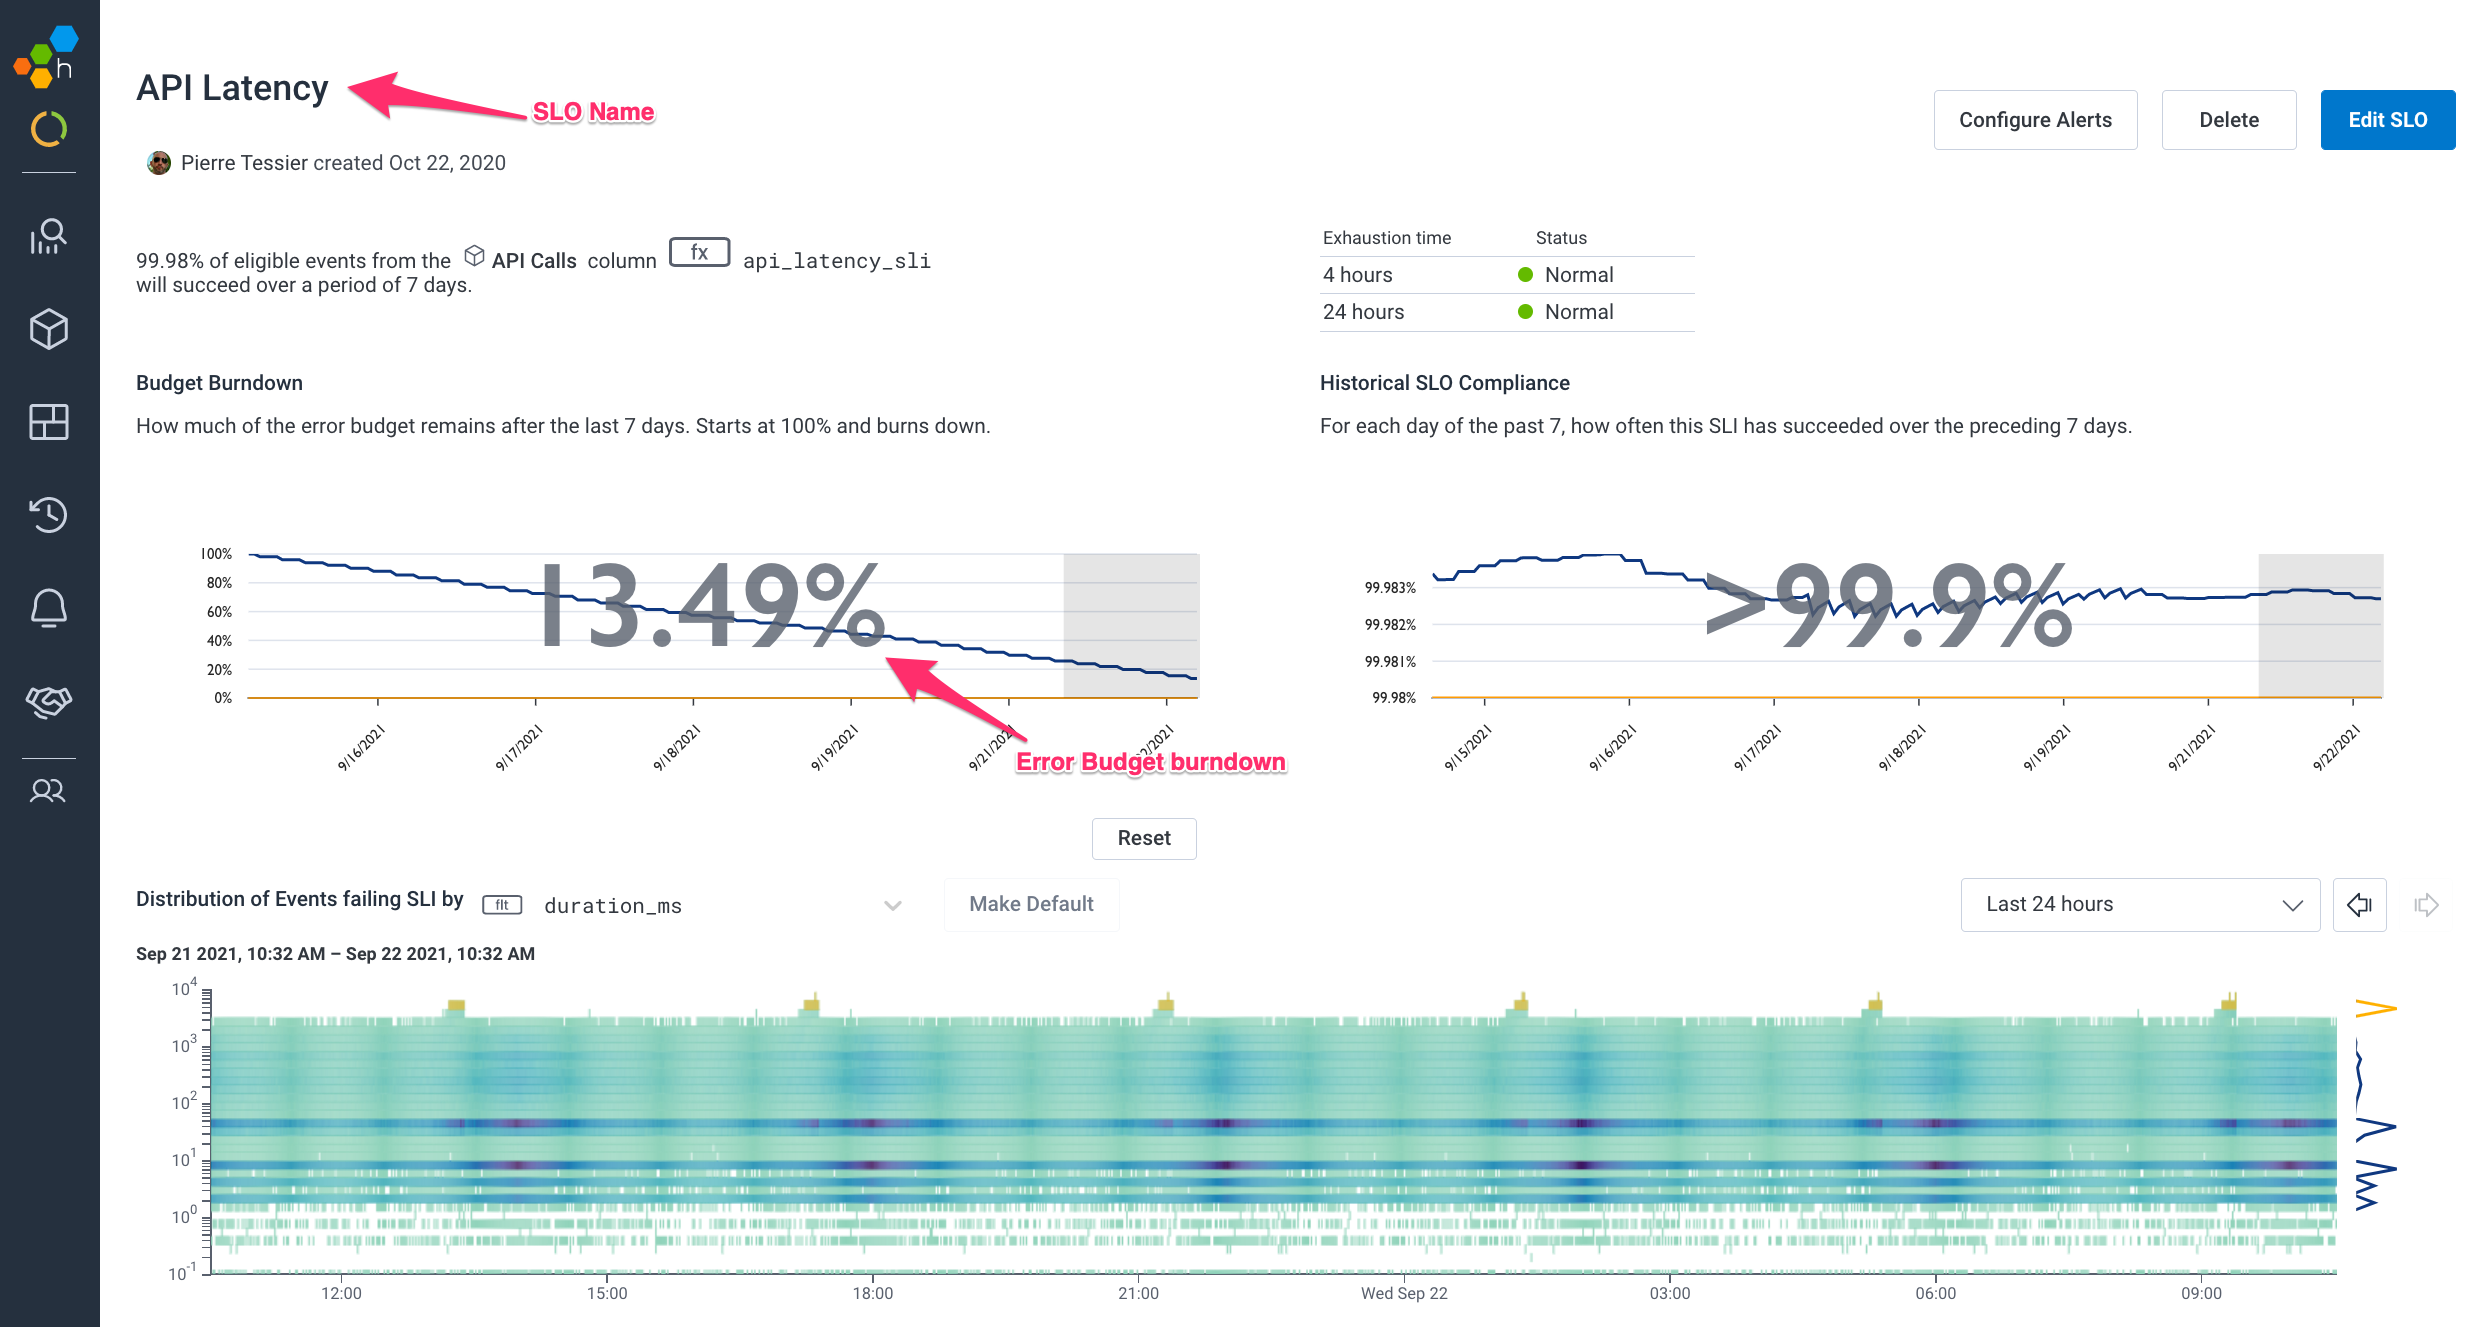
The top half of the SLO page, seen above, contains a few helpful graphs to quickly orient yourself to your customers' recent experience. This is intended to allow you to note if the burndown rate has changed dramatically or if the distribution of requests failing the SLI has changed in a significant way.
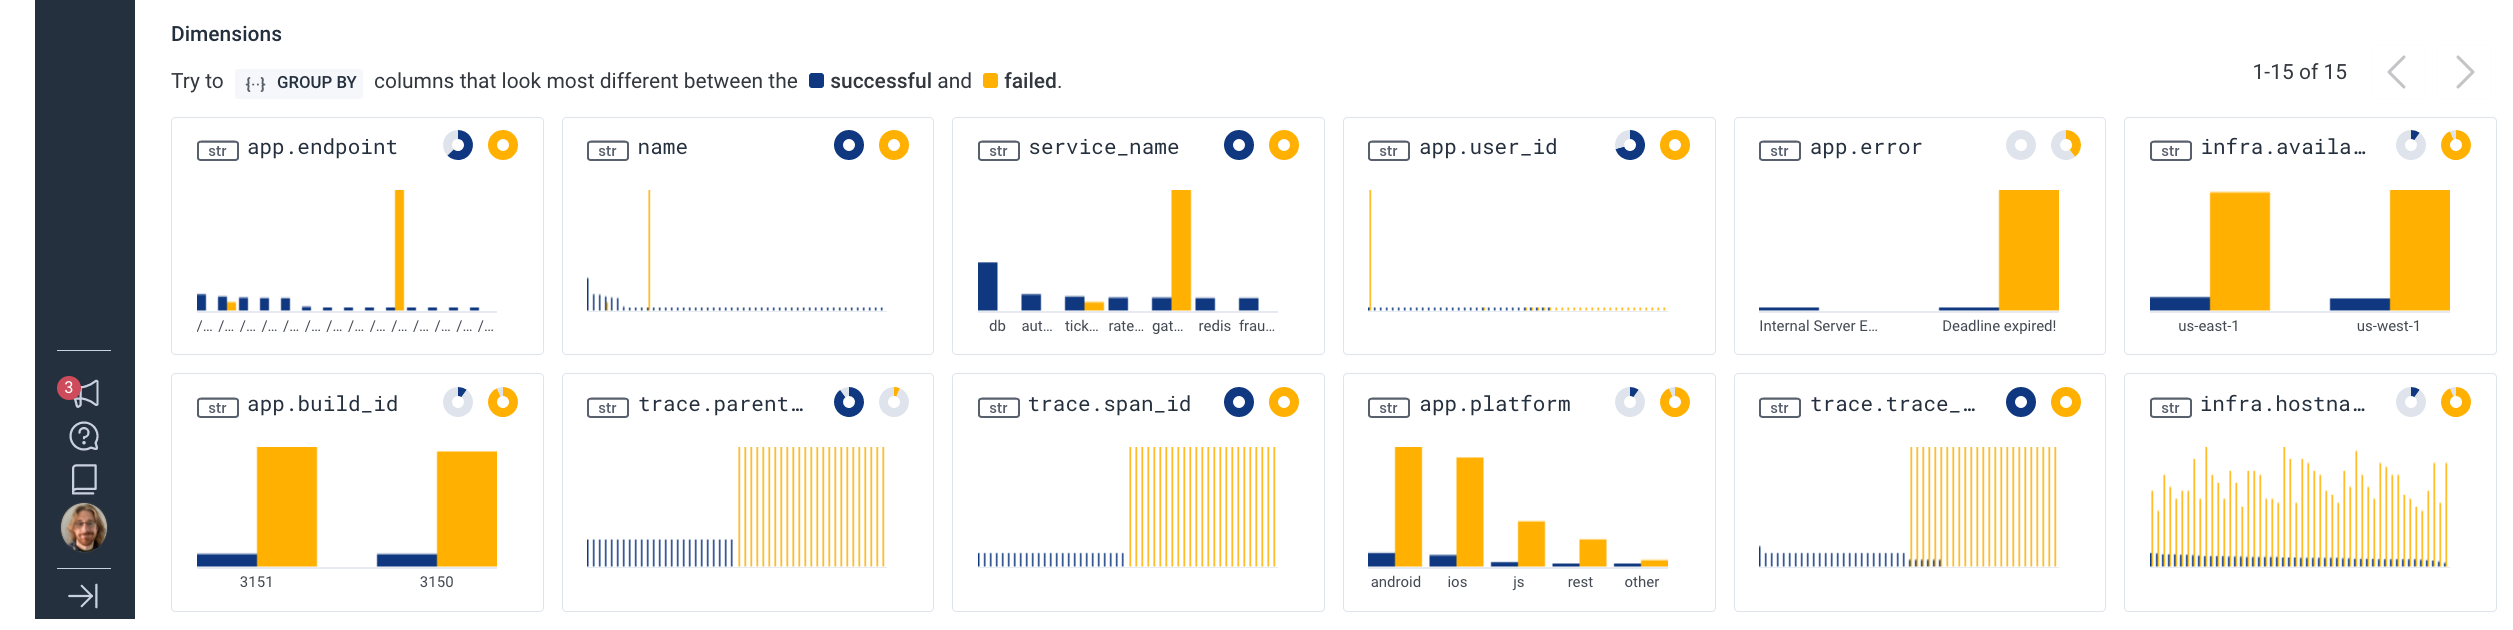
The SLO screen also runs a BubbleUp against your data to highlight potential anomalies in your data that may be worth exploring. The bottom of that page looks like this:
About BubbleUp
When BubbleUp runs, it computes the baseline for ALL of your dimensions, both within the selected time range and outside of it. It then diffs and sorts them so that the most different ones roll up to the top, with the goal of acting as waypoints to guide your investigation and removing the need for guessing at what could be related to the increased burndown rate of your error budget.
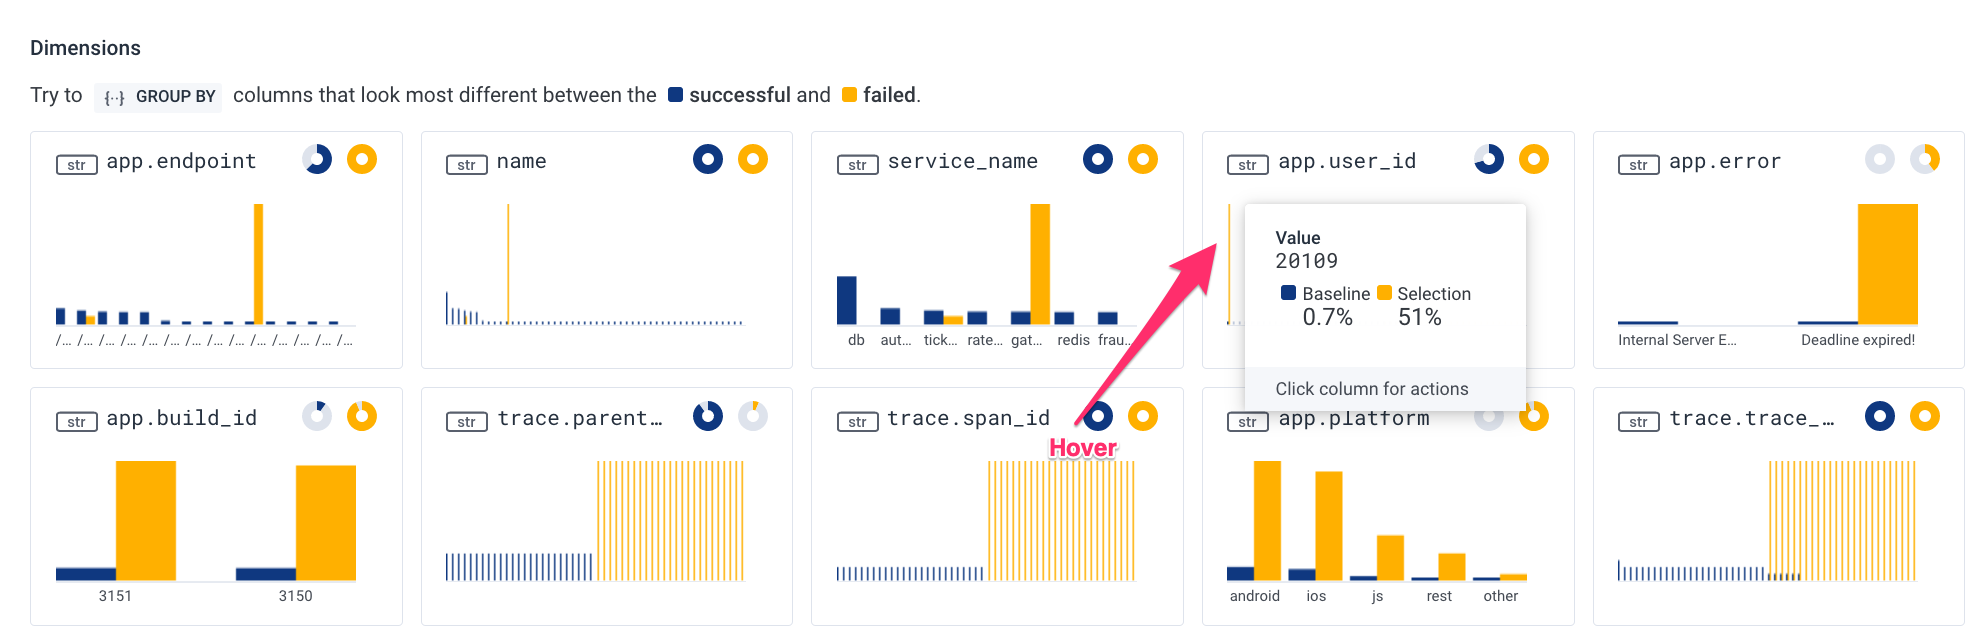
Looking more closely at the dimensions surfaced above, it looks like user ID 20109 is experiencing a disproportionate amount of requests falling outside of our latency goals:
When we click on the dimension graph and filter further by this single user ID:
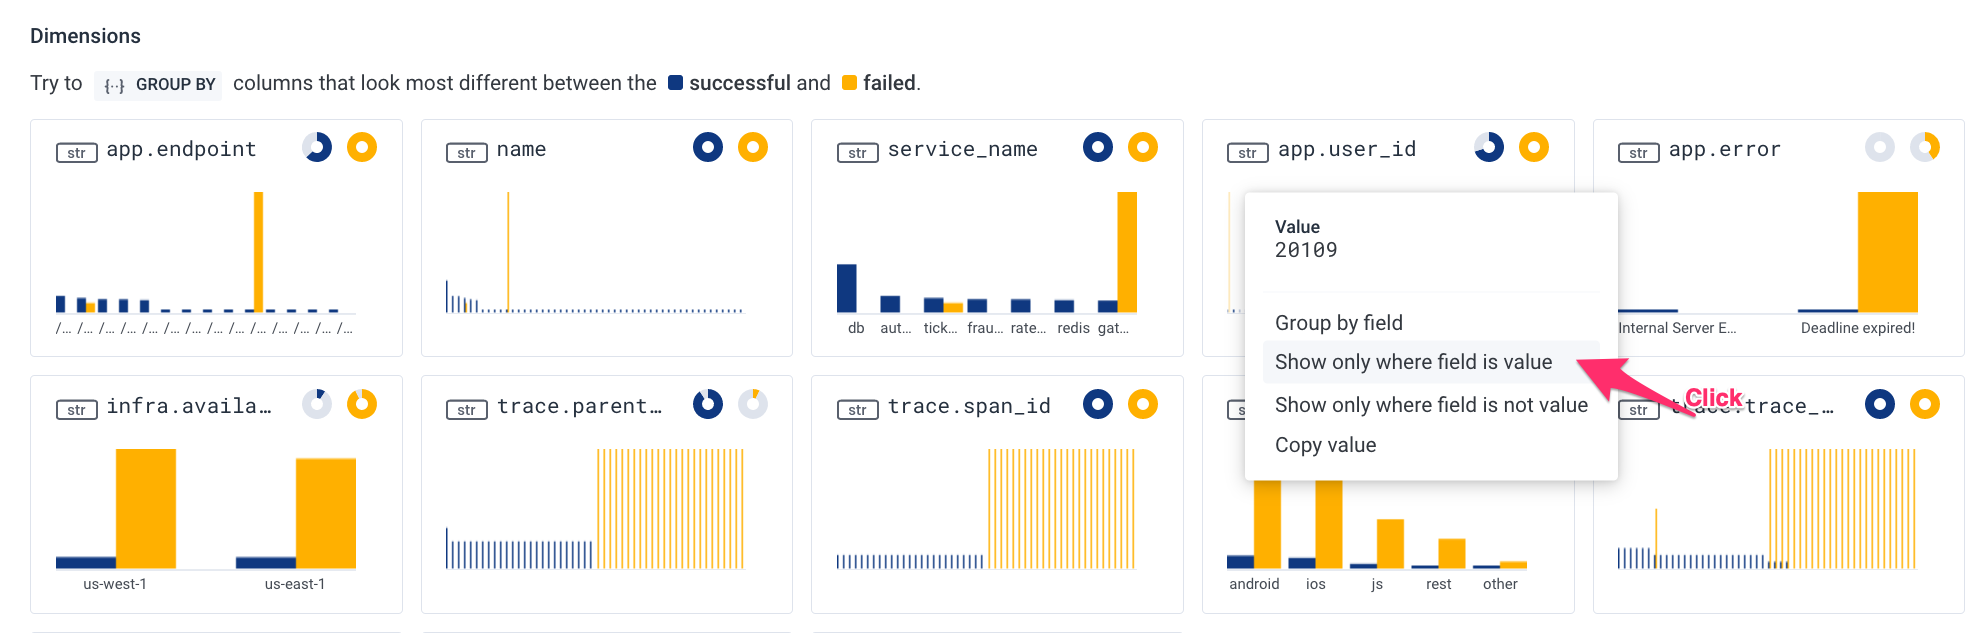
We are taken into the Query Builder with a pre-populated query to continue our investigation:
After just two clicks, we are able to see what’s different about the requests that are burning a greater proportion of our error budget. We are seeing that our API latency issues are localized to a single user. This sort of discovery and experimentation is quick, effective, and easy for any member of your team regardless of their seniority or level of experience.
We are now looking at the latencies experienced just by user 20109. Our telemetry data is telling us that they make a cluster of requests every four hours, and a small percentage (~1.2%) of those requests are failing to meet our latency goals, burning down our error budget as a result. By switching to the BubbleUp tab and highlighting one of the sections of high latency, BubbleUp can help us further expose dimensions for investigation:
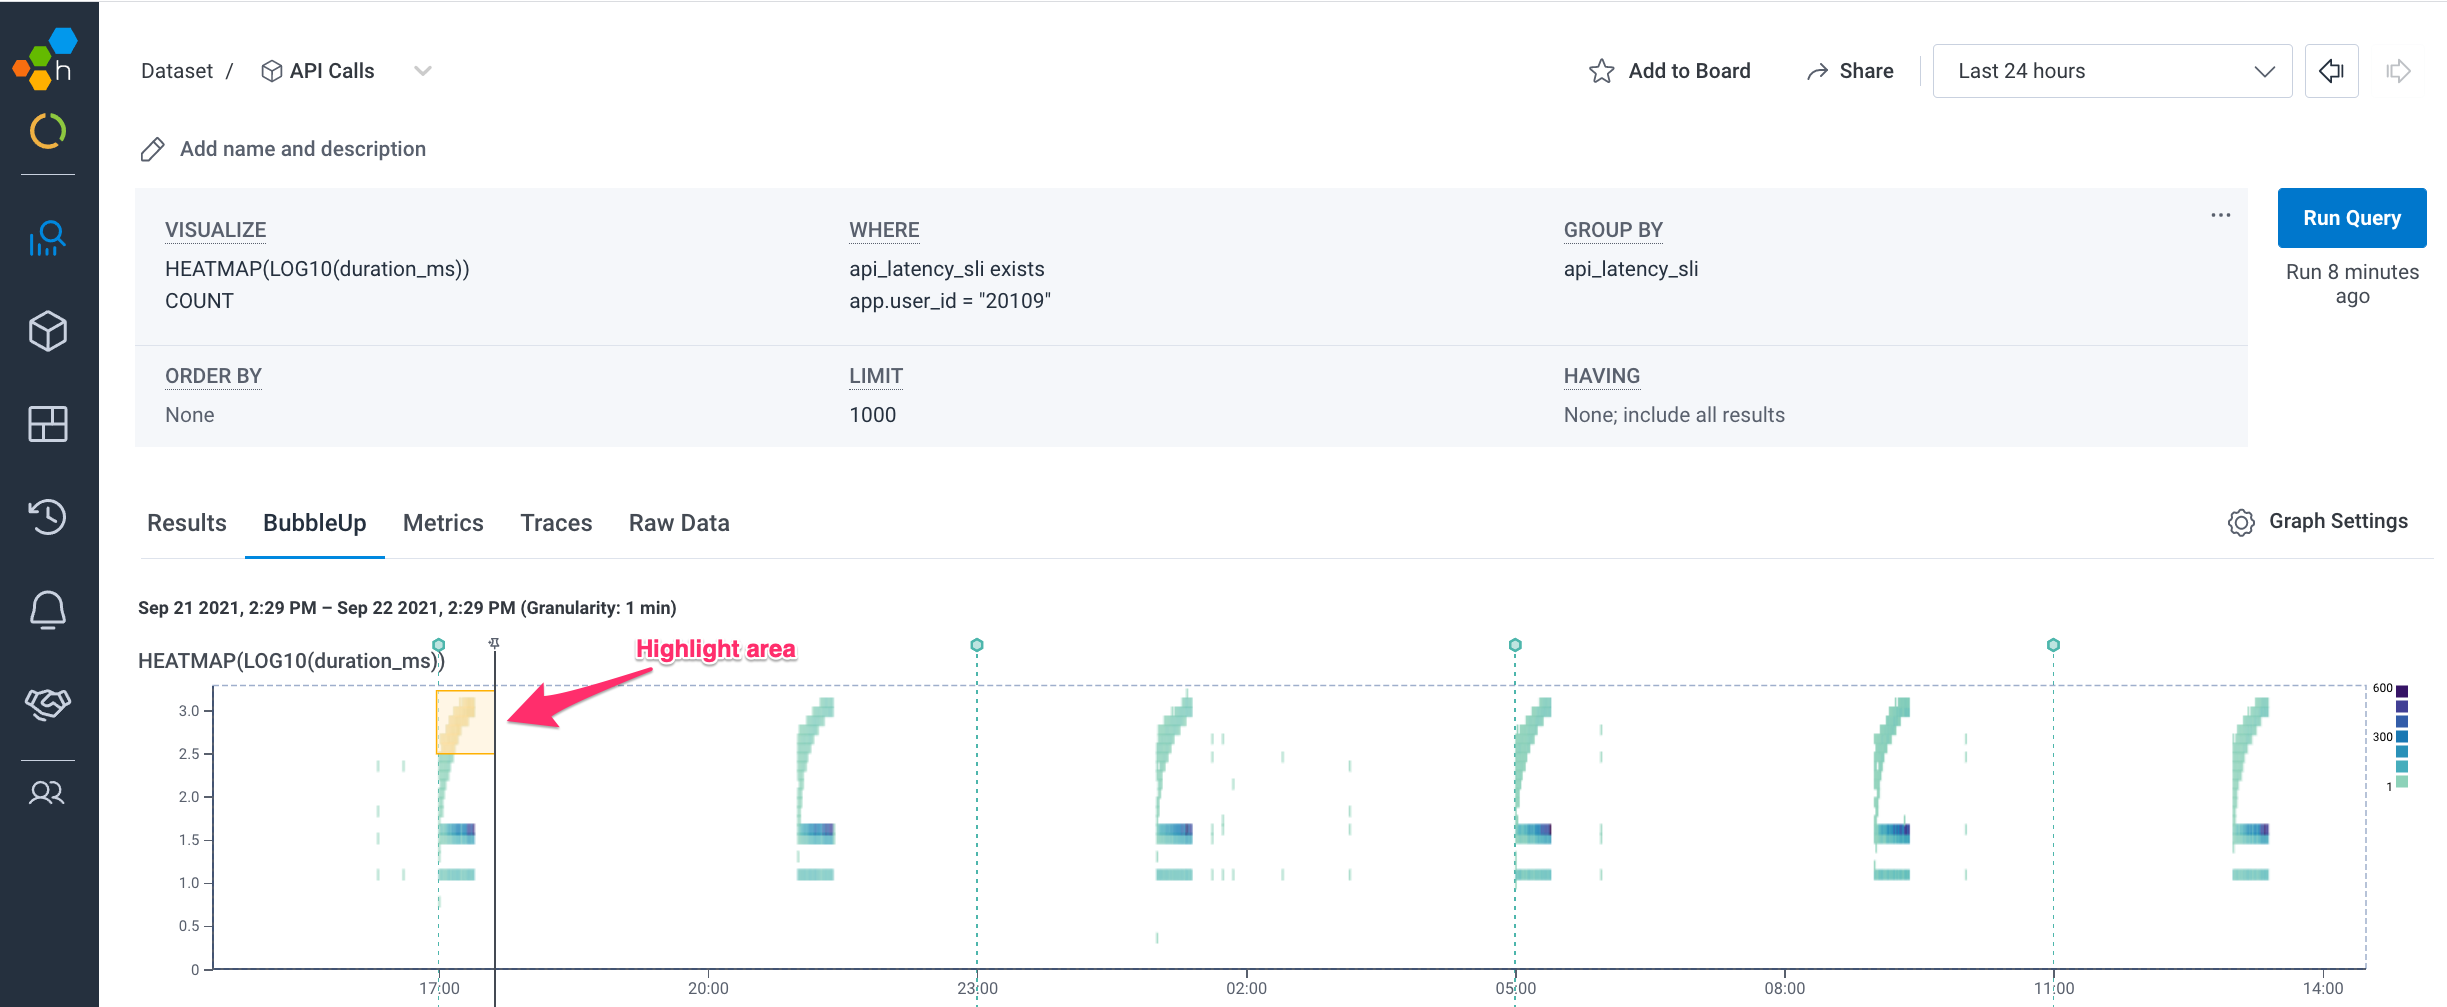
Once again, BubbleUp does all the work for us. We simply highlight a suspicious area on our heatmap that we would like to explain, and it calculates all dimensions inside and outside of that area, diffs them and sorts them, so that an explanation for the outliers comes right to the top.
After taking a quick look at the dimensions surfaced by BubbleUp, we can see a particular database query is potentially problematic:
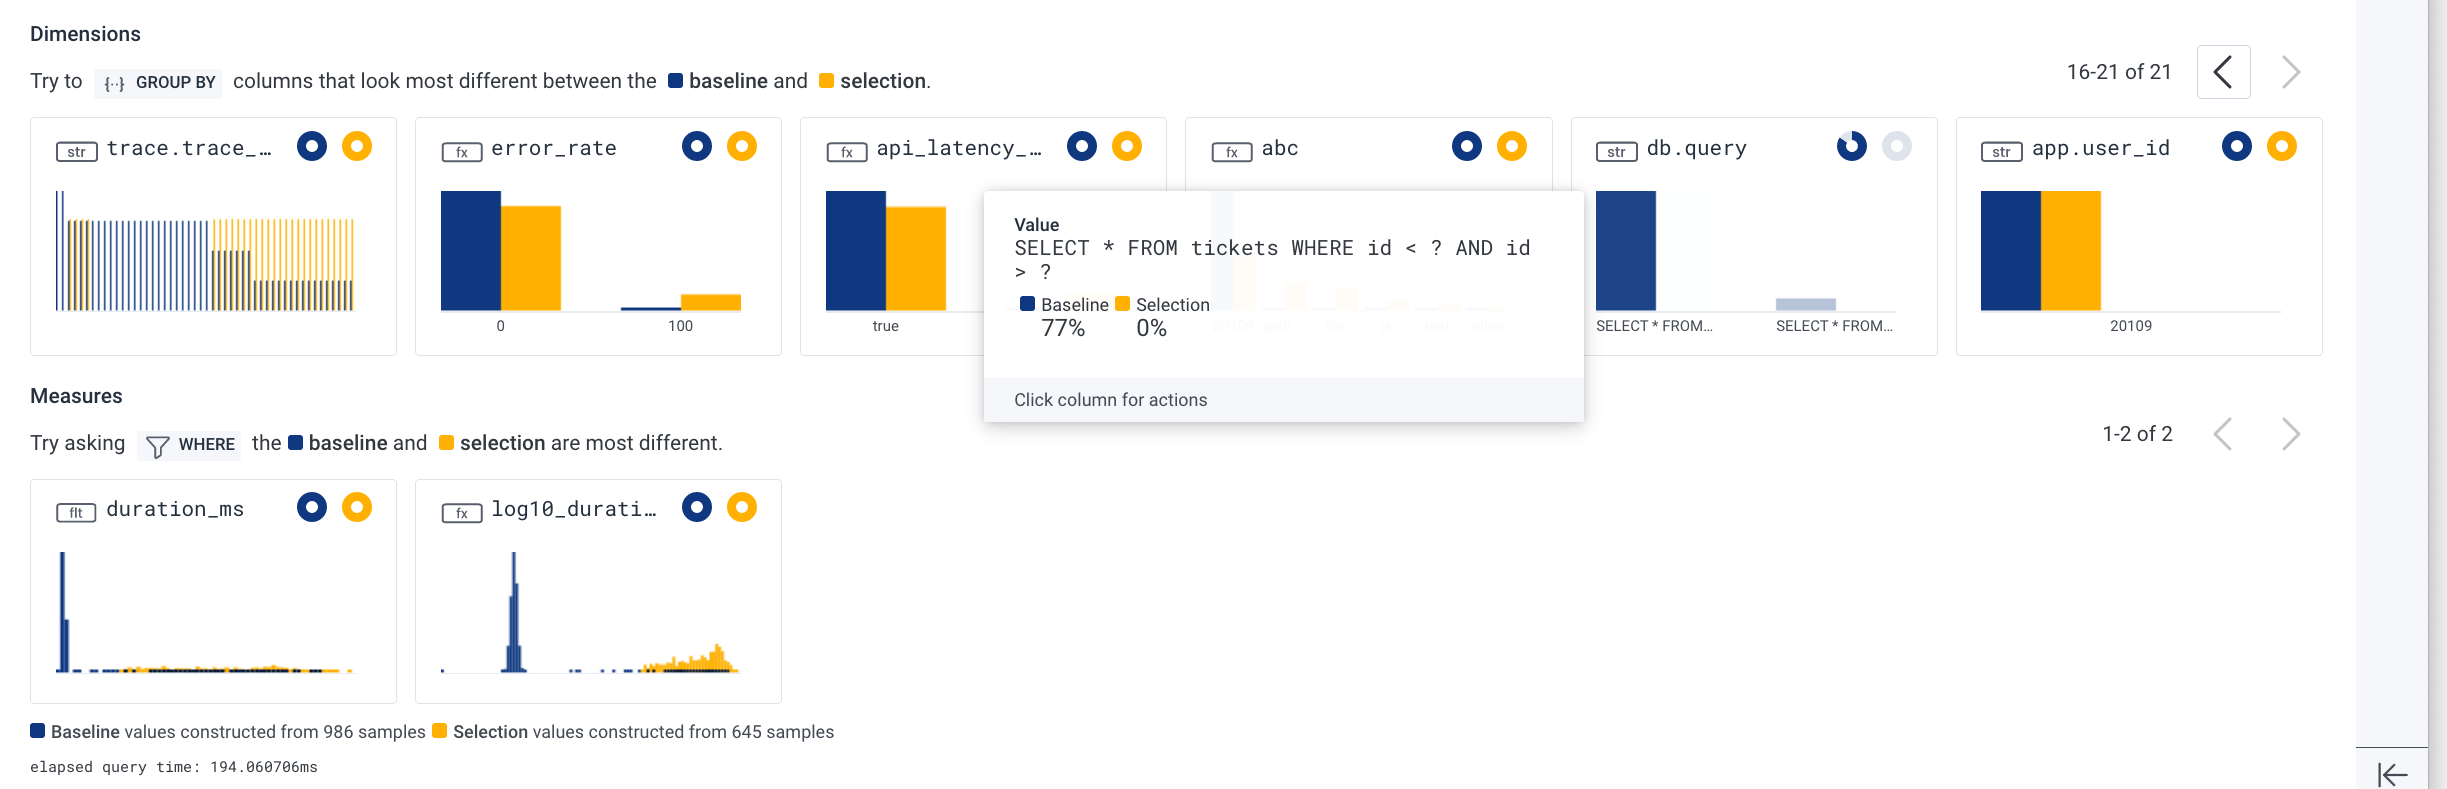
It looks like we may be running this particular query a lot during these longer duration requests! One more quick click, and we can further filter to only show traces that have this database query:
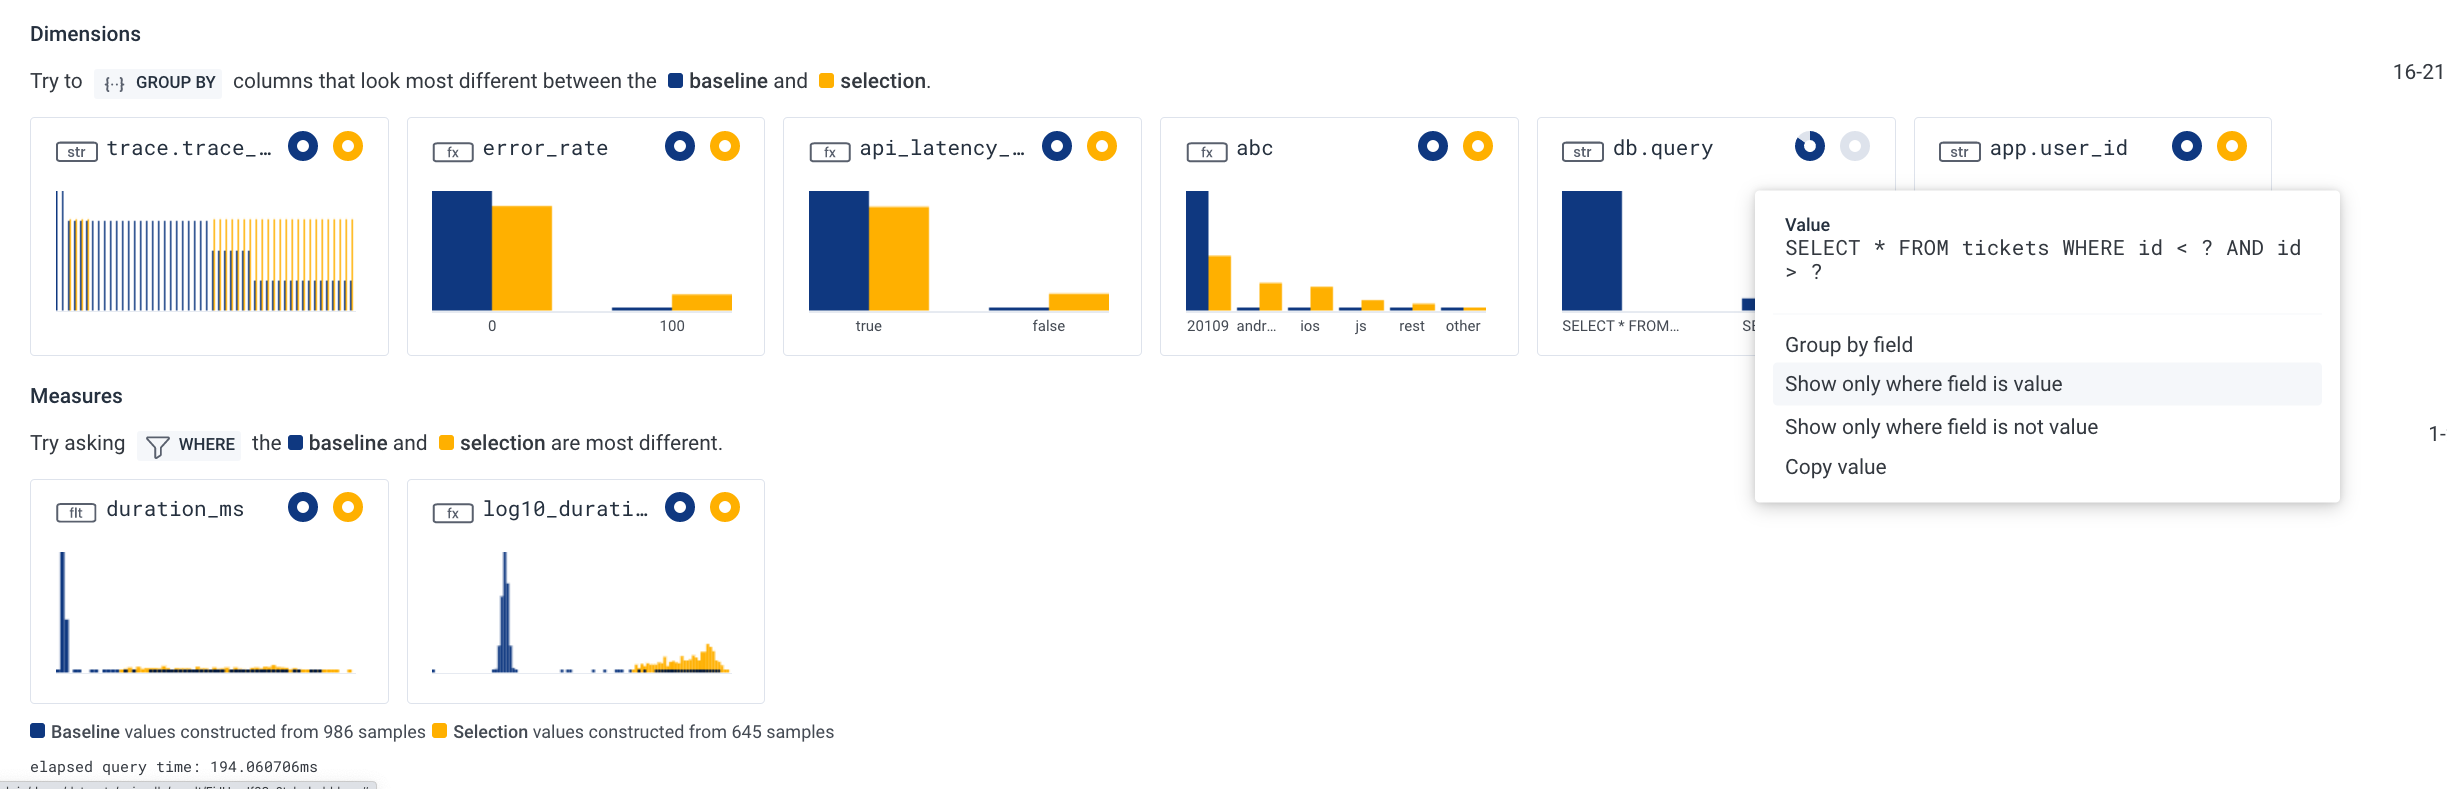
We have now filtered our data to show traces that have these high latencies and are running the suspected database query. The top trace in the list seems worth looking at more carefully as it contains 35 spans, but 29 of them are our suspected query:
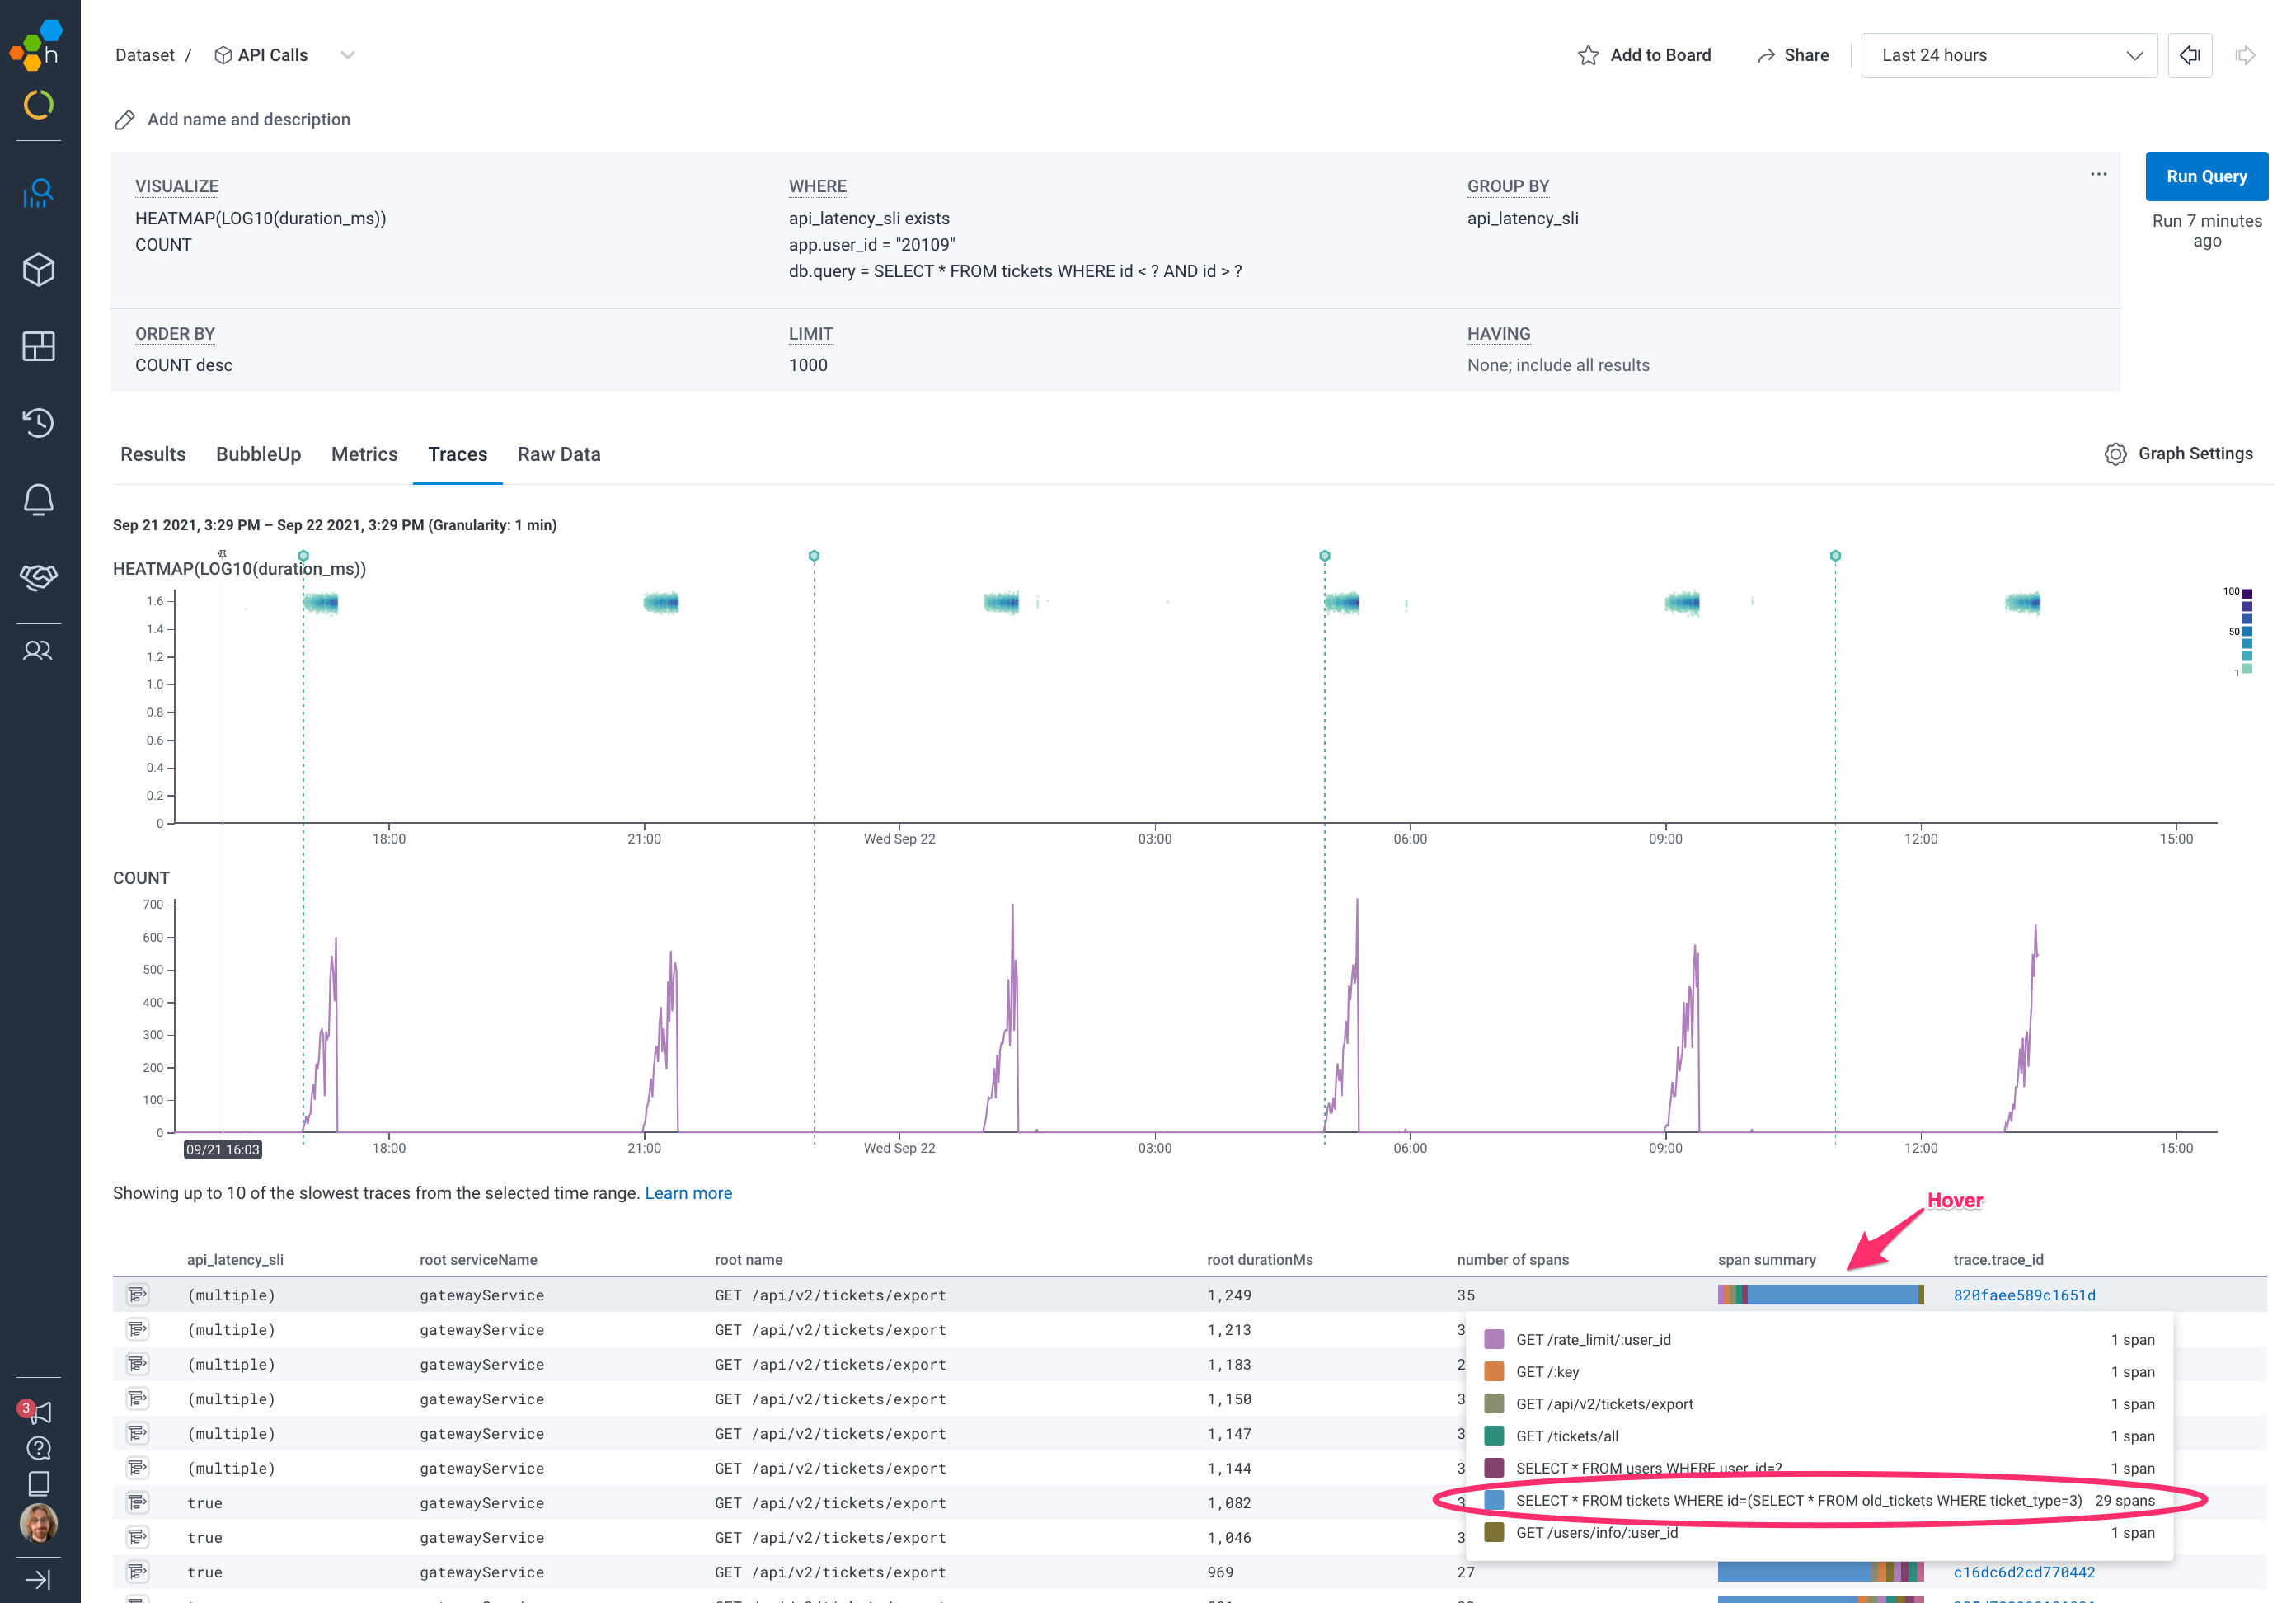
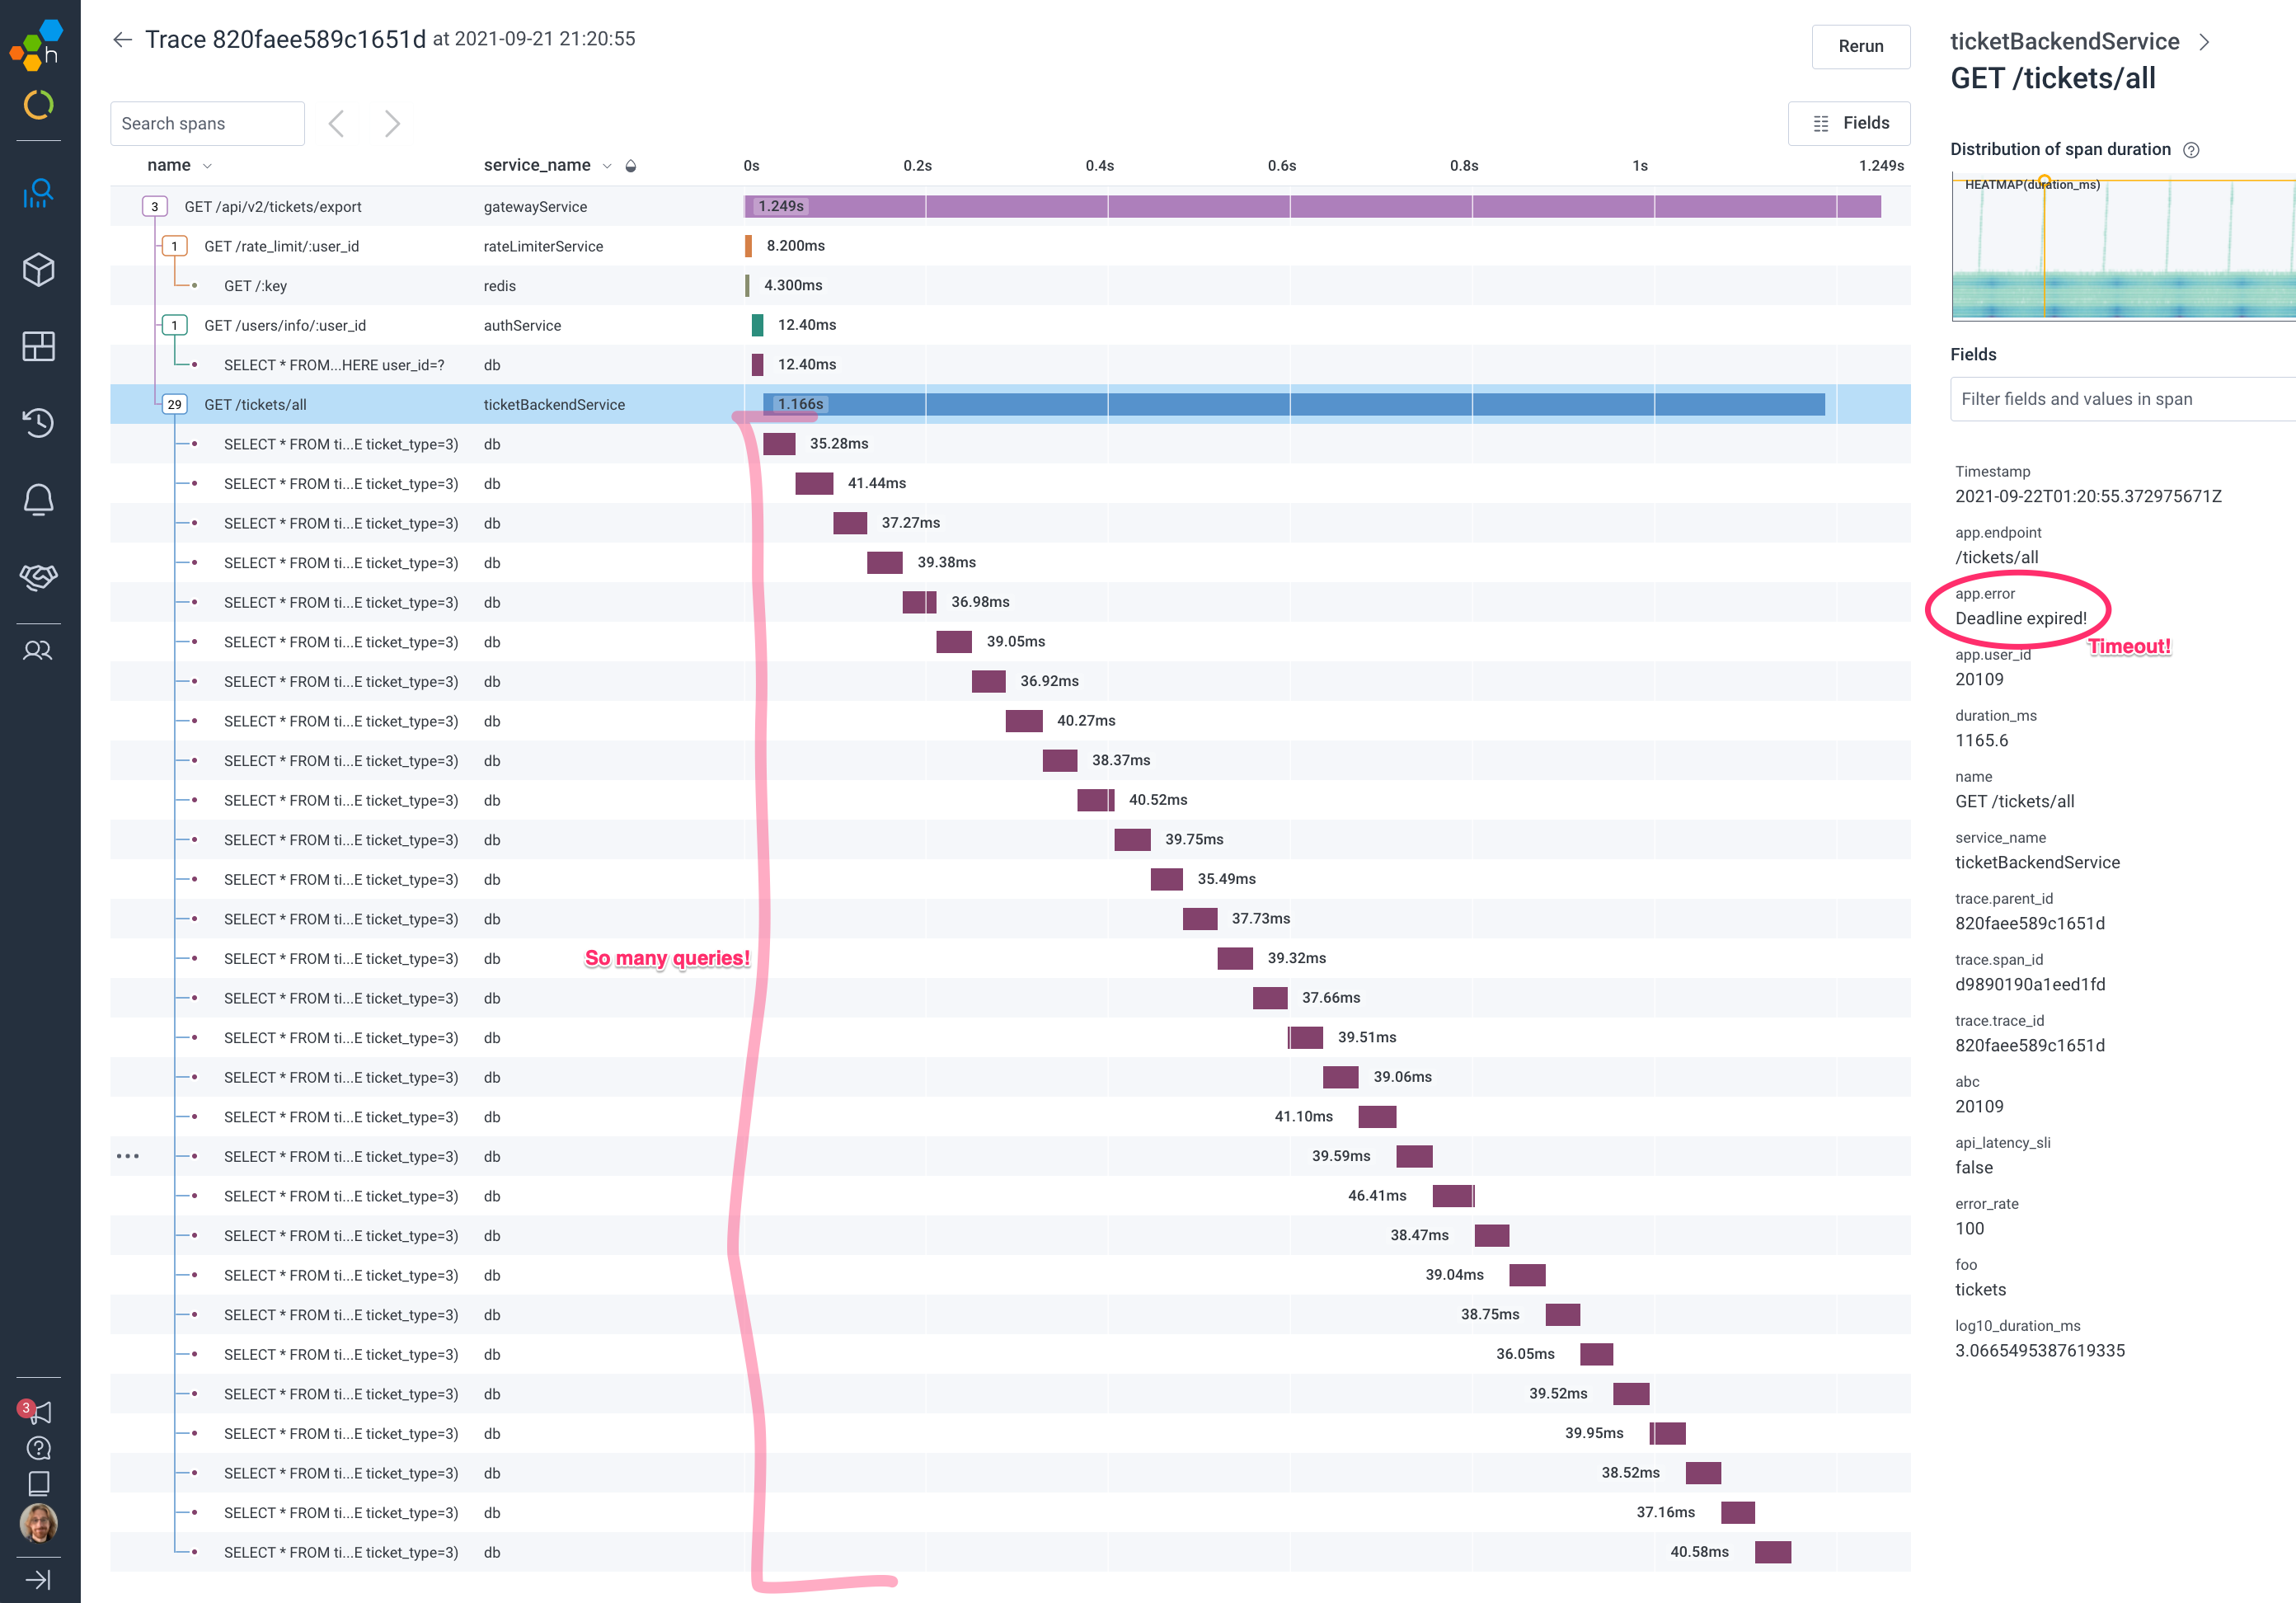
Clicking on the trace ID next to the span summary takes us into the trace waterfall view, where we can see that ticketBackendService is making 29 identical calls to our database over a 1100ms period and eventually timing out.
The above exploration can be performed in 3 to 5 minutes by anyone on your team with access to Honeycomb. Importantly, it assumes no prior experience with how this system tends to fail or failures of this type. You simply pull up your SLO, investigate one of the outliers, and rinse and repeat until you’ve isolated the problem. No local expertise required.
Even if the initial path of exploration doesn’t lead to resolution, it is important to understand that these paths of exploration are quick and easy. If a BubbleUp and Filter cycle doesn’t lead to more insight, you can simply back up, re-orient yourself, and try another method of exploration.
With Honeycomb SLOs as your triage launchpad, your team is able to make data-driven discoveries about what is affecting your customers in production—no more hunches or history lessons required.
Interested in seeing why Honeycomb’s event-based model is different? Sign up for a free Honeycomb account today.
Related Posts
Driving Culture Change: Phorest's Observability Transformation
Phorest delivers a premier software solution that empowers their salon and spa business customers to thrive. Ensuring every engineer has access to an observability tool...
Alerts Are Fundamentally Messy
Good alerting hygiene consists of a few components: chasing down alert conditions, reflecting on incidents, and thinking of what makes a signal good or bad....
From Oops to Ops: SLOs Get Budget Rate Alerts
As someone living the Honeycomb ops life for a while, SLOs have been the bread and butter of our most critical and useful alerting. However,...