Taming A Game-Changer: Honeycomb and GraphQL at VendHQ
By Guest Blogger | Last modified on August 27, 2019This guest post is from Evan Shaw, Lead Engineer at vendhq.com.
GraphQL: a game-changer
GraphQL is a query language for APIs. It allows you to expose all your data through a single queryable graph. Compared to RESTful APIs, GraphQL brings greater flexibility in how your data is exposed, a more structured schema for type safety, and fewer round trips to your server for better latency. When we introduced a GraphQL at Vend, the feedback from our frontend engineers was clear: "This is a game-changer."
However, all the great frontend flows enabled by GraphQL came with a complexity cost to our backend: we didn't know what was going on server-side anymore. With traditional RESTful APIs, a single HTTP endpoint typically has a single purpose. It can be meaningful to aggregate metrics for a single endpoint about response times, status codes, and so forth because it's reasonable to expect a certain amount of consistency.
GraphQL is different. The single HTTP endpoint a GraphQL API typically exposes can do infinitely many different things depending on the query that's passed to it. Aggregating metrics is meaningless when you have something so flexible that you expect it to behave inconsistently across different inputs and there's no clear way to classify the metrics.
We knew all this when we started down the path toward understanding what our servers were doing, but we still had some false starts along the way.
Things we tried
Initially, we reached for our usual tool: Datadog. Our GraphQL schema had a sufficiently small number of types and fields defined that it was possible to tag metrics with them all individually and not run into problems. We knew our schema would grow over time and this might become impractical, but we needed a starting point, and this seemed like something that could work well enough.
It didn't. With the tagged metrics we could sometimes get an idea of whether a particular field was slow to resolve, but there was no way to figure out what the overall query was doing that might be making it slow. There was nothing connecting the metrics together aside from object name and field name, and we needed more context.
No one even paid attention to these tagged metrics because the data was hard to deal with, and even once dealt with, it just wasn't useful.
The next thing we tried was AWS X-Ray. This was better than tagged metrics in Datadog because it let us tie together multiple events within the same GraphQL query. This gave us more insight into what was going on, but we found it difficult to use, which meant that we often didn't use it at all.
Honeycomb to the rescue!
Some engineers elsewhere within Vend were having some success using Honeycomb tracing to diagnose tricky performance issues, so I decided to try to hook it up to our GraphQL API.
We use gqlgen, a Go library and code generation tool for GraphQL. It exports an interface that allows implementations to react to various points in the execution of a GraphQL operation. It was fairly straightforward to create an implementation of this interface that used Honeycomb's Beeline library for Go, and to add the wrappers around our HTTP router and the HTTP client we used to make requests internal to our network.
It wasn't long before I got my first trace. Which was interesting, but a little too big to be very useful.
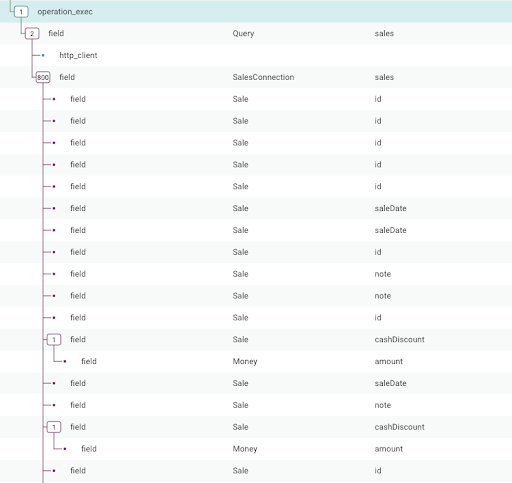
(Mentally append 100-200 similar screenshots to this one and you'll get a fuller idea.)
The slower traces tended to have more than 5000 segments in them, which made analyzing them very difficult. I realized that every field queried by the GraphQL query was being included as a span in the trace. This wasn't very useful because in many cases the fields are being resolved simply by reading a field from a Go struct, and there's really not a lot that can go wrong.
My next step was to not create spans for those "simple" fields. I decided to include only fields that were either:
- Resolved through a dataloader or other more complex mechanism
- Complex objects; not scalar "leaf" fields
This would give a more readable trace that excluded most of the noise.
My implementation looks like this:
// markerCtx is an implementation of context.Context that simply serves as a marker to tell us that we don't
// need to send a span. We use it when a field does not have a resolver method and isn't worth recording.
type markerCtx struct {
	context.Context
}

func (tracer) StartFieldResolverExecution(ctx context.Context, rc *graphql.ResolverContext) context.Context {
	if len(rc.Field.Selections) == 0 && !rc.IsMethod {
		return &markerCtx{ctx}
	}

 	var span *trace.Span
	ctx, span = beeline.StartSpan(ctx, "field")
	span.AddField("app.resolver.object", rc.Object)
	span.AddField("app.resolver.field", rc.Field.Name)
	return ctx
}

func (tracer) EndFieldExecution(ctx context.Context) {
	if _, ok := ctx.(*markerCtx); ok {
		return
	}
	trace.GetSpanFromContext(ctx).Send()
}
Findings
Now the slowest traces were starting to look interesting. The first thing we found was that due to a bug, one of our frontend applications was sending an unnecessary, mostly-empty query. And due to a quirk in the defaults of our schema and resolver, that mostly-empty query turned out to be very expensive.
So the first step was to make it not-expensive (because it didn't need to be), which reduced the urgency of fixing the frontend bug. Next step will be to actually fix the frontend bug.
I also found that our dataloaders weren't working as effectively as we'd like. Dataloaders batch data fetches together to avoid n+1 single-entity fetches. Due to some limitations in gqlgen, dataloaders work on a timeout rather than having an understanding of whether resolver goroutines are blocked, waiting for a result.
We initially had our dataloader timeouts set at 1ms, which seems obviously too low in hindsight, but this was made clear when we saw our query traces.
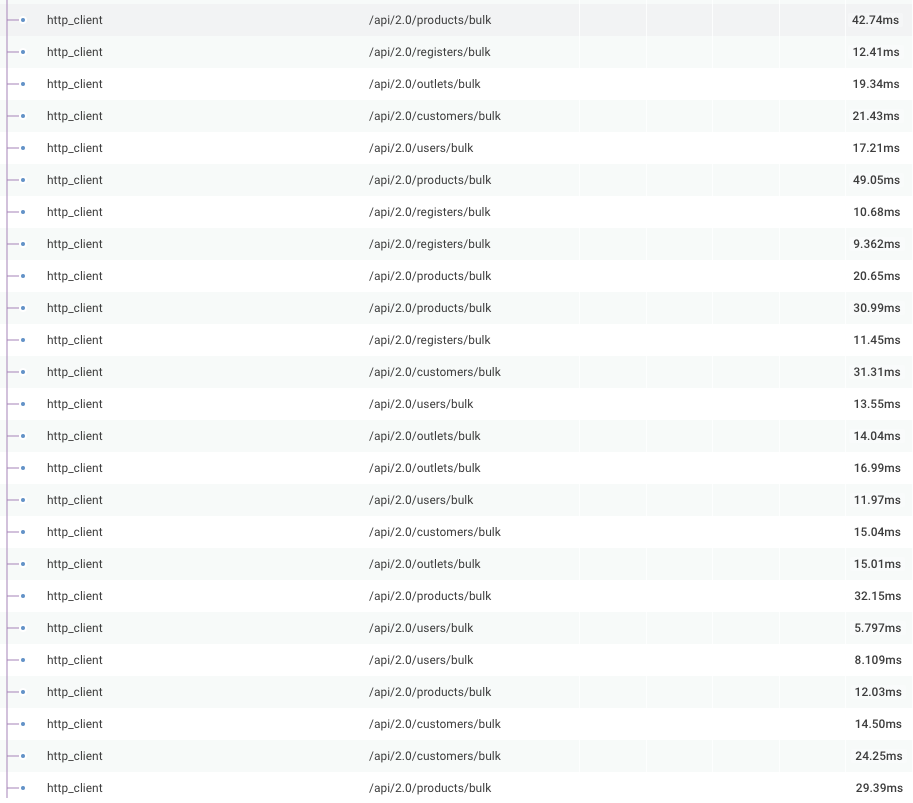
Because of the short timeout, batches were being sent too often to our internal APIs. We increased the dataloader timeout, which significantly decreased the number of internal requests we were making (albeit at the expense of increasing the minimum latency for some queries).
What's next
Things still aren't perfect. There remain slow traces to dig through and solve. Our retention is also not very good and some sampling is in order. And I'm still struggling with some aspects of gqlgen's tracer interface.
The traces still aren't quite as focused as I'd like them to be, even after cutting out some types of fields from the trace. There may be a way to improve that situation through some sort of span sampling as well.
All in all, though, we have a much better idea of what's going on in our service. We're now able to answer questions that we previously wouldn't have dared to ask and connect the dots on some of the standalone metrics that we had been recording.
Want to solve problems like these in your production environment? Sign up for a free Honeycomb trial.
Related Posts
Transforming Financial Services with Modern Observability: Moov's Story
As a new company poised to transform the financial services industry with its modern money movement platform, Moov wanted an equally modern observability platform as...
What Is Application Performance Monitoring?
Application performance monitoring, also known as APM, represents the difference between code and running software. You need the measurements in order to manage performance....
Where Does Honeycomb Fit in the Software Development Lifecycle?
The software development lifecycle (SDLC) is always drawn as a circle. In many places I’ve worked, there’s no discernable connection between “5. Operate” and “1....