Tracing and Observability for Background Jobs
By Nathan LeClaire | Last modified on April 11, 2019Illuminating the under-loved with Honeycomb
Most modern web apps end up sprouting some subset of tasks that happen in the “background”, i.e., when a user is not directly waiting on the request from a server to finish. These types of tasks range across all kinds of use cases - processing media, generating aggregate statistics for later view in the front end, and syncing data to 3rd party providers are just a few of many examples. These jobs rapidly become of great importance, but frequently have some of the worst observability, leaving their implementers and operators guessing when it comes time to troubleshoot a problem. They can also spiral out of control when queues back up or programs retry operations too aggressively, so they become relevant to production health quickly.

With Honeycomb's event-oriented data store and tracing capabilities, however, you can gain unprecedented insight into these critical yet mysterious processes.
An example using cron
One of the most common ways these types of tasks are executed is by using cron to invoke a given program on a schedule. Let's take a look at what instrumenting and observing a cron job would look like using Honeycomb.
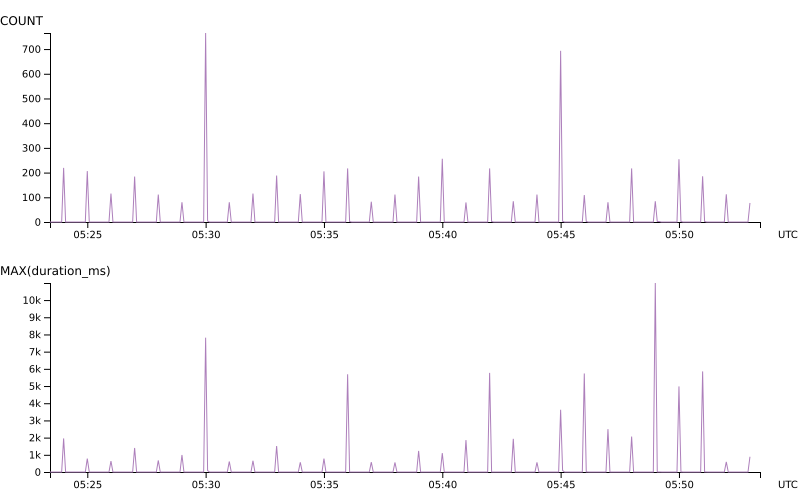
Our program will generate one event per tracing span in the eventual traces we want to access in the app. Each invocation will generate several spans representing the different “chunks” of work in the lifetime of the program, and may even generate hundreds or thousands. When we visualize a query of the root span latency (MAX(duration_ms) below) as well as the COUNT of total events, we can see that our Honeycomb data has a “pulsey” pattern, since the program comes online periodically to do its work, sends the data for that interval, and then no data is generated until the next invocation.
Another example: our saas-update program
At Honeycomb, we wrote a program that wakes up every hour and pushes some data from our MySQL database to various SaaS services we use, mostly for customer success purposes. For instance, we want to send a series of emails out to folks who are currently trialing, and we need to get the information about who is in that state to tools like Intercom. Since we were not ok with shipping it to production without being able to understand what's happening with it, we instrumented the program from Day 1 using our Go Beeline.
saas-update has 3 main “chunks” of work:
- An Intercom portion, which updates Intercom Users with details like a templatized query allowing us to jump right to their data in Honeycomb, which part of the acquisition lifecycle they are in, and so on.
- A SalesForce portion, which posts new signups as leads to Salesforce, and updates existing leads/contacts with relevant details.
- A Stripe portion, which fixes up any billing details just in case something went wrong with the initial attempt to activate a customer.
That's a lot of potential chaos! But luckily, Honeycomb can help us figure out what's up when things go wrong.
As you can probably guess, these distinct portions of the job have totally predictable function names like UpdateIntercom, UpdateSalesforce, and UpdateStripe. These get called from the main function of the program.
In the main function of the program, first we generate a Go context.Context by calling beeline.StartSpan that will eventually get plumbed through each of these calls. That allows us to ensure each of the calls generates and sends spans that are all unified together, allowing us to eventually present a coherent trace view.
ctx, span := beeline.StartSpan(ctx, "start")
defer span.Send()

if err := UpdateIntercom(ctx); err != nil {
    beeline.AddField(ctx, "intercom.error", err)
}

if err := UpdateSalesforce(ctx); err != nil {
    beeline.AddField(ctx, "salesforce.error", err)
}

if err := UpdateStripe(ctx); err != nil {
    beeline.AddField(ctx, "stripe.error", err)
}
Each sub-section of the program will also call StartSpan with this original context to generate their own spans. These functions generating their own spans, in the end, gives us a waterfall that looks something like the following in the trace view. This visualization shows which sections of the program are executing more slowly than others. For instance, you can see that whole program took about 30 seconds to run and the Salesforce portion took about 25 seconds to run.
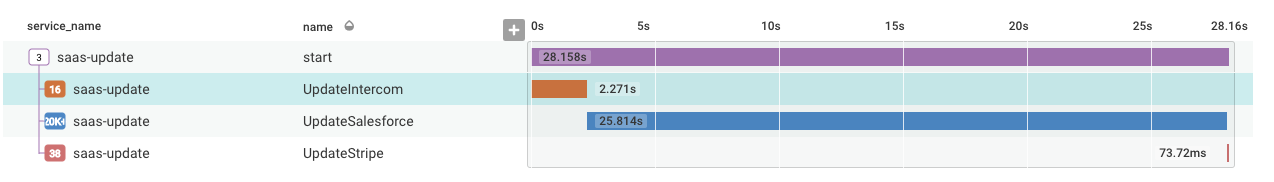
Hm, we should probably enhance the SOQL queries we are using there. 😂
Getting into custom details
Being able to see which portion of a program is slow is useful, but it's just the beginning. You might have noticed above that if any portion of the program returned an error, we called beeline.AddField to add the err as a custom field on the generated span. This can be used throughout our program to gain a super high resolution view into your systems and rapidly churn through questions about what's happening using our blazing fast query engine. The real power of Honeycomb blooms with the more detail that you add - and there are no limits on things like cardinality like there are with metrics, so you can add any detail you want, even stack traces or full response bodies.
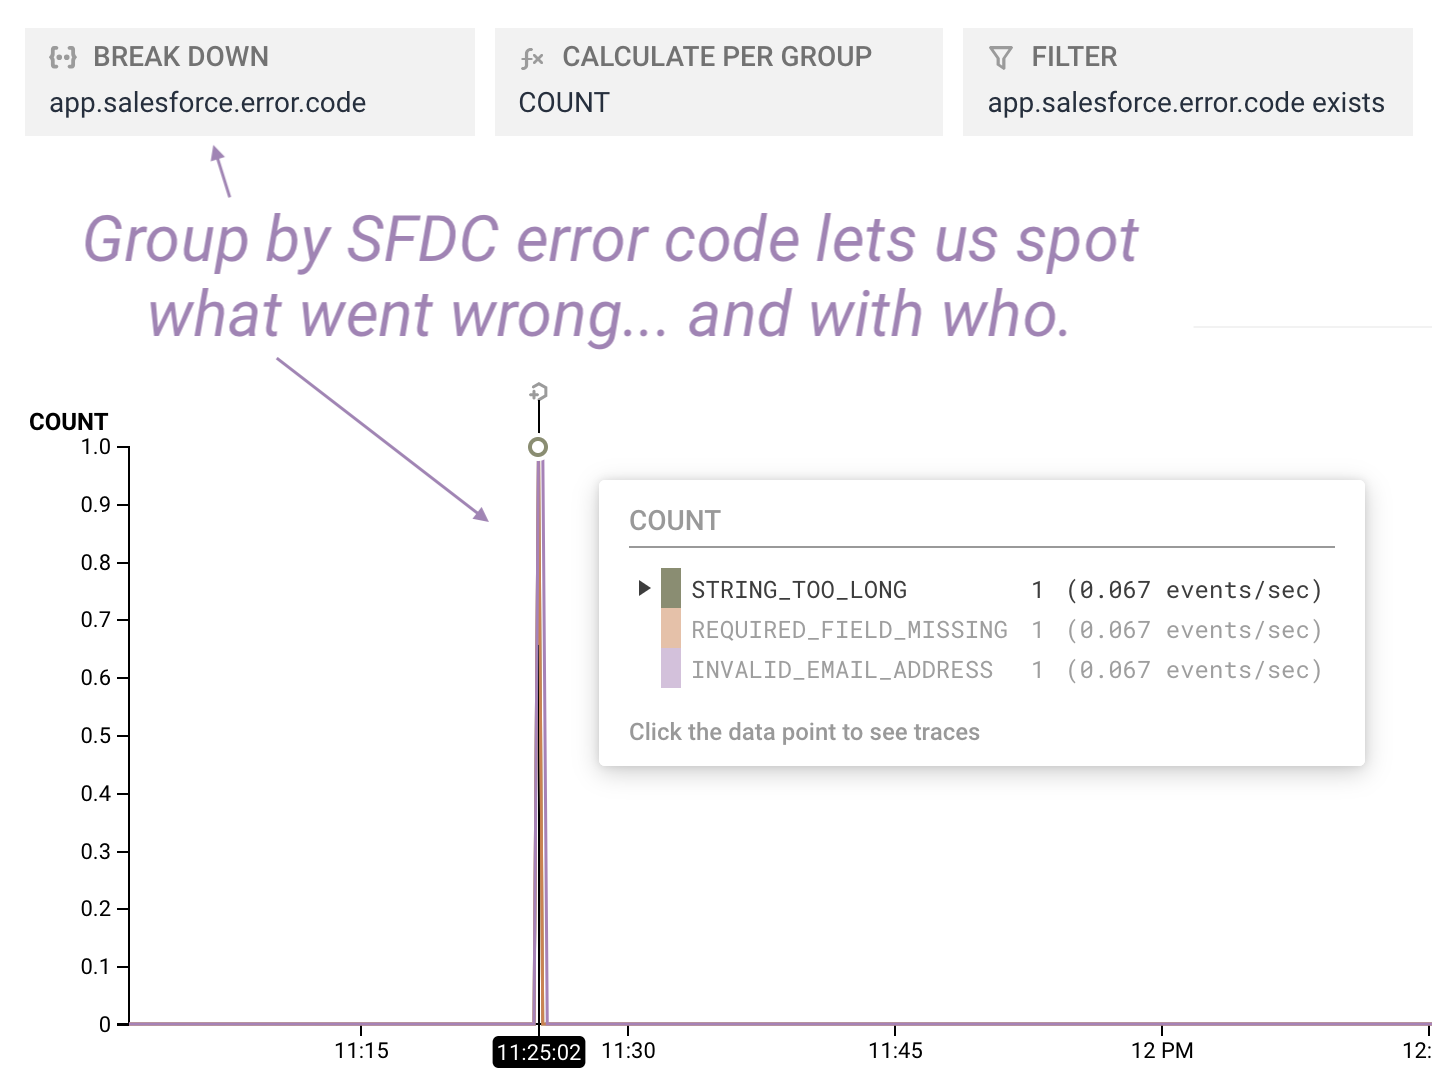
This detail is invaluable for troubleshooting. For instance, we might want to analyze what's happening with a particular user based on their email later on.
beeline.AddField(ctx, "salesforce.user_email", email)
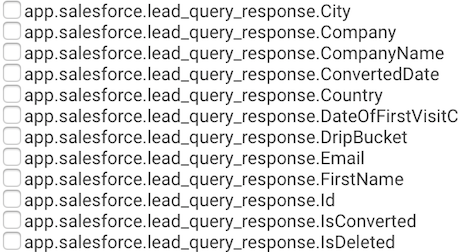
In some cases, we can just Add a whole struct, such as one representing the result of a SFDC API response, giving us access to a huge variety of fields to potentially query over.
Analyzing granular traces
We can, of course, dig in to one portion of the trace in more detail if needed to understand what has happened in the subsection of executing this program that's relevant.
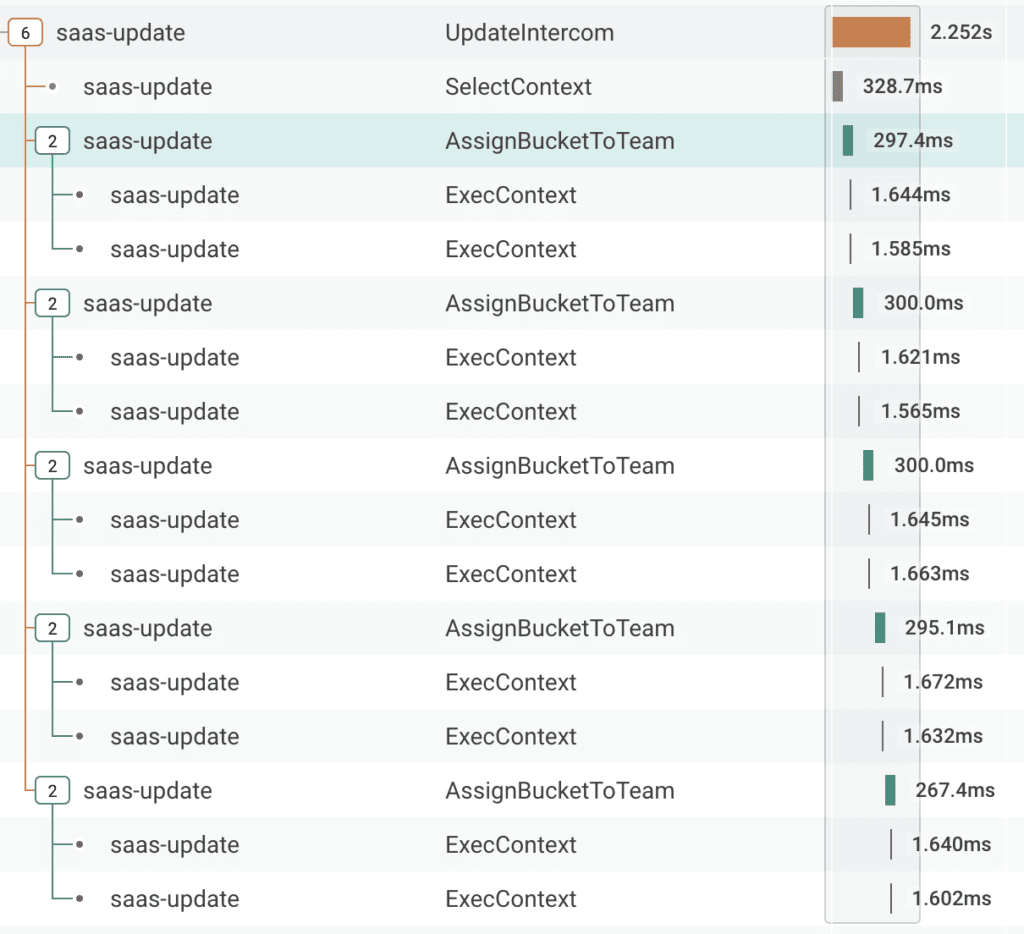
For instance, take a look at the split out Intercom portion. Our program determined that five users needed their information updated, and we can see each step of updating a user as its own sub-section of the trace, including the MySQL queries we executed during those steps due to our use of the sqlx automatic instrumentation that the Go Beeline provides out of the box. Clicking any span in the trace will allow us to see the custom fields associated with that span in the sidebar.
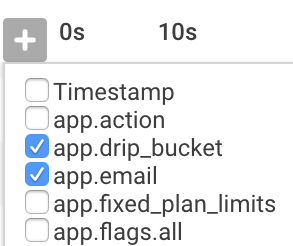
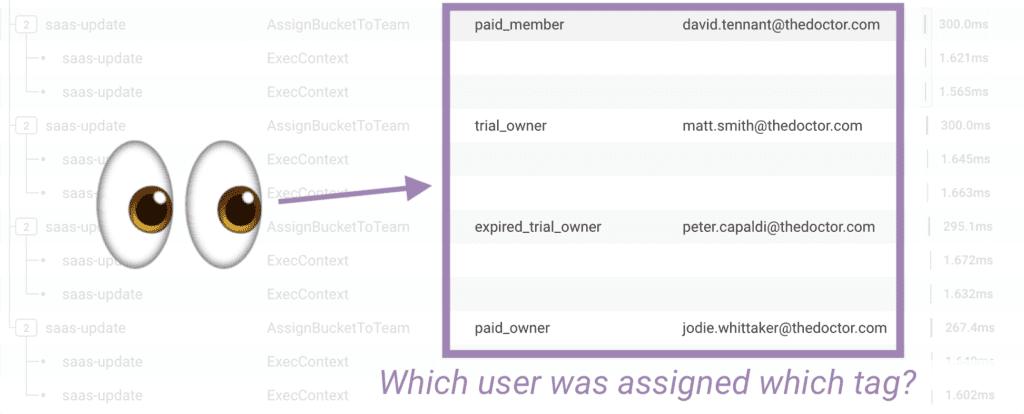
By using the little + sign at the top of the trace view menu, we can select custom fields that we want displayed in the trace - and visualize what's happened in the program in even more detail.
Guess less, ship more.
This kind of unprecedented observability into all of your app, including the all-too-often unloved background jobs, makes Honeycomb a slam dunk for allowing your team to guess less at what's happening and spend more time shipping software. Sign up for a Honeycomb trial today to try it out. We're always happy to answer any questions you have at sales@honeycomb.io as well.
Related Posts
Introducing Relational Fields
Expanded fields allow you to more easily find interesting traces and learn about the spans within them, saving time for debugging and enabling more curiosity...
Real User Monitoring With a Splash of OpenTelemetry
You're probably familiar with the concept of real user monitoring (RUM) and how it's used to monitor websites or mobile applications. If not, here's the...
Transforming to an Engineering Culture of Curiosity With a Modern Observability 2.0 Solution
Relying on their traditional observability 1.0 tool, Pax8 faced hurdles in fostering a culture of ownership and curiosity due to user-based pricing limitations and an...