When In Doubt, Add More Spans: A Tale of Tracing and Testing In Production
By Rachel Perkins | Last modified on May 2, 2019Recently, Toshok was telling a story about the kind of thing he talks about a lot—improving the performance of some endpoint or page or other. Obviously, we spend a lot of time thinking about how to improve the experience of our users, but what caught my attention this time was that what he was describing sounded like a new kind of testing in production—so I asked him to go into a bit more detail.
So, in this story, Toshok had been wanting to try out some new React stuff. "Shiny!" thought Toshok, and went looking for a good place to rip some old Go templates out and build something new in their place.
The codepaths less-traveled
Typically, when we try out new technologies and functionality, we try it out in our "dogfooding" environment. This is usually a good way to work out the kinks and get something ready for prime time, but as is sometimes the case with internal environments, there just wasn't enough traffic for this particular exercise to be valuable.
So Toshok thought..."What part of the product can I try this out in that won't mess with too many users if it doesn't quite go right? I know....the ADMIN page."
[React-conversion montage goes here:]

After the surgery, there was only a little bit of the old code left. The main part of the page now used a new React-ified codepath to, for example, fetch the user list. Lovely.
[Time passes.]
One fine day, Ben posted a trace into the internal Honeycomb slack. TWENTY FIVE SECONDS to write out /admin/users. That isn't....great.
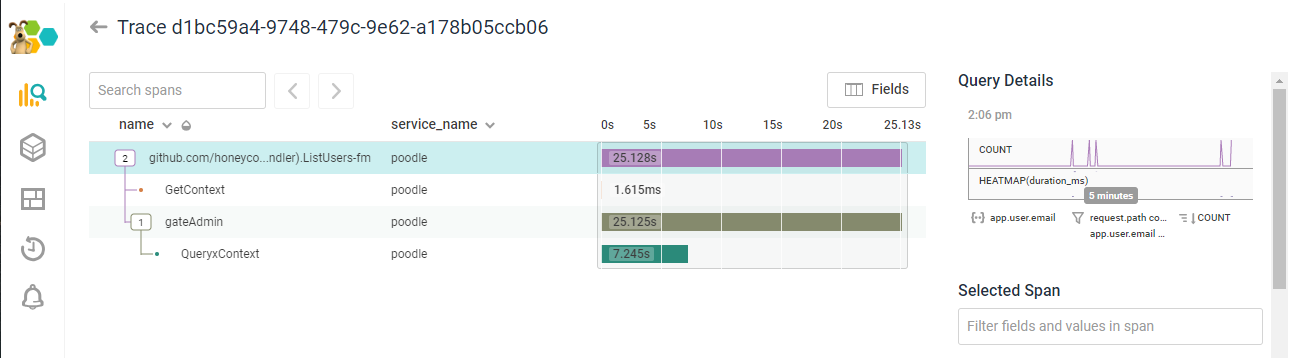
But where Ben saw pain, Toshok saw opportunity. "Well, it's undoubtedly renderJSON. I'll optimize that and add a span to the trace."
But noooope:
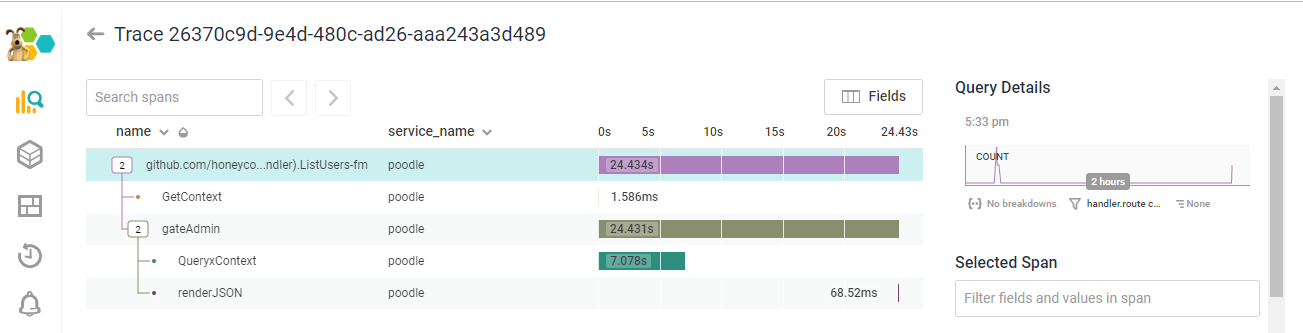
"OK, FINE," said Story Toshok, "I'll propagate the Go context down through to the methods that were calling the DB, and get spans back for /those/ calls too...." A short time passes. "Hey wait--the code is calling two methods that hit the DB in a loop. Per user. That is..." [does math] "..way too many queries."
Another hasty round of context propagation later:
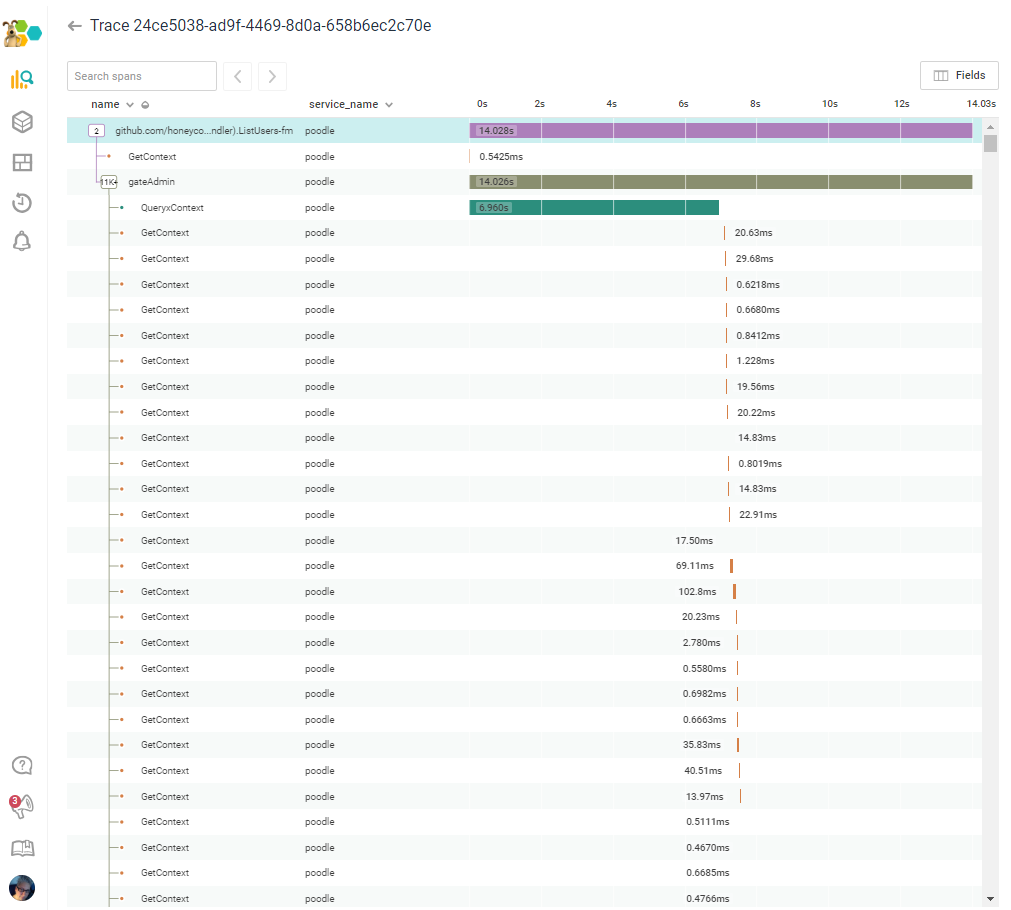
[...and on for several thousand more rows...]
"So yeah--essentially a sloppy copy/paste--and worse, we're not even rendering that data on the Admin page! FACEPALM."

[Interlude to remove those fields/calls.]
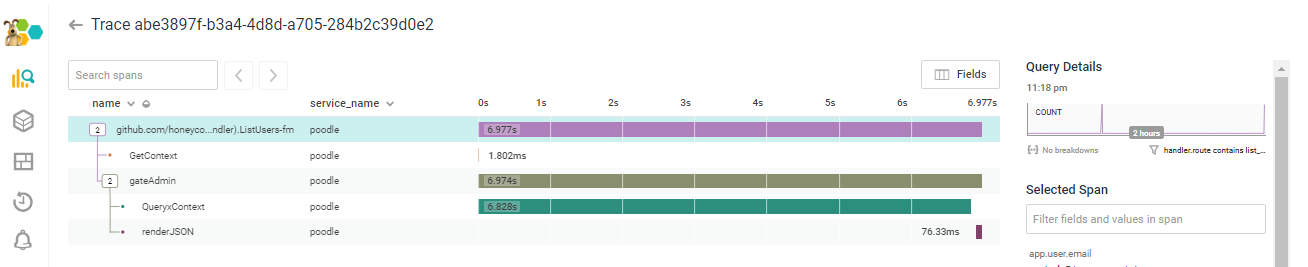
"After I was done facepalming...I got the load time down to 7 seconds. There endeth the lesson (that many of us have to learn more than once): Make sure you're optimizing the right thing before you write code."
Want to make sure you're optimizing the right thing? Honeycomb gives you the observability you need to iterate faster and get to the answer sooner. Sign up for a free trial!
Related Posts
What Is Application Performance Monitoring?
Application performance monitoring, also known as APM, represents the difference between code and running software. You need the measurements in order to manage performance....
Where Does Honeycomb Fit in the Software Development Lifecycle?
The software development lifecycle (SDLC) is always drawn as a circle. In many places I’ve worked, there’s no discernable connection between “5. Operate” and “1....
How We Leveraged the Honeycomb Network Agent for Kubernetes to Remediate Our IMDS Security Finding
Picture this: It’s 2 p.m. and you’re sipping on coffee, happily chugging away at your daily routine work. The security team shoots you a message...