Observable Frontends: the State of OpenTelemetry in the Browser
By Jessica Kerr | Last modified on April 27, 2023The modern standard for observability in backend systems is: distributed traces with OpenTelemetry, plus dynamic aggregations over these events. This works very well in the world of web servers. But what about the web client?
This post describes the state of OpenTelemetry support for React web clients, as of early April 2023. If you’re looking for a how-to, there’s a shorter post here.

Frontend and backend
Frontend development was once considered simpler than backend work. Maybe that was true a long time ago. These days, complexity is rich in the client. My backend services run in the cloud out of reach, but my web client runs on every home computer and phone and devices I’ve never heard of. Backend software may have many interconnections, but the frontend deals with user input—everything is simultaneous and full of surprises.
The modern standard of distributed traces is pretty great for the backend. Can we have something just as good in the frontend?
“Frontend” includes web and mobile clients, plus potentially desktop applications. Support varies. We gotta start somewhere, so let’s go with a common scenario: a web client using React.
The OpenTelemetry demo app, which is built as an example of how to use OpenTelemetry in various languages, includes a React web client. It uses automatic instrumentation, brought in by the auto-instrumentation-web package. What information does it get?
Document Load
First, there’s the Document Load automatic instrumentation (npm, github). This gives an analysis of page load time.
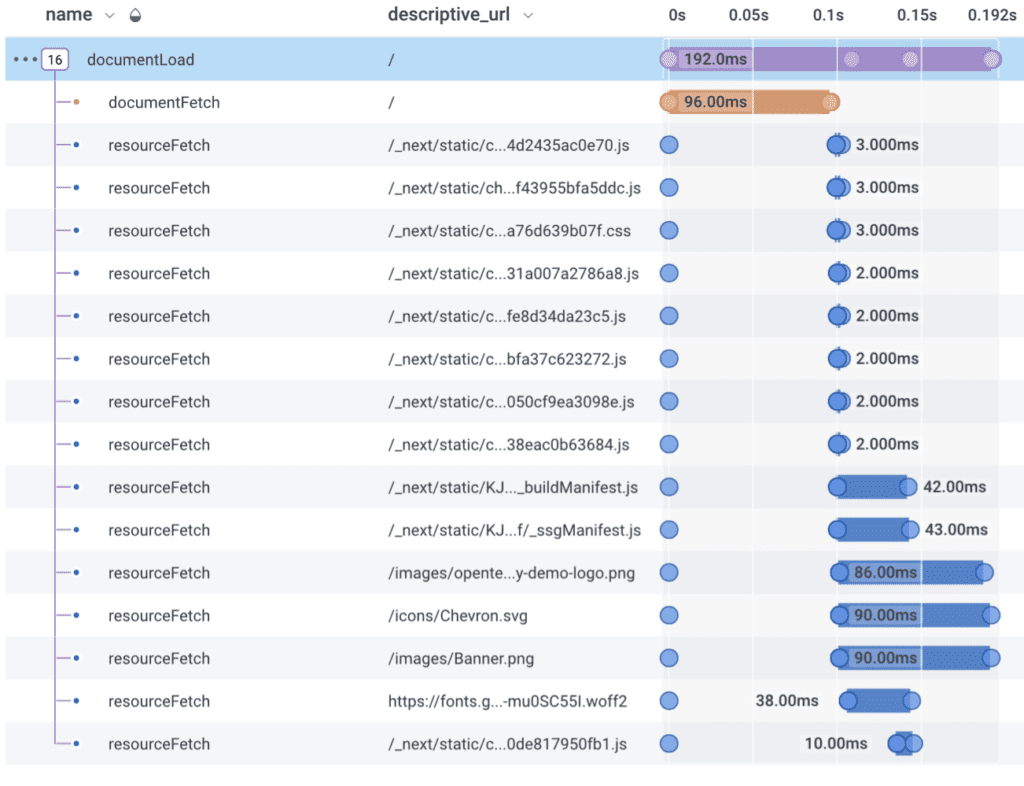
The trace emitted by Document Load shows that it took 0.19 seconds to load this page. Each resource fetched gets its own span, showing how much time each took and which ones were fetched in parallel. This looks useful.
In addition, each resource fetch span has some span events, represented as circles on the waterfall above.
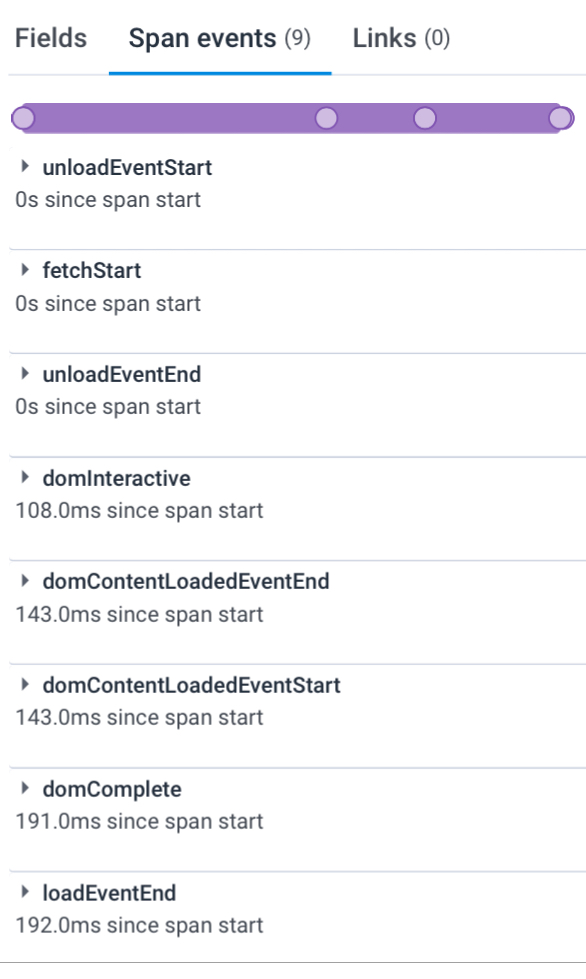
Each one has nine span events. Nine! Each has a name, a timestamp, and a bunch of fields that are common to every event in the trace. That’s very chatty. This single document load produces 17 spans and 153 span events, a total of 180 OpenTelemetry events. It will be lovely if the verbosity becomes configurable.
Fetch
After pageload, when JavaScript in the client triggers a trip to the backend, we get a span. There are two automatic instrumentations for this: one package for the browser’s Fetch API (npm, github), and one package for the older XML HTTP Request (github).
This instrumentation does propagation: it adds the trace context to the HTTP headers, so the backend receiving the request can continue the trace that started in the browser.
In the pictured trace, the top span is from the browser. The next span is from the backend. This shows that the browser experienced 423ms of latency, while the backend only had the request for 22ms. That’s a lot of network time! Good thing this is a demo app.
By default, the instrumentation will add the trace context to HTTP headers on all requests to the page’s endpoint. You can change this—to never add it, or to add it for additional backend URLs—by setting the `propagateTraceHeaderCorsUrls` property in its configuration. This isn’t documented (today) in the package’s documentation, only in blog posts.
User interaction
We can also get spans when the user interacts with the page, like when they click on something important. This instrumentation (npm, github) is even more experimental than the others, and I found it unpredictable.
Configure it with the events you want to receive:
`eventNames: ['submit', 'click', 'keypress'],`
Theoretically, it will create spans when those events occur. Not every click in the world, but clicks on a page element that responds to clicks… and some other clicks. I haven’t figured out the criteria. I also have yet to see a ‘keypress’ or ‘submit’ event in the demo app.

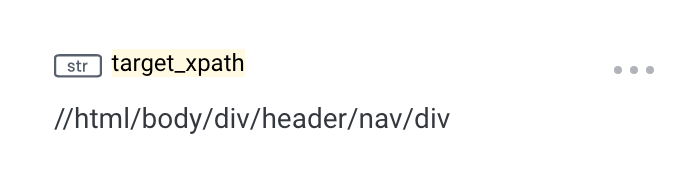
There it is, a trace created when I click a button. What button? By default, the only clue I get is its location in the DOM. The xpath of “//html/body/div/header/nav/div” doesn’t speak to me.
To get more information, there’s a function we can supply to the configuration that lets us add information from the element to the span. It’s called `shouldPreventSpanCreation`.
I suppose you can also use it to prevent span creation.
When I pass in something like this:
shouldPreventSpanCreation: (eventType, element, span) => {
           span.setAttribute('target.id', element.id);
           span.setAttribute('target.className', element.className);
           span.setAttribute('target.html', element.outerHTML);
         },
Then the className, outerHTML, and id of the element appear on the span.
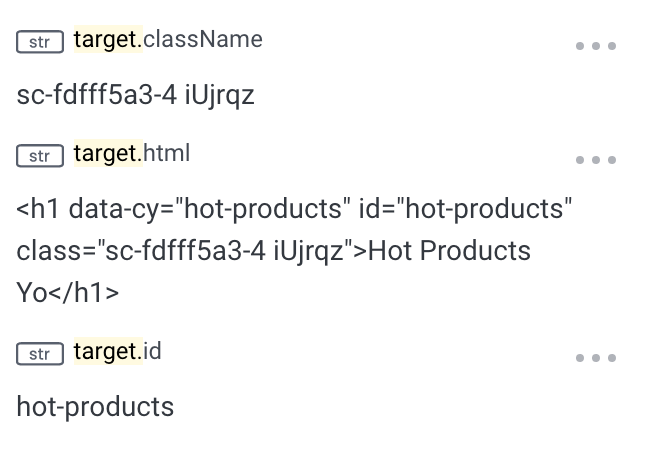
Once I add `id` properties to the buttons, then I can easily see what was clicked. Until then, I can stare at the outerHTML and figure it out.
Knitting these together: ContextManager
So far, the user-interaction and fetch-resource traces are independent. I'd like to see a trace that starts from a click and contains the request spans that were triggered by the click.
I want it to look like this: That trace shows a click on “Add to Cart” that triggers two requests to the backend: a POST and then a GET.
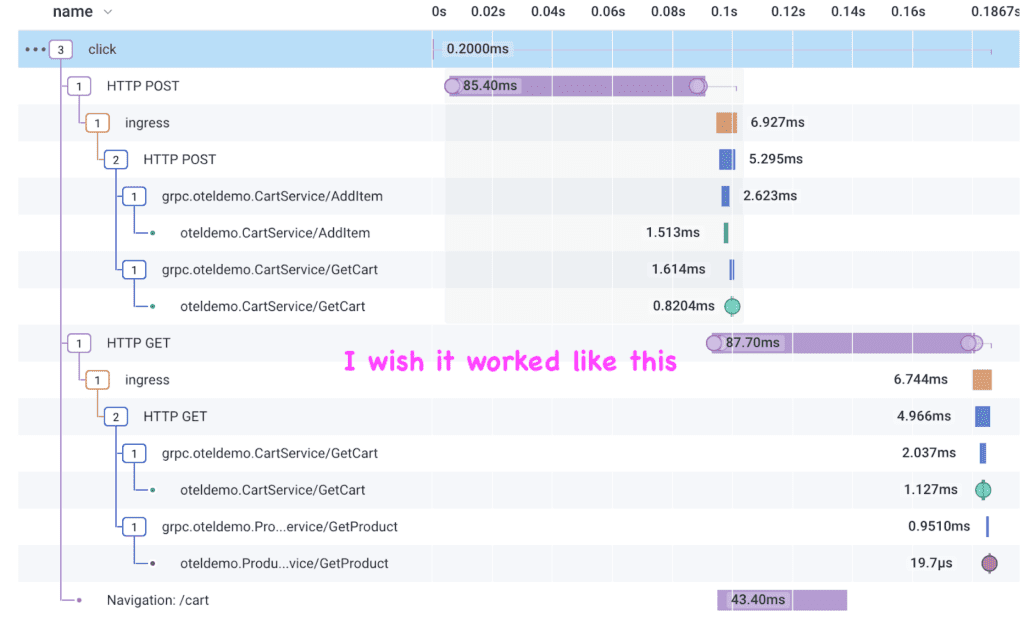
I created that trace by manually passing the context along in a way I cannot recommend. Also, the final span was added by some custom implementation in the OpenTelemetry demo code. It reveals that after I clicked “Add to Cart,” the app navigated to /cart.
This kind of trace contrasts what the automatic instrumentation shows, which is: clicks and requests as separate traces.
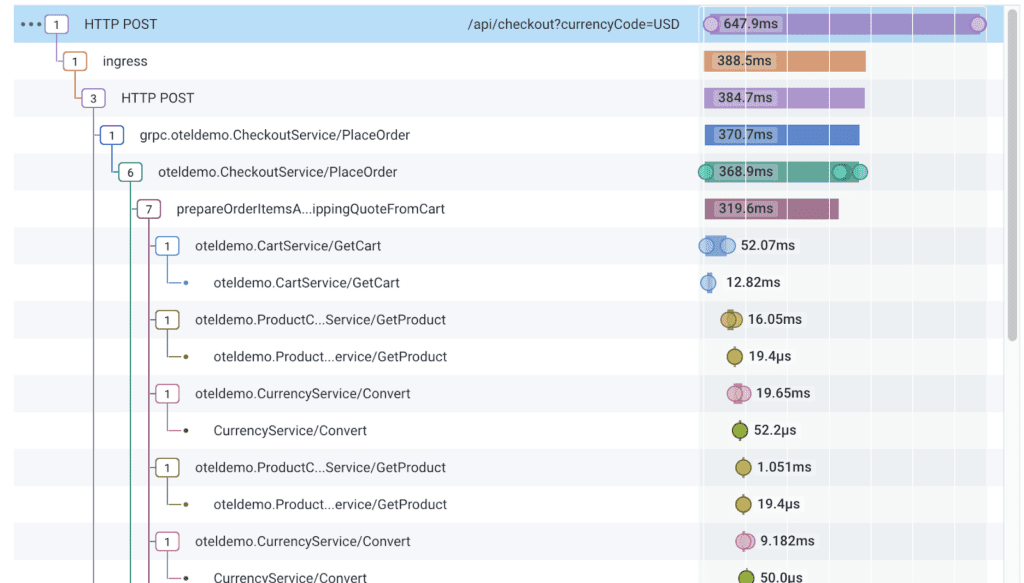
Here’s when I click placeOrder:

And here’s the request going to the backend. One span from the client, and the rest are in the backend:
When that request is made to the backend, the fetch instrumentation creates a span; that span will be part of the trace in the current active Context. So far, the request spans have started their own trace, because that Context is not populated. If only the ‘click’ span was still the active Context, then the request would be part of the same trace!
OpenTelemetry implements this with a ContextManager
The ContextManager traces the thread of execution, so that as functions are called and asynchronous operations are initiated, they know what span triggered them. In Node, the language has facilities that a ContextManager can plug into, and so backend traces follow the whole execution of a web request. In the browser, options are limited.
There is one ContextManager available to us: ZoneContextManager. It uses the Zone.js library (used by Angular). Zone.js patches Promise and setTimeout so that asynchronous execution is tracked. This helps sometimes; I can make some asynchronous calls and get a trace.
Here’s one that makes no sense, but I promise, it tracks some asynchronous execution:

The trace about bananas let me prove to myself that the ZoneContextManager does something. However, React uses its own facilities to track functions that need to run, so that context gets lost sometimes. Most of the time. I saw it work once, in the most basic create-react-app, but never saw it in the more-realistic OpenTelemetry Demo app.
I wish we had a ContextManager that worked with React, so that we could trace causality. However, I suspect this would require changes in React itself.
Session ID
The separate traces for clicks and requests can be tied together by session, but that doesn’t happen automatically with the instrumentation.
Whatever kind of Session ID your application uses, add it to every span. You can do this by configuring each automatic instrumentation library: for instance, the fetch instrumentation lets you pass a function as `applyCustomAttributesOnSpan`. Or, you can create a SpanProcessor that modifies each span as it goes out, as demonstrated in the OpenTelemetry Demo app.
Then, in Honeycomb, I can list all the traces by session, revealing a sequence of user interactions and requests to the backend.
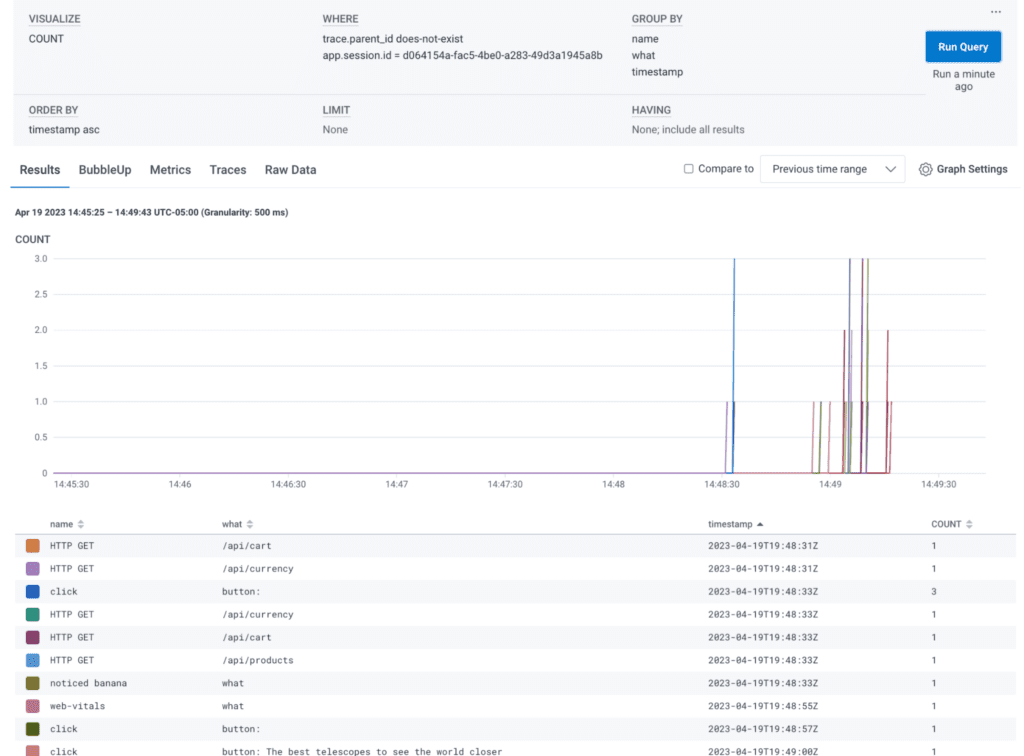
Note: Some of the fields here are derived columns that I defined.
Conclusion
For a React web application, the automatic instrumentation is not as good as what we have in the backend. There are clear shortcomings like the lack of connection between clicks and the requests they caused.
For other client applications, the automatic instrumentation is different. Yet, “React web application” is the most common case.
Then there are the deeper questions: What really is a trace on the frontend? Is it an entire session? Everything a user does with one page? Or a single interaction like a click? The current concept and structure of distributed traces fit the backend request-response cycle very well. I suspect we need something more to describe client execution.
Fortunately, there is ongoing work on this within OpenTelemetry. If you would like to contribute your opinions, pop in to the Client-side Special Interest Group or the End User Working Group. The community calendar lists their next meetings, and everyone is welcome.
Or discuss this with me and others in the Honeycomb Pollinators Slack. I’d love to hear what you think.
Related Posts
Introducing Relational Fields
Expanded fields allow you to more easily find interesting traces and learn about the spans within them, saving time for debugging and enabling more curiosity...
Real User Monitoring With a Splash of OpenTelemetry
You're probably familiar with the concept of real user monitoring (RUM) and how it's used to monitor websites or mobile applications. If not, here's the...
Transforming to an Engineering Culture of Curiosity With a Modern Observability 2.0 Solution
Relying on their traditional observability 1.0 tool, Pax8 faced hurdles in fostering a culture of ownership and curiosity due to user-based pricing limitations and an...