The New Rules of Sampling
14 minute read
It is not feasible to run an observability infrastructure that is the same size as your production infrastructure. Past a certain scale, the cost to collect, process, and save every log entry, every event, and every trace that your systems generate dramatically outweighs the benefits. The question is, how to scale back the flood of data without losing the crucial information your engineering team needs to troubleshoot and understand your system’s production behaviors?
Starting at the highest level, there are three ways to approach the problem:
- Measure fewer things: Focus is good, and it’s certainly possible that you’re tracking some things that aren’t directly critical to your business outcomes, such as noisy debug logs. Once the low-hanging wastage has been eliminated, further reducing the coverage of your telemetry overall is not usually desirable. Measuring less means lower fidelity overall.
- Send aggregates (metrics): Your business needs a high-level view of your systems, and you should be using dashboards as a starting point before diving into the individual events and traces that generate them. That said, pre-aggregating the data before it arrives into your debugging tool mean you simply can’t dig in any further than the granularity of the aggregated values. The cost in terms of flexibility is too high.
- Sample: Modern, dynamic approaches to sampling allow you to achieve greater visibility into the most important parts of your infrastructure while maintaining the benefits of transmitting only a portion of your volume to your instrumentation service. Collapsing multiple similar events into a single point, while retaining unusual behavior verbatim enables you to get more value out of each incremental amount of telemetry data.
So what do we mean by sampling, anyway?
The goal of sampling is to identify and retain a subset of your data that represents the larger population of data as accurately as is necessary to allow you to answer important questions about your business, while reducing the cost of processing the data overall. Typically, people think of sampling as completely random—and if all you have available is the knob of “percentage of the total stream of data,” then you do want that sampling to be random, to avoid actively biasing your data. We call this ‘constant sampling’, in that you’re sampling at a constant level, no matter what the data looks like—this is the option available in most metrics, tracing, and logging products (if one is available at all).
The advantage of this approach is that it is simple and easy to implement. You can easily reduce the load on your analytics system by only sending one event to represent many, whether that be one in every four, hundred, or ten thousand events.
The disadvantage of constant sampling is its lack of flexibility. Once your sample rate is chosen, it is fixed. You will be unable to debug outliers, such as 99.9th percentile latency values, since they are unlikely to both occur and be randomly chosen for sampling. Constant sampling is only a good choice if your traffic patterns are homogeneous and constant. If every event provides equal insight into your system, then any event is as good as any other to use as a representative event. The simplicity allows you to easily cut your volume.
But all traffic isn’t equal, and sampling doesn’t have to ignore the fact that you care about some kinds of traffic a lot more than others. In general, you care more about:
- what happens rarely vs. what happens a lot
- writes vs. reads
- errors vs. successes
- metrics relevant to your specific business vs. generic volume or resource counters
and so on.
How can I sample and not miss what's important?
The basic idea of constant sampling is that if you have enough volume, any error that comes up will happen again and if it’s happening enough to matter, you’ll see it. But if you have a more moderate volume (and different business requirements), you need more knobs to turn to maintain the statistical likelihood that you still see what you need to see. For example,
- What if you care a lot about error cases (as in, you want to capture all of them that aren’t duplicates) and not very much about success cases?
- What if some customers send an order of magnitude more traffic than others—but you want all customers to have a good experience?
- What if you want to make sure that a huge increase in traffic on your servers can’t overwhelm your analytics backend?
For these situations, you need dynamic sampling options.
Dynamic sampling
When considering how dynamic sampling works, it helps to think of the data in terms of the kinds of events a given event represents, vs the sample rate. For example, instead of thinking “this data is sampled at a rate of 4:1 (four events discarded to one event kept)” try looking at it as: “this event represents four similar events.”
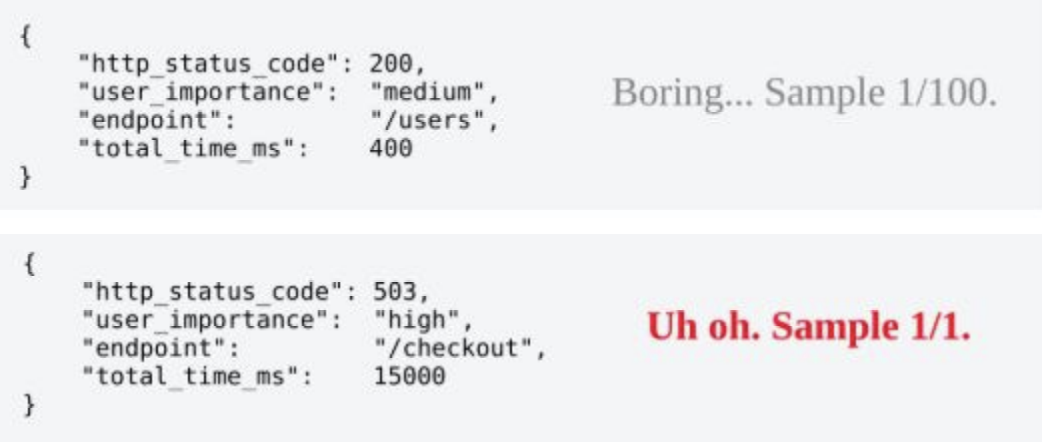
Another way to think about it: dynamic sampling allows you to compress similar events down, things like your successful load balancer health checks, all those 200s…you don’t need all of those. Instead, you can improve your response time by compressing away these extra, useless events. What you do want to know about is when a real person hits an edge case failure. To do this, Honeycomb offers the following approach, described here in two stages:
Dynamic sampling part 1: based on event content (keys)
The first part of the dynamic sampling approach is to tune your sample rate based on what’s in the event. At a high level, this means choosing one or more fields in your set of events and designating a sample rate when a certain combination of values is seen. For example, you can partition events based on HTTP response codes, and assign sample rates to each response code. This way, you can specify that errors are more important than successes, or newly-placed orders are more important than checking on order status, or paying customers are more important than those on the free tier. You now have a method to manage the volume of data you send to your analytics system while still gaining detailed insight into the portion of the traffic you really care about.
You can make the keys as simple (such as HTTP status code or customer ID) or complicated (for example, concatenating the HTTP method, status code, and user-agent) as is appropriate to select samples that can give you the most useful view into the traffic possible.
Sampling at a constant percentage rate based on event content alone works when the key space is small (there aren’t that many HTTP status codes) and when the relative rates of given keys stay consistent–for example, when you can assume errors are less frequent than successes.
However, sometimes the key space varies in ways you can’t predict ahead of time–what then?
Dynamic sampling part 2: based on the recent historical volume of traffic for a given key
When the content of your traffic is harder to predict, you can take the next step: identify a key/combination of keys for each incoming event as before, then also dynamically adjust the sample rate for each key based on the volume of traffic recently seen for that key. Using this approach, you can start thinking of heuristics that will let you decide what’s interesting about your data. In-house at Honeycomb, we use things like the number of times we’ve seen a given key combination (such as [customer ID, dataset ID, error code]) in the last 30 seconds. If we see a specific combination many times in that time, it’s less interesting than combinations that were seen less often, so we have configured dynamic sampling to allow proportionally fewer of the events to be propagated verbatim, until that rate of traffic changes and it adjusts the sample rate again.
Combining dynamic sampling options
To make these kinds of decisions for your business, you need to look at the traffic flowing through a service, as well as the variety of queries hitting that service. Is it a front page app where 90% of the requests hitting it are nearly indistinguishable from one-another? Is it a proxy fronting a database where many query patterns are repeated? Is it a backend behind a read-through cache, so each request really is mostly unique (with the cache