Effective Trace Instrumentation with Semantic Conventions
There’s plenty of literature on the mechanics of instrumenting code with OpenTelemetry and delivering it to Honeycomb. However, I’ve not found many guides on the craft of instrumenting code in order to have a good observability experience in your system. A lot of focus is placed on automatic instrumentation—which is great, particularly if you’re new to observability or retrofitting—but it misses the power of good instrumentation at the application level.

By: Jeremy Blythe

This post was written by Jeremy Blythe, VP Engineering at evertz.io.
There’s plenty of literature on the mechanics of instrumenting code with OpenTelemetry and delivering it to Honeycomb. However, I’ve not found many guides on the craft of instrumenting code in order to have a good observability experience in your system. A lot of focus is placed on automatic instrumentation—which is great, particularly if you’re new to observability or retrofitting—but it misses the power of good instrumentation at the application level.

A useful guide is the OpenTelemetry documentation for libraries. You can take a lot of what is presented there and apply it at the application level. Arguably, the line between libraries and services or microservices is pretty blurred. When calling a library within the same process, there can be an expectation that that library is instrumented. What if I’m calling another service or microservice? That’s kinda like a library over the wire. OK, not exactly, but that mental model adds to the justification for full-stack, high-quality instrumentation.
Know your audience
It’s important to keep in mind who your users are. There are two “user interfaces” to an application: the frontend that your customers interact with and the internal backend view. Depending on the size of your organization, there may be multiple groups or roles using this view: developers on your team, developers on other teams, test engineers, SRE, product management, customer success, etc.

Consistency and commonality is key, particularly in microservice applications where there’s strong independence between teams. Good user interface design has common naming and themes. A poor shopping site experience would alternate between “Add to cart,” “Add to basket,” and “Add to bag.” Similarly, telemetry attributes referring to the same thing should be consistently named across the application. Distributed tracing chains together independently instrumented services making inconsistencies particularly jarring.
OpenTelemetry’s Semantic Conventions provide a global set of common attributes:
The benefit of using Semantic Conventions is in following a common naming scheme that can be standardized across a codebase, libraries, and platforms.
This should be your first port of call. However, the vast majority of your instrumentation will be domain-specific. Well-defined domain-specific Semantic Conventions are a great documentation source and help to avoid polysemes. Following the OpenTelemetry syntax allows you to use the same documentation and code generation tools. Should every attribute be a Semantic Convention? No! That’s way too much overhead. Most attributes will be service-specific. That’s not to say that these might benefit from being documented, just that you don’t want it to get in the way. It’s important not to discourage the use of attributes by creating more friction.
Namespaces
Our microservice application runs in AWS, so inevitably, we use S3 a lot. An S3 bucket is a common thing and, sure enough, there’s a global Semantic Convention attribute aws.s3.bucket. This seems like an obvious natural name, and it is—but it’s also part of a family of attributes.
The part before bucket is the prefix or namespace aws.s3. Dot notation is used to provide namespace hierarchy. You’ll find key under aws.s3 and also aws.dynamodb.index_name defining an attribute under a branch from the top level aws namespace. It’s important to understand the intention of dot notation in attribute names even if you don’t use Semantic Conventions.
Naming things is hard
Before seeing the light with Semantic Conventions, these are some of the variations we had across our microservices: aws.s3.bucket.name, aws.s3.bucket, bucket, s3.bucket, bucket.name, aws.s3.bucket_name, s3.bucket.name. Imagine trying to find which microservices use a particular bucket by querying across datasets!
Types
By not understanding the intention of attribute names, you also get things like cache.bucket and backup.bucket_name. This is an all too common issue, often caused by taking some JSON, a code path, class, or struct and serializing its fields to attribute names.
struct Request {
    bucket_name: String,
}For example, there is a temptation to take the value from the bucket_name field of the Request struct above and name the attribute request.bucket_name. But attribute names should express the type of the attribute value, not its context or usage. It’s about what it is, not where it is.
struct AwsS3Bucket(String);
struct Request {
    bucket_name: AwsS3Bucket,
}Concepts like the New Type Idiom provide stronger type guarantees and create a common type language. By aliasing String to AwsS3Bucket, we can more accurately express the semantic intent of the bucket_name field. It’s not just some bytes that you can do text manipulation on, it is representing specifically an AWS S3 bucket. Similarly, naming our attribute aws.s3.bucket expresses that this is an S3 bucket in AWS.
Adjacent attributes
So we’ll use the type and make aws.s3.bucket = some_bucket. Great! However, we’ve lost the useful information that it was used in a request. Fortunately, attributes are contained in named spans or span events. We can add additional attributes to the span to indicate it is a request. Perhaps Request is an rpc call, in which case we could add rpc.method, another global Semantic Convention. Or maybe this is domain-specific and we create our own myapp.operation attribute name. The point is that all the useful information can be captured in a consistent, strongly typed way. The proximity of these attributes allows for filtering. We can now query across all datasets to find when our bucket was used and then filter or group by operation.
Signal in the noise
Now we know how to name attributes well, but what should we capture? There’s some good guidance in the Observability Engineering book, particularly Chapter 11:
Observability-Driven Development:
Observability is not for debugging your code logic. Observability is for figuring out where in your systems to find the code you need to debug.
The craft of instrumentation can take a while to master. The game is to provide enough information to help with the unknown unknowns without creating too much noise. A common issue is batch processing: if your code is looping through an unbounded list of items, you should think carefully before creating a span for each iteration. Even a span event may make too much noise and cost too much in storage!

Adding Refinery downstream could be used to sample these out, but if you know it’s going to be noisy, find an alternative. Always emit any errors of course, and include detailed state information. Otherwise, consider a single span for the loop with the number of items, any state information, perhaps even an array-type attribute of the item keys or other significant field. Unfortunately, if you are calling an auto-instrumented library for each member of the list, you will still create spans. (If a reader knows how to programmatically disable tracing in a library in this scenario, please tell me how!)
Changes of state
If you’re upping your game with observability-driven development, you will start adding extra code beyond what is passively available at your current scope. For example, your function may create a span with its incoming parameters, passive stuff. If the function makes a change to an in-memory data store, you may want to emit some information about the new state of that store (e.g., sizes, amounts, remaining capacity). Perhaps your code dequeues a task; it may be able to emit the size of that queue.

This is actively writing code with the sole purpose of sending useful information to Honeycomb. It could help answer the four questions that every engineer should be instrumenting for and asking after deployment (see Observability Engineering Ch11):
• Is your code doing what you expected it to do?
• How does it compare to the previous version?
• Are users actively using your code?
• Are any abnormal conditions emerging?
Don’t rely on span names
The span name is useful, but remember this is treated like an attribute called name and generally contains freeform text to identify and differentiate it. Try not to encode too much information into the span name. Provide more attributes to express the context of the span, preferably with common Semantic Conventions.
Use baggage carefully
Core environmental attributes should be repeated on every span (e.g., cloud.region, tenant.id, user.id). These often come from the settings of your service, or perhaps the event to your Lambda function. Repeating commonly filtered-on attributes makes life easier for someone filtering for spans in a specific region for example. Read the article linked above for the benefits and dangers of baggage.
Never encode variables in attribute names
This pollutes the column database (e.g., ec2.i-00feb7d6aa65a8706.instance.name). If you’ve written code to construct the attribute name, you’ve probably done the wrong thing. Attribute names are almost always constants. Consider using array types or span-events for complex structured data. The exception to this rule is template types, where the final part of the attribute name is somewhat variable. An example is http.request.header.<key> where the <key> is, for example, content-type. As the doc says: A template type attribute represents a dictionary of attributes with a common attribute name prefix.
Errors
The special attribute error is used to signify a genuine software error and is typically accompanied by a span-event containing message, exception, and stack-trace information. Avoid using error for non-errors, like using exceptions for flow control or using exceptions to check for data presence.
Tools
The OpenTelemetry build tools project was mentioned earlier. The Semantic Conventions tool helps create markdown and code from your YAML models. I have created a couple of open source tools to help work with semantic conventions across your org:
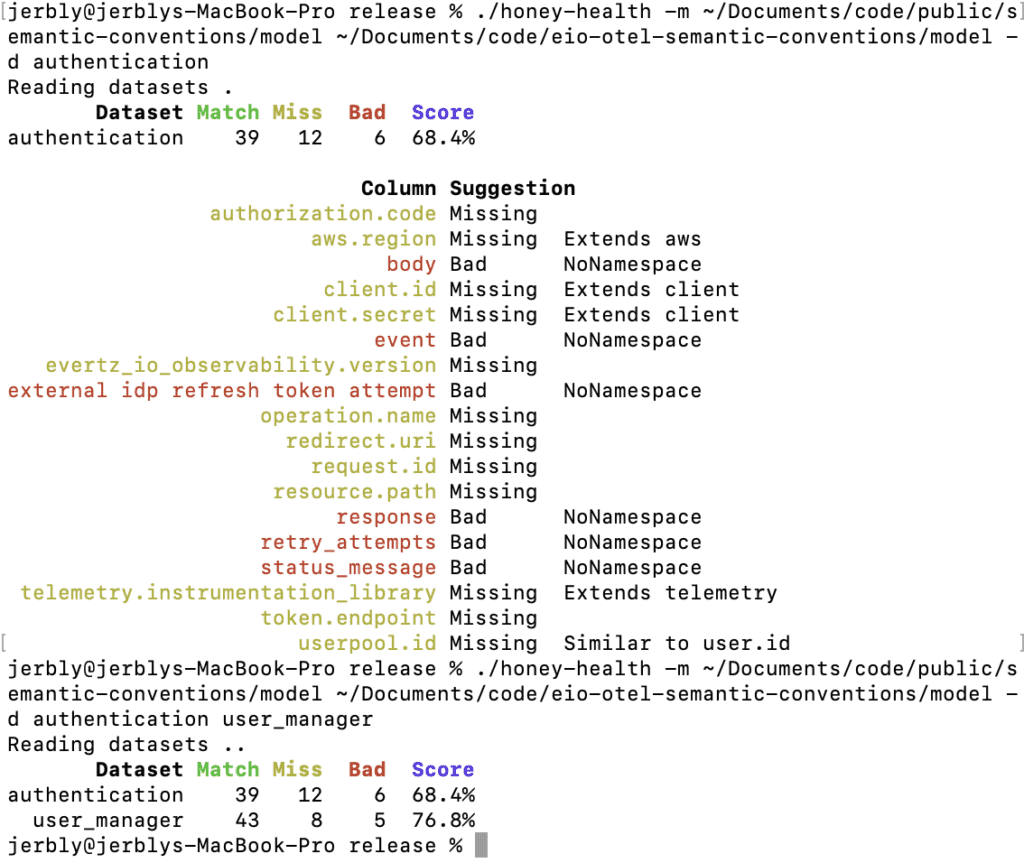
Honey-health
Use this tool to compare the columns (attributes) in your datasets against your Semantic Convention models. You can get detailed information and suggestions for individual (or multiple) datasets. A CSV report file is produced alongside the command line output when you select more than one dataset for analysis. See the README for more info.
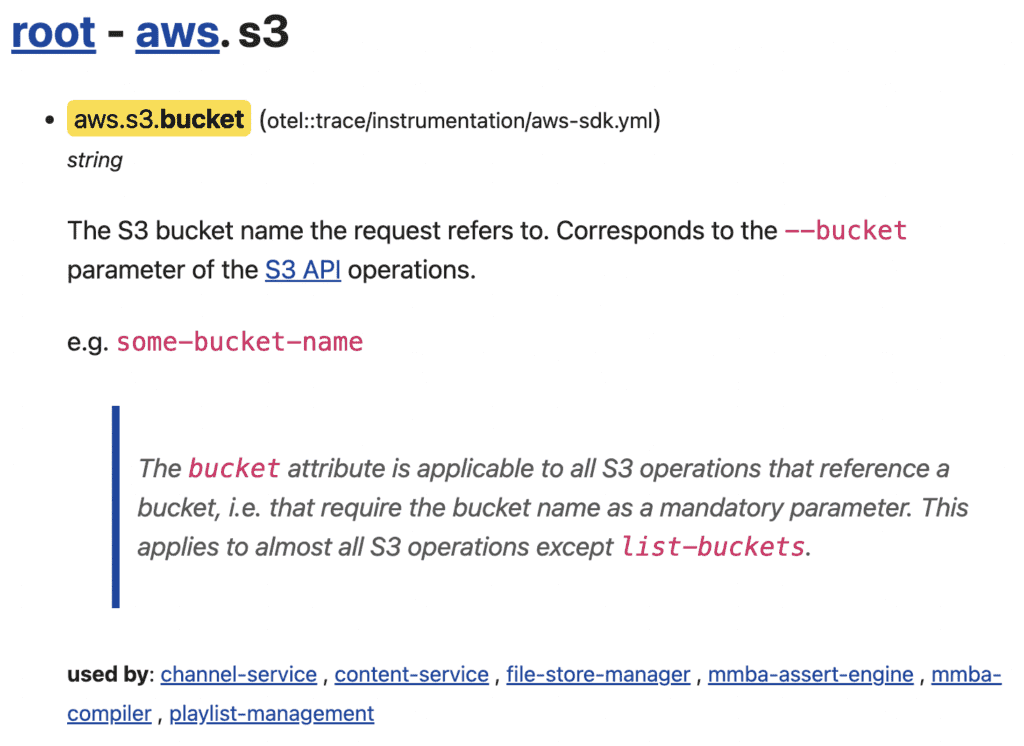
Honey-explore
The generated markdown documentation you get from the OpenTelemetry Semantic Conventions build tool is nice, but it’s a bit disconnected from the namespace tree. Honey-explore creates an aggregated tree user interface from all the models you provide it. Every leaf node shows the documentation from the YAML definitions and a list of the Honeycomb datasets that have written that attribute recently. Clicking a dataset name will take you to the Honeycomb UI with a group by query over that attribute on that dataset.
Conclusion
Honeycomb provides a powerful service to search over high cardinality attributes. Semantic Conventions provide a consistent way to define these attributes, creating a common language within and across organizations. Using the guidance and tools in this article can improve your observability experience company-wide—particularly where there is strong independence between development teams.
Want to know more?
Talk to our team to arrange a custom demo or for help finding the right plan.