Frontend Debugging Is Bad and it Should Feel Bad
There’s a sentence that strikes fear into the heart of every frontend developer I’ve ever met: Users are reporting issues, and we don’t know how to replicate them. What do you do when that happens? Do you cry? Do you mark the issue as wontfix and move on? Personally, I took the road less traveled: gave up frontend engineering and moved into product management (this is not actually accurate but it’s a good joke and it feels truthy).

By: Winston Hearn


It’s 2025, The Frontend Deserves Observability Too
Learn MoreThere’s a sentence that strikes fear into the heart of every frontend developer I’ve ever met: Users are reporting issues, and we don’t know how to replicate them. What do you do when that happens? Do you cry? Do you mark the issue as wontfix and move on? Personally, I took the road less traveled: gave up frontend engineering and moved into product management (this is not actually accurate but it’s a good joke and it feels truthy).
What’s the best way to debug frontends?
Alas, most of the options above aren’t realistic (we can’t all just quit frontend and move on to less buggy pastures). What you should do is gather as much info as you can and start investigating:
- Where on the site (or app) is the issue?
- What browser was used?
- What kind of device?
You get as much context as you can, then you open your app locally in a browser and try whatever you can think of to replicate the issue. If the issue is in an area of code you’re super familiar with and have a strong mental map of, this process may be relatively quick (an hour or two). If it’s a particularly gnarly bug, or an area of your app that you haven’t worked with much, this throw-spaghetti-at-the-wall-until-it-sticks process may take days.
Success! …success?
If you figure out how to replicate an issue, you can take advantage of your browser tools to understand it and identify a solution. But once you ship it, how exactly do you confirm the solution worked? Does that require the reverse chain of reaching out to whoever first heard about the issue and asking them to verify with the users that the issue is gone?
I worked as a frontend engineer for almost a decade. As a PM here at Honeycomb, I talk to frontend engineers regularly and have confirmed that this is the general state of things. Debugging frontend issues is time-consuming, extremely frustrating, and if you do find and ship a potential solution, verifying that the solution works is a painful process in itself.
This is a terrible way of doing things. The frontends of our services—websites, web apps, and mobile apps—are the core interface that our customers and users interact with. If they have bugs or poor usability, all the business outcomes we’re working to enable suffer.
Why is it so hard to debug and improve broken frontends?
I believe it’s because frontend developers generally don’t know about observability—or maybe only know it in the context of the backends they interact with. Observability, however, is not limited to a single domain. It’s a practice that any development team can pursue, including frontend teams.
Observability (sometimes abbreviated as o11y) is the ability to measure and understand any aspect of system or application behavior and performance. Modern software development teams quickly and methodically analyze telemetry data to discover and understand any problem within a service. It provides teams with a way to ask fact-finding questions of their data, pursue leads, and generally explore anything and everything that’s occurring when users interact with their applications.
source
If you’re stuck in painful frontend debugging processes like I’ve described, understanding observability and working to implement it in your web services could reduce the pain and make it easier to ship things with confidence. Let’s look at how this works in practice.
Observability 1.0 in the frontend space
Consider a task that many developers who work on web services may be familiar with: debugging poor page performance scores, with measurements like Google’s Core Web Vitals metrics. These metrics measure how your website’s speed and usability is faring:
- Largest Contentful Paint (LCP) tracks how fast content shows up on page
- Cumulative Layout Shift (CLS) measures whether content shifts or is stable
- Interaction to Next Paint (INP) measures how fast your code responds to user input
Google tracks your performance on these metrics and uses it as a signal in search rankings. If you care about search ranking, you probably also care about CWVs. Google’s metrics are also about user experience, so even if you care less about search ranking, you probably care about your user’s experience on page. These metrics can therefore be used to track certain aspects of UX.
RUM can leave questions unanswered.
Honeycomb for Frontend Observability doesn’t.
How do I improve poor CWV scores?
For most devs today, this is a fun game of using a monitoring tool (maybe a Real User Monitoring product) to know which metric is poor. If your site has thousands of pages, the global CWV metric is probably not helpful at all; it doesn’t give you any guidance on where to look.
Most monitoring tools allow you to slice by a few dimensions, so you can narrow down to specific device types or page-routes to help inform your investigation. Once you have sliced the metric down to the smallest likely area of trouble, you then need to use a different set of tools for debugging.
You might install a browser plugin and surf the specific pages on your live site to see if you can identify a culprit for the issue at hand. In a complex web service, though, your ability to replicate may be dependent on recreating the necessary conditions:
- Are there different feature flags that could affect the way the page behaves?
- Do authenticated users get a different experience than anonymous users?
- Is there a specific page state (items in a cart, specific types of searches, key entitlements that need to be enabled) that generates the conditions for the poor score?
If your CWV monitoring tool doesn’t include any of this context, you won’t know. You’ll have to run a ton of experiments to capture every possible permutation just to see what you can find. I’m deeply familiar with this. When Google rolled out CWVs years ago, I worked at a large media company. I was charged with identifying the causes of poor scores and finding technical fixes for the company’s two content management systems to avoid penalties when CWVs became a factor in search results. I literally spent weeks building hypotheses, attempting to verify them, and then working across numerous teams to test potential solutions—including turning off the paywall on a low volume site for a period of time just to see if it was a factor in the poor scores. Results of that test were completely indeterminate—it was possible changing some CSS values for the paywall would completely solve a CLS issue, but it was just as possible there would be no effect.
What I’ve just described—the entire debugging cycle and my experiences years ago—is what we at Honeycomb like to call observability 1.0.
You’ve got a lot of different sources of truth, and the only thing that is tying it together is you, the engineer.
Charity Majors
In an observability 1.0 world, you can eventually get all the data and information you need to solve something like a poor CWV metric, but it’s going to be an expensive process—both financially with tooling, and in the number of hours it might take.
Improving observability with OpenTelemetry
Sometime after I left the media company, I joined Honeycomb and I started learning about OpenTelemetry and observability as we practice it. I learned that everything I described up until now is not the only option available. Life for frontend devs could be better—these debugging cycles could be faster and easier. Not theoretically, but actually.
Let’s keep using the Core Web Vitals example. Most—if not all—RUM tools track Core Web Vitals out of the box. They typically do this using Google’s small web-vitals NPM package, which captures web vitals events on every page load. These RUM tools capture the metrics and roll them up into aggregations so you can see how your site performs. That web-vitals package also generates a lot of attribution data:
- What exactly caused a poor metric?
- Which element shifted to create CLS?
- Which interaction was slow to next paint?
- Which element counts as the ‘largest’ for LCP?
If you captured all the attribution data, your metrics would have a lot more context.
At Honeycomb, we really love OpenTelemetry, an open-source project for vendor-neutral instrumentation and telemetry. OpenTelemetry allows you to instrument the things you care about in your app and send the data to any vendor that supports it, such as Honeycomb. Because OpenTelemetry is not a proprietary instrumentation library like a RUM agent, it allows you immense flexibility to capture the data you need to understand your system, like the web-vitals attribution data.
My team at Honeycomb recently released a web instrumentation package built on OpenTelemetry. This package tracks all of the Core Web Vitals metrics out of the box, along with the attribution data. The web instrumentation captures a lot more as well; standard things like device type, page data, browser info, etc.
Capturing the data is not really that exciting, however. The excitement comes when you can make use of it to solve your problems.
Improving frontend debugging
Core Web Vitals debugging becomes a lot easier when you have a richer set of data to work with. Our instrumentation package captures CWV data as OpenTelemetry traces. A trace is a structured log that consists of one or more spans, and each span can have many (up to 2,000!) attributes. Attributes are key/value pairs. In Honeycomb, you can query against any span or span attribute, allowing you to slice and dice the data in any which way.
In the Core Web Vitals example, let’s imagine you identified that some users’ pageloads have a very poor CLS score. With Honeycomb’s web instrumentation, every single CLS metric that is captured comes with dozens of span attributes providing context to the data. You can start by querying for the average value of all events that are named cls. That won’t give you much signal. So start slicing it up, maybe breaking the values out by URL. Now you can see if certain pages are outliers, and if so, filter down to just those pages. Breaking out the data by browser or screen size will help you see if any more patterns emerge in the distribution of your scores.
This first pass of investigation is trying to localize where the problem is—to filter down to the specific place in your site that needs addressing. There’s more, though: Honeycomb still has a mountain of data you can surface.
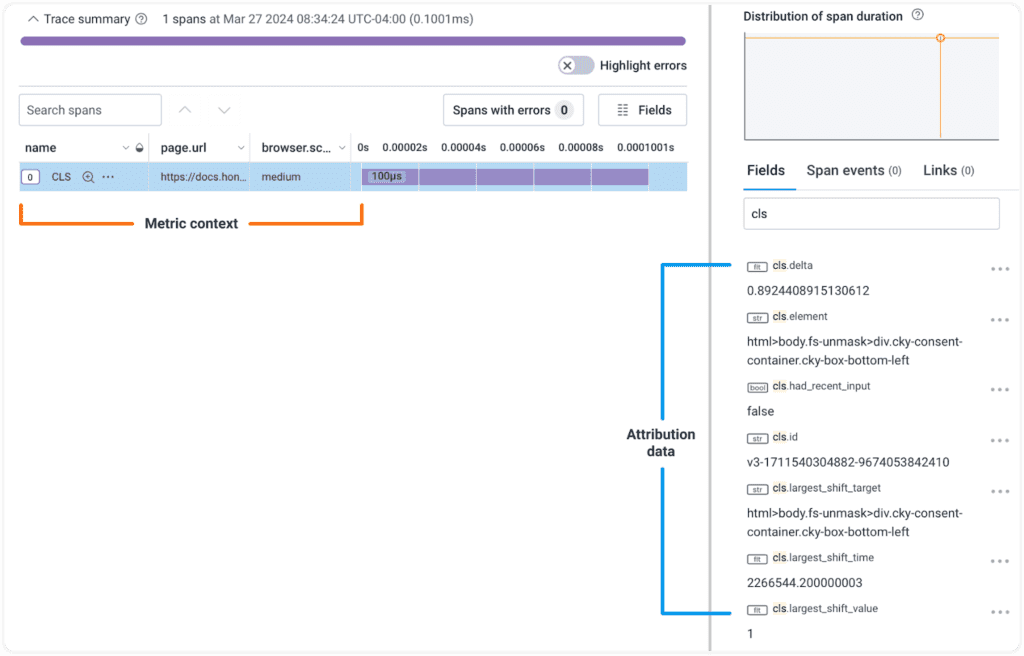
Once you have found an area of interest, you can explore the CWV attribution data! Every single CLS metric event has that attribution data, so if you’ve narrowed the problem down to a specific page on a specific screen size, break out the attribution data to see the element selectors identified. There probably won’t be many; usually, on any given page, only a few elements are responsible for the biggest issues. You can grab one of the element selectors, visit the page on your site, set the browser to the correct width, and run a querySelectorAll() call with the selector to find the element.
In just a few minutes, you’ve gone from the awareness that a problem exists to a likely culprit. This is the power of observability 2.0.
The fun doesn’t end there, however. Because you are capturing metrics and context, you can ship fixes and then go check your work. Once your updated code rolls out to production, you can pull up your same queries to see if there’s meaningful improvement. Observability 2.0 allows you to debug and identify culprits, then confirm that solutions work with the same workflow, ensuring you have the confidence to close an issue as fixed and move on to the next priority.
Recap: Frontend debugging doesn’t have to be painful
This blog post covered a lot of material, so I want to make sure to call out the highlights. Frontend debugging today is bad because it’s stuck in an observability 1.0 world. There are lots of tools out there collecting tons of metrics and data about what users are experiencing on your web services. That data often alerts you to the existence of problems, but to debug the causes, you need to combine a great deal of investigative work and guessing.
Frontend debugging can improve immensely by taking advantage of open-source tools like OpenTelemetry to start instrumenting your web services with the data you care about. Practicing observability means instrumenting widely; not simply capturing a metric of interest, but any and all context attached to the metric that will help you understand it. If you do this, then you have the ability to ask questions, to quickly and iteratively explore your data, find correlations, and get to root causes much faster.
Honeycomb’s web instrumentation gives you a great starting point for this, capturing a rich set of initial data. The power of observability, however, is that you aren’t limited to what is automatically collected. You can add the context and information you care about, and immediately start enjoying the rich investigative power that observability 2.0 gives you—lots of contextual data, all available in one place, for you to be curious about. Try it today for free.
Want to know more?
Talk to our team to arrange a custom demo or for help finding the right plan.