Get deeper insights with Honeycomb Tracing
We’re excited to introduce Honeycomb Tracing! Now, you can both: Visualize individual traces to deeply understand request execution, and Break down, filter, and aggregate trace data to uncover patterns, find outliers, and understand historical…

By: Eben Freeman
We’re excited to introduce Honeycomb Tracing! Now, you can both:
- Visualize individual traces to deeply understand request execution, and
- Break down, filter, and aggregate trace data to uncover patterns, find outliers, and understand historical trends.
Tracing makes it easier to understand control flow within a distributed system. Waterfall diagrams concisely capture the execution history of individual requests, making it easy to answer questions such as:
- What does the high-level structure of the code look like?
- Which methods are especially slow?
- Are we making too many calls to a particular service?
- Are things happening serially when they could be parallelized?
- Is there unaccounted-for time where instrumentation is missing?
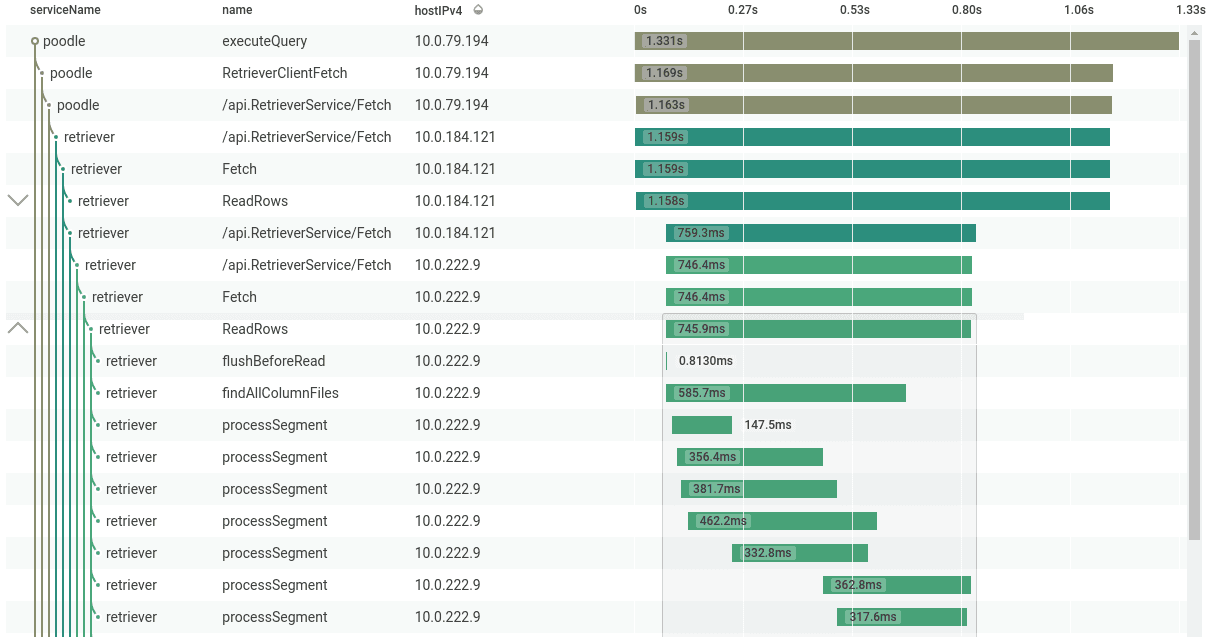
An excerpt of a trace from Honeycomb’s own production infrastructure.
However, individual traces alone aren’t enough to really understand what’s happening in production! It’s equally important that you can quickly find traces of interest, and that you can understand the overall behavior of your service: Which API endpoints are particularly slow or error-prone? How did performance change between deploys? Which users are responsible for the bulk of database load?
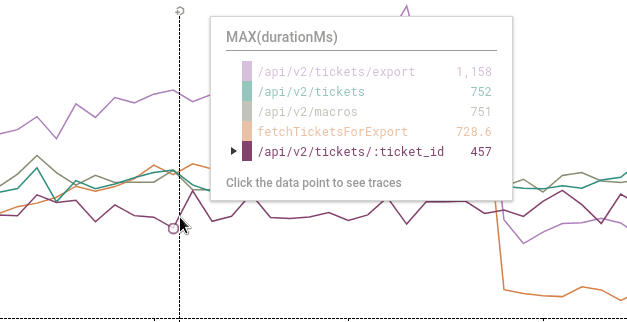
Honeycomb aggregates data at read time, so you don’t have to predict ahead of time which metrics matter. You can fluidly go between time-series graphs, traces, and raw rows to get answers, without having to switch context between tools.
Go directly from a graph to representative traces…
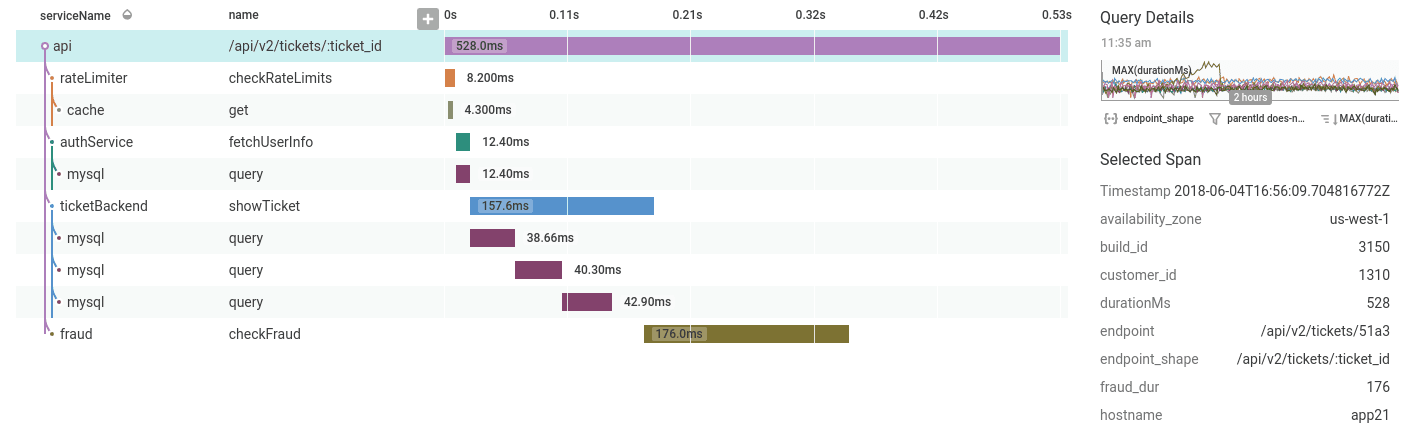
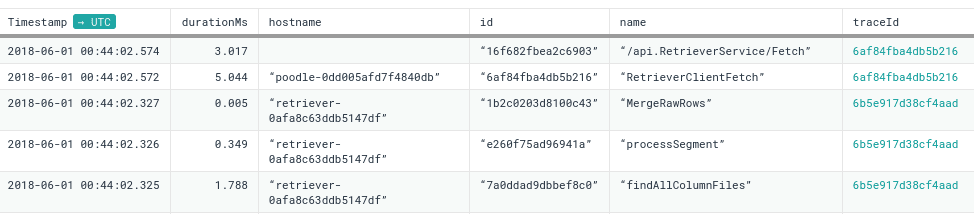
… or filter raw rows to find a specific trace.
Getting started
If you’re using OpenTracing instrumentation in your code, you’re in luck. You can use any Zipkin-compatible OpenTracing library together with Honeycomb’s lightweight proxy, to collect trace data. Read more about honeycomb-opentracing-proxy.
However, you don’t have to use OpenTracing. We’re convinced that what you can do with data is more important than how you choose to instrument your code. If you already have structured logs or events, you can simply include tracing metadata using a few extra fields, and Honeycomb will reconstruct traces for you.
And if you’re using Go, Node.js or Ruby (and soon, Python and Java), you can use Honeycomb Beelines to get single-service traces without doing any manual instrumentation. Read more about Beelines.
Check out the docs for more details.
Stay tuned for more
Here at the hive, we’ve been using Honeycomb Tracing to improve the performance and robustness of our distributed storage engine, to make builds faster, and more. We’ll share more details on that, plus best practices for instrumenting code, in future posts. If you want to see more tracing in action, sign up for our webinar this Friday for a live demo and discussion.
Try it yourself
Beginning today, tracing is available with every Honeycomb plan — sign up to explore example data yourself, then see what you can learn from your own data.
Want to know more?
Talk to our team to arrange a custom demo or for help finding the right plan.