Discovering and Exploring Web Latency Spikes
Last week, I got a signup invite for Honeycomb. My consulting business has a website management platform with modest but steady traffic, about 30k req/day. I was interested in using Honeycomb to watch the…

By: Guest Blogger
Last week, I got a signup invite for Honeycomb. My consulting business has a website management platform with modest but steady traffic, about 30k req/day. I was interested in using Honeycomb to watch the day-to-day heartbeat of my application, and ideally spot anomalies before they become problems. When I immediately found two actionable problems I was floored.
What is a ping spike or latency spike?
A ping is a measurement of how long packets take to traverse the various routers on the internet between two points and return. Latency is a combination of external network delays, plus processing time to create a response, and then deliver that response to the user.
When experiencing a latency spike, a service will appear slower than normal. From the user’s perspective, the app is either slow or broken, depending on how bad the spike is.
What causes latency spikes?
Latency spikes can come from a wide variety of sources, which makes troubleshooting them difficult. There are a lot of different computers that all have to behave perfectly for a customer to get their responses quickly. The variety of causes makes troubleshooting difficult.
Some sources of latency:
- User’s computer running out of resources or starting a background process
- User’s child starts streaming on twitch which decimates the network bandwidth
- User’s internet service provider (ISP) is doing maintenance on the primary peering connection to the internet so traffic is going through a slower backup
- The internet is having routing issues
- Your web hosting provider’s ISP is having an issue
- The firewall in front of your web application is running out of resources
- Your application is running out of resources
- Your application is under attack
- Your application has a bug that creates a delay
- Your database behind the application is running low on resources
- Spoiler: an unrelated party messed up their DNS (it’s always DNS)
Solving latency spikes with Honeycomb
I ran through the Quick Start, using curl and python to send my first few events. I found honeytail, and saw it had an nginx log parser which automatically inferred any custom log format from the config file. That is neat. I installed the package and started the agent, and then waited an hour for data to flow in1.
I let it run for an hour. I didn’t really know what to do when I got back to the Honeycomb console, but it had a pretty familiar SQL structure and pre-populated all the field names and calculations based on my data. Honeycomb actually saves the structure and results of all my queries, so I was able to go back later, retrace my path, and walk you through my thought process.
How I found the cause of the latency spikes
I started with the default query hint: a COUNT(*) that displayed total requests per second over time. The default nginx logs are rather terse; I decided to add more useful information to my logs. I added $request_time to the log format, and restarted both nginx and honeytail.
Here is the nginx log format I ended up with:
log_format honey '$remote_addr - $remote_user'
            '[$time_local] "$request" $status'
            ' $bytes_sent $http_x_forwarded_for'
            ' $host $request_time $upstream_response_time'
            ' $pipe : "$http_user_agent" $server_port';
access_log /var/log/nginx/access.log honey;Some events had a value for request_time and some had nils, but that was fine. I tried breaking down my query by $request_time and noticed there were spikes where the AVG(response_time) went well over a few seconds! This is a bad sign for a lightweight web site that isn’t serving a high volume of requests.
My honeytail invocation looked something like this. (The nginx.format argument is just the name of the log_format directive, seen above.)
$> ./honeytail/honeytail
    -k 10xhunter2a0
    -d 'API nginx'
    -p nginx
    -f /var/log/nginx/access.log
    --nginx.conf /etc/nginx/nginx.conf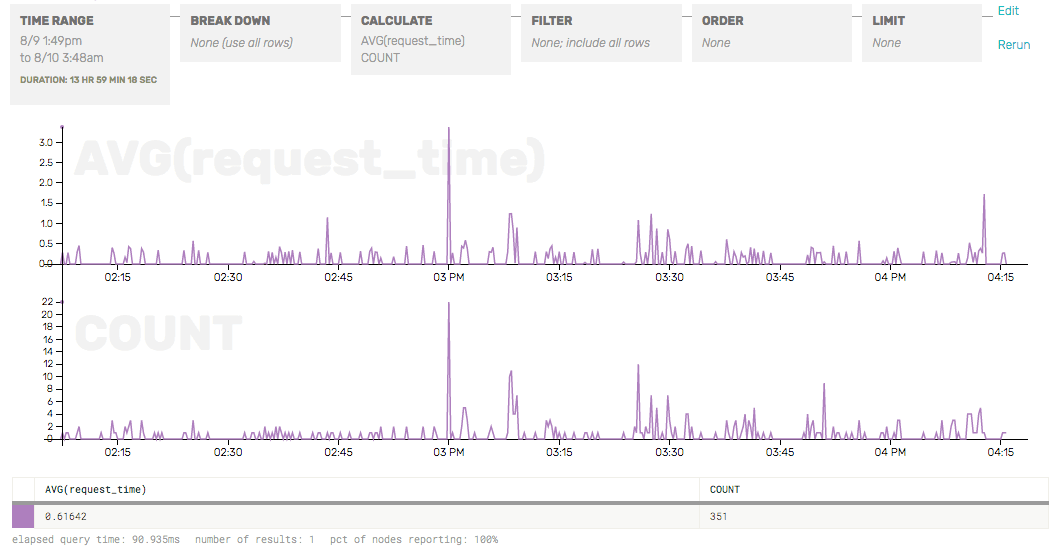
--nginx.format honeyI’m a pretty mediocre sysadmin—while writing this post I learned that AVG was not as meaningful a bucket as P95, P99, etc. Still, from this query I could see two spikes: one corresponded to a spike in the number of requests (at 3 PM) and one did not (4:15 PM).
The latency spike that didn’t correlate to a traffic spike happened again at 5:45PM, so I zoomed in to look more closely. The graph let me click and drag on the area around a spike to quickly zero in on that time range. I switched to the raw data inspector mode and saw that one page was taking about 5 seconds to render, which is how I discovered that a customer of mine had written a poorly formed template, causing slow queries and lots of rendering. I fixed the issue and moved on.
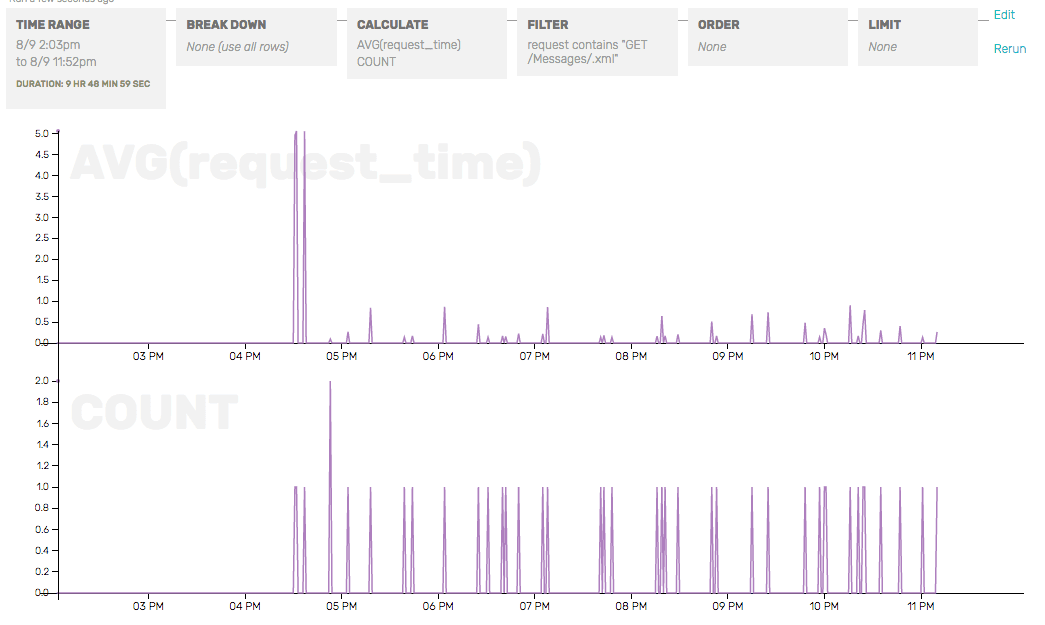
I added a filter for the problem URL to demonstrate how request duration dropped, while request rate stayed steady.
I also zoomed in on the 3 P.M. spike. I found out that they were intended for somebody else’s server. For some reason I am getting a stream of requests for somebody else’s server, because their DNS is pointing at my IP. The spike of requests was causing a latency spike for me, so I used nginx to ban requests from their originating IP so it couldn’t hit my backend Django services.
Conclusion
I solved two issues in one hour, neither of which I knew existed beforehand, and now I have a better feel for my baseline query latency and request rate. Now, as I build out more features, I can pay attention to how incremental changes affect performance.
Learn more about Honeycomb and try it yourself!
- In retrospect, I didn’t actually have to wait an hour for the data to populate my dataset—I could have replayed older logs into the dataset using the same honeytail utility.
[return]
Want to know more?
Talk to our team to arrange a custom demo or for help finding the right plan.