How Honeycomb Uses Honeycomb, Part 7: Measure twice, cut once: How we made our queries 50% faster…with data
This post continues our dogfooding series from How Honeycomb Uses Honeycomb, Part 6: Instrumenting a Production Service . The entire value proposition of Honeycomb’s columnar store is speed of queries, for instance: Examining over…

By: Chris Toshok
This post continues our dogfooding series from How Honeycomb Uses Honeycomb, Part 6: Instrumenting a Production Service .
The entire value proposition of Honeycomb’s columnar store is speed of queries, for instance:
Examining over 1.2 million rows and returning 50 time series, aggregating results into 240 (1 minute granularity over 4 hours for this query) buckets per series, in 330ms. Nice.

This is just the time spent on our storage nodes, though. It doesn’t include the amount of time it takes for the browser to download and render the results, and (more importantly for this post) it doesn’t include the time it before the browser asks for the results.
The result-fetching code is some of the oldest in our javascript. Very early on we settled on the simplest solution – polling. While we show a loading spinner on the page, the browser is repeatedly (on a timeout) asking our app if the query is done. The app responds with “no” until the results have been persisted to S3 at which point it says “yes” and returns the result JSON blob which gets rendered on the page.
The code (up until a couple weeks ago) had a constant poll interval of 1 second. So in that query up there? We’re wasting upwards of half a second that the graph could be in front of the user. Why did we expend all that effort to make our queries so fast, if the browser is just going to idle all the time gains away?
Still, it’s a system that works, it’s fast enough for many users (yes, some queries do take longer than a second 🙂 and we also have some other big fish to fry. So we asked ourselves “what’s the minimal amount of work we can do to get queries in front of users faster?”
The answer, perhaps the most boring answer ever, is: don’t wait as long before polling. But how long should we wait? To figure this out we looked at query times across all our customers (in Honeycomb of course):

These particular results show percentiles over a derived column that sums two timers: the time spent waiting on the storage node to perform the query, and the time spent persisting the results to s3. They show that 10% of queries are stupid fast, completing and persisting to S3 in under 110ms, and 50% of queries complete in under 412ms.
We wanted a nice round number for the initial poll interval, so we chose 250ms. In order to not completely spam our app server, we only do two polls at 250ms, after which we switch to 500ms. Poll times of 1 second are completely banished. We also added instrumentation to see how many poll iterations it took before our app sent data down to the browser. How did things change?
Using a pretty representative sample of ~5300 queries over the past 24 hours:
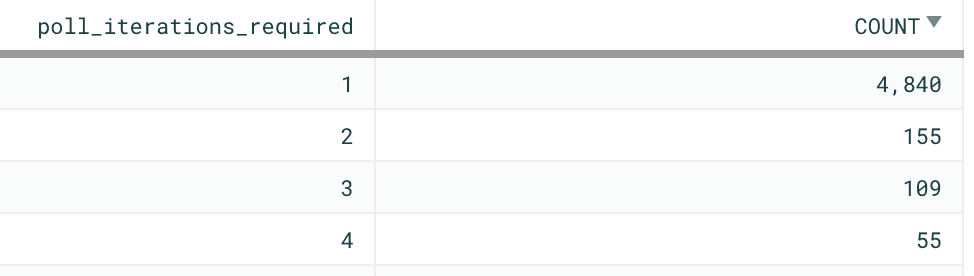
91% were serviced in one poll iteration – 250ms from the javascript requesting results until the browser started downloading those results.
94% were serviced in two poll iterations. 500ms.
94% of the sampled queries run over that 24 hour period completed end-to-end a half second faster than before.
Eagle eyed readers might have the question: “why did decreasing the poll time to cover the P25 end up covering 91% of the sampled queries?” The biggest reason currently is additional time wasted in the front end (causing lag between the user action of running a query and the start of poll loop.) More low hanging fruit 🙂
This isn’t a bad start for such a simple change. There’s still a lot of frontend/transport work left to do to lower the remaining overhead in other parts of the system – some easy, some not so easy. If user-delight increasing optimizations spanning browsers, app servers, storage systems, and transport mechanism between all the above are something you’re interested, come work with us!
This is another installation in a series of dogfooding posts showing how and why we think Honeycomb is the future of systems observability. Stay tuned for more!
Want to know more?
Talk to our team to arrange a custom demo or for help finding the right plan.