Incident Report: Running Dry on Memory Without Noticing
On November 6, 2019, we intermittently rejected 1-3% of customer telemetry data at ingest for four periods of 20 minutes each. The trigger of the incident was a slow memory leak that manifested over…

By: Liz Fong-Jones
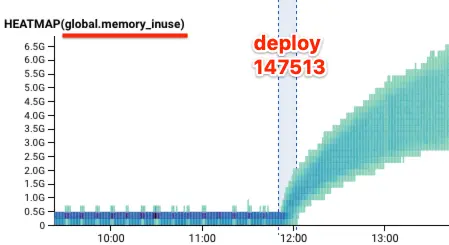
On November 6, 2019, we intermittently rejected 1-3% of customer telemetry data at ingest for four periods of 20 minutes each. The trigger of the incident was a slow memory leak that manifested over hours, which leaked at the same rate on each ingest backend. Thus, all backends crashed within minutes of each other, causing requests in flight to fail and new requests to fail to find healthy backends. And repeat.
Our Service Level Objective measurement on customer ingest response codes saw the brownout and resulted in detection within minutes; however, it took us several hours to identify the issue and resolve it. This lengthy resolution time was a result of confirmation bias: we narrowed in on the wrong hypothesis, didn’t search for alternative explanations for the data we were seeing, and believed that there was nothing we could do to resolve the incident other than wait on a third party.
As always, we’re sharing our process and outcomes so everyone can learn from our experiences.
The Good (“What went well?”)
Our SLO feature really shone through in a situation where traditional end-to-end blackbox monitoring failed to detect the brownout.
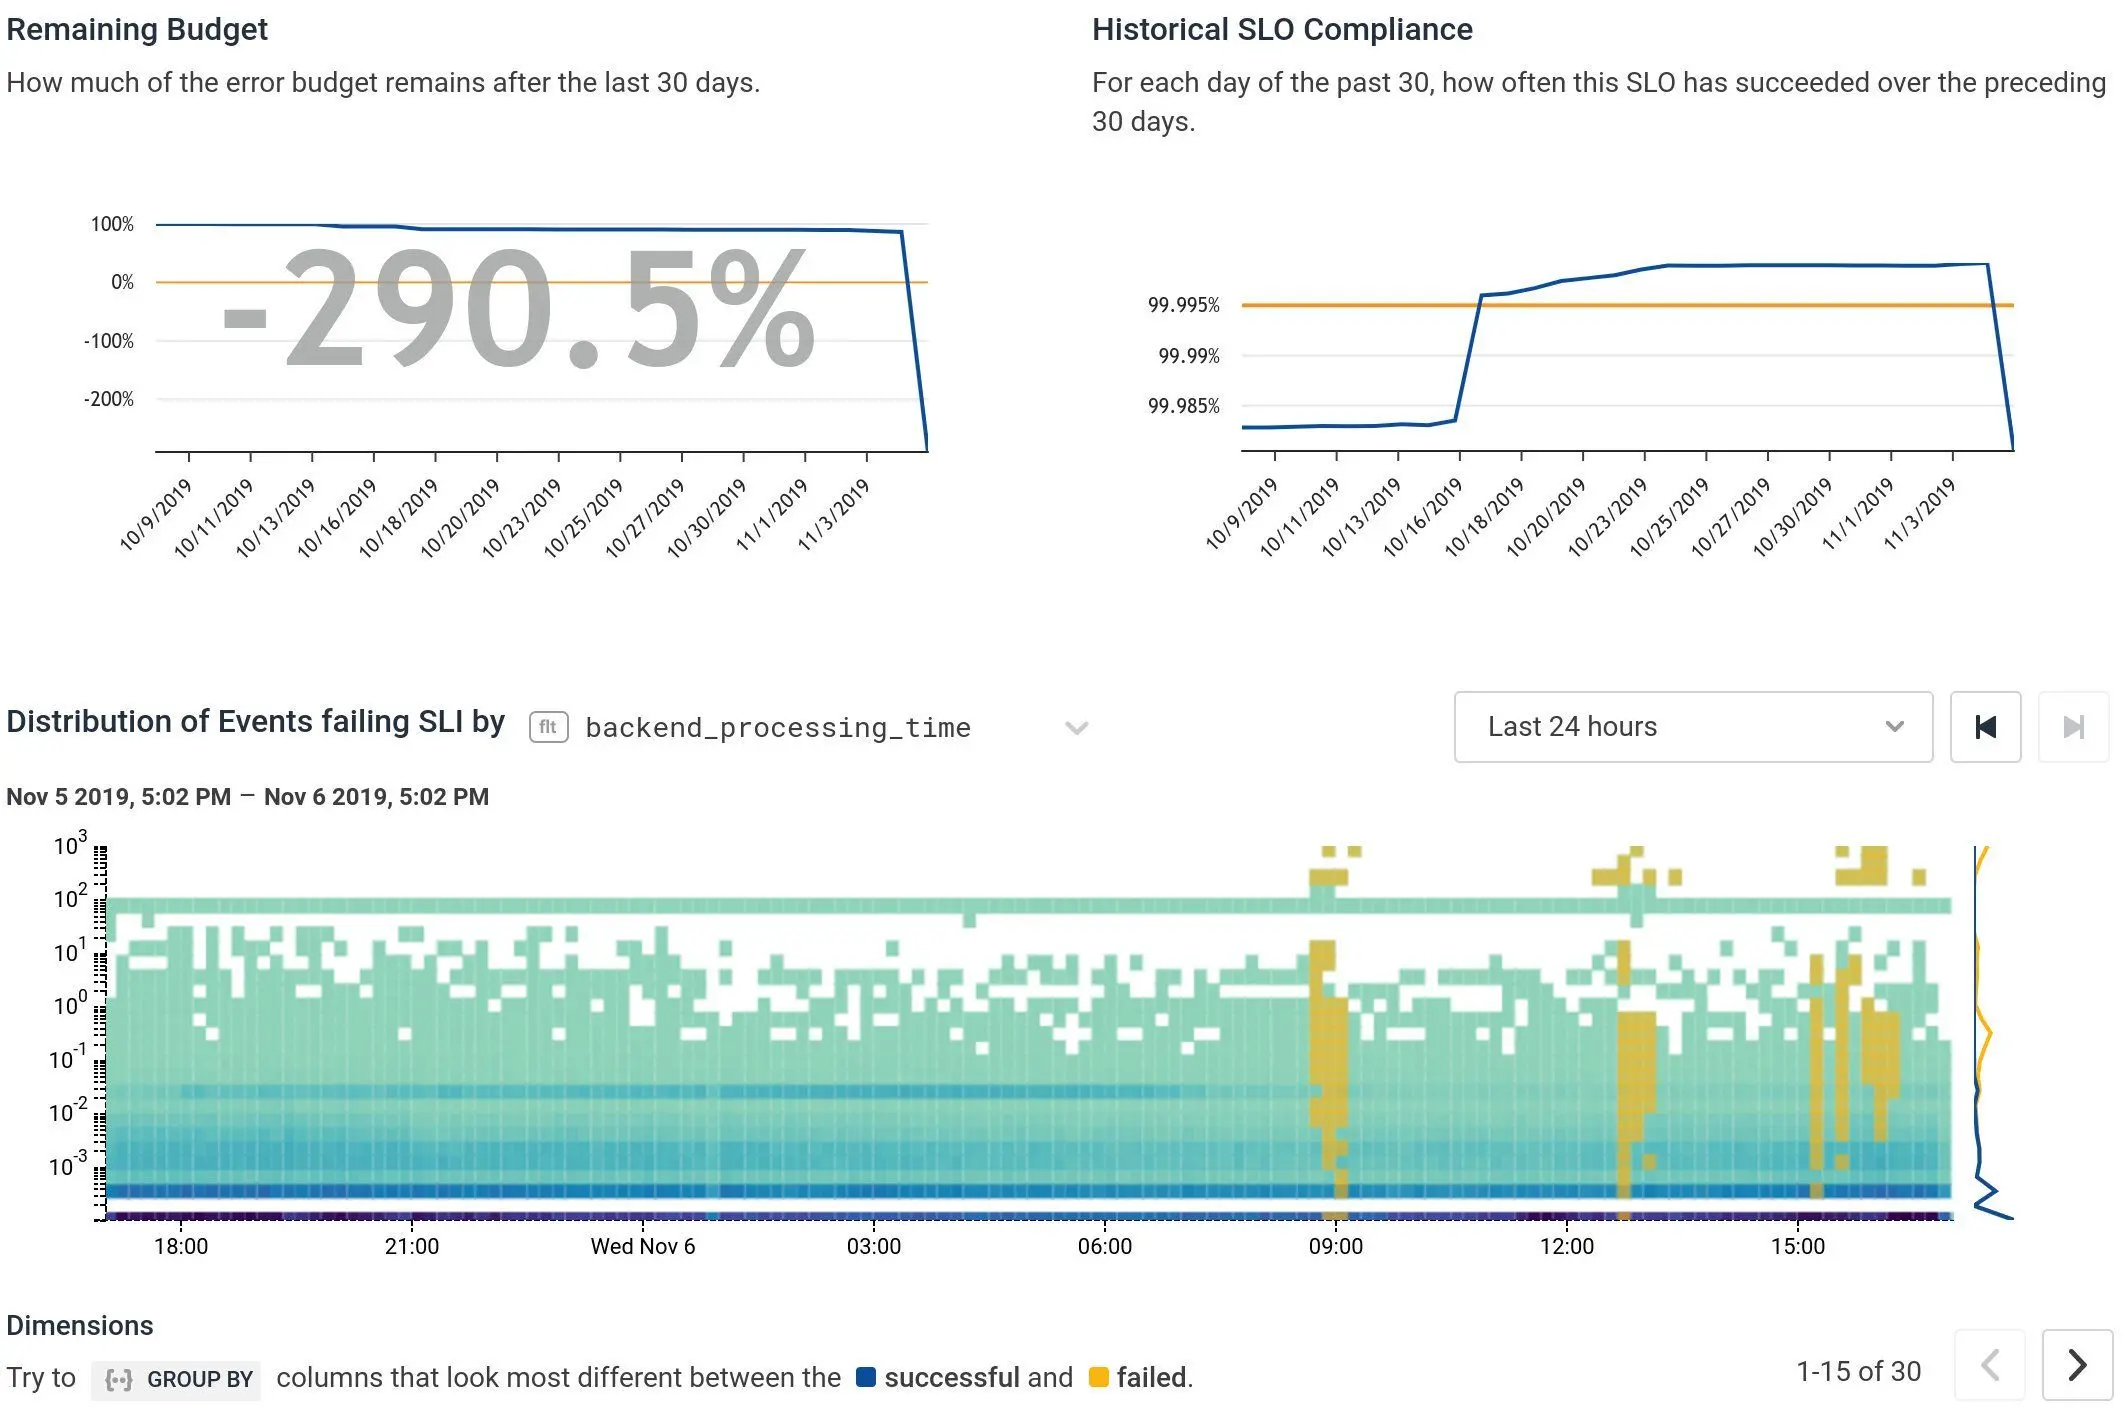
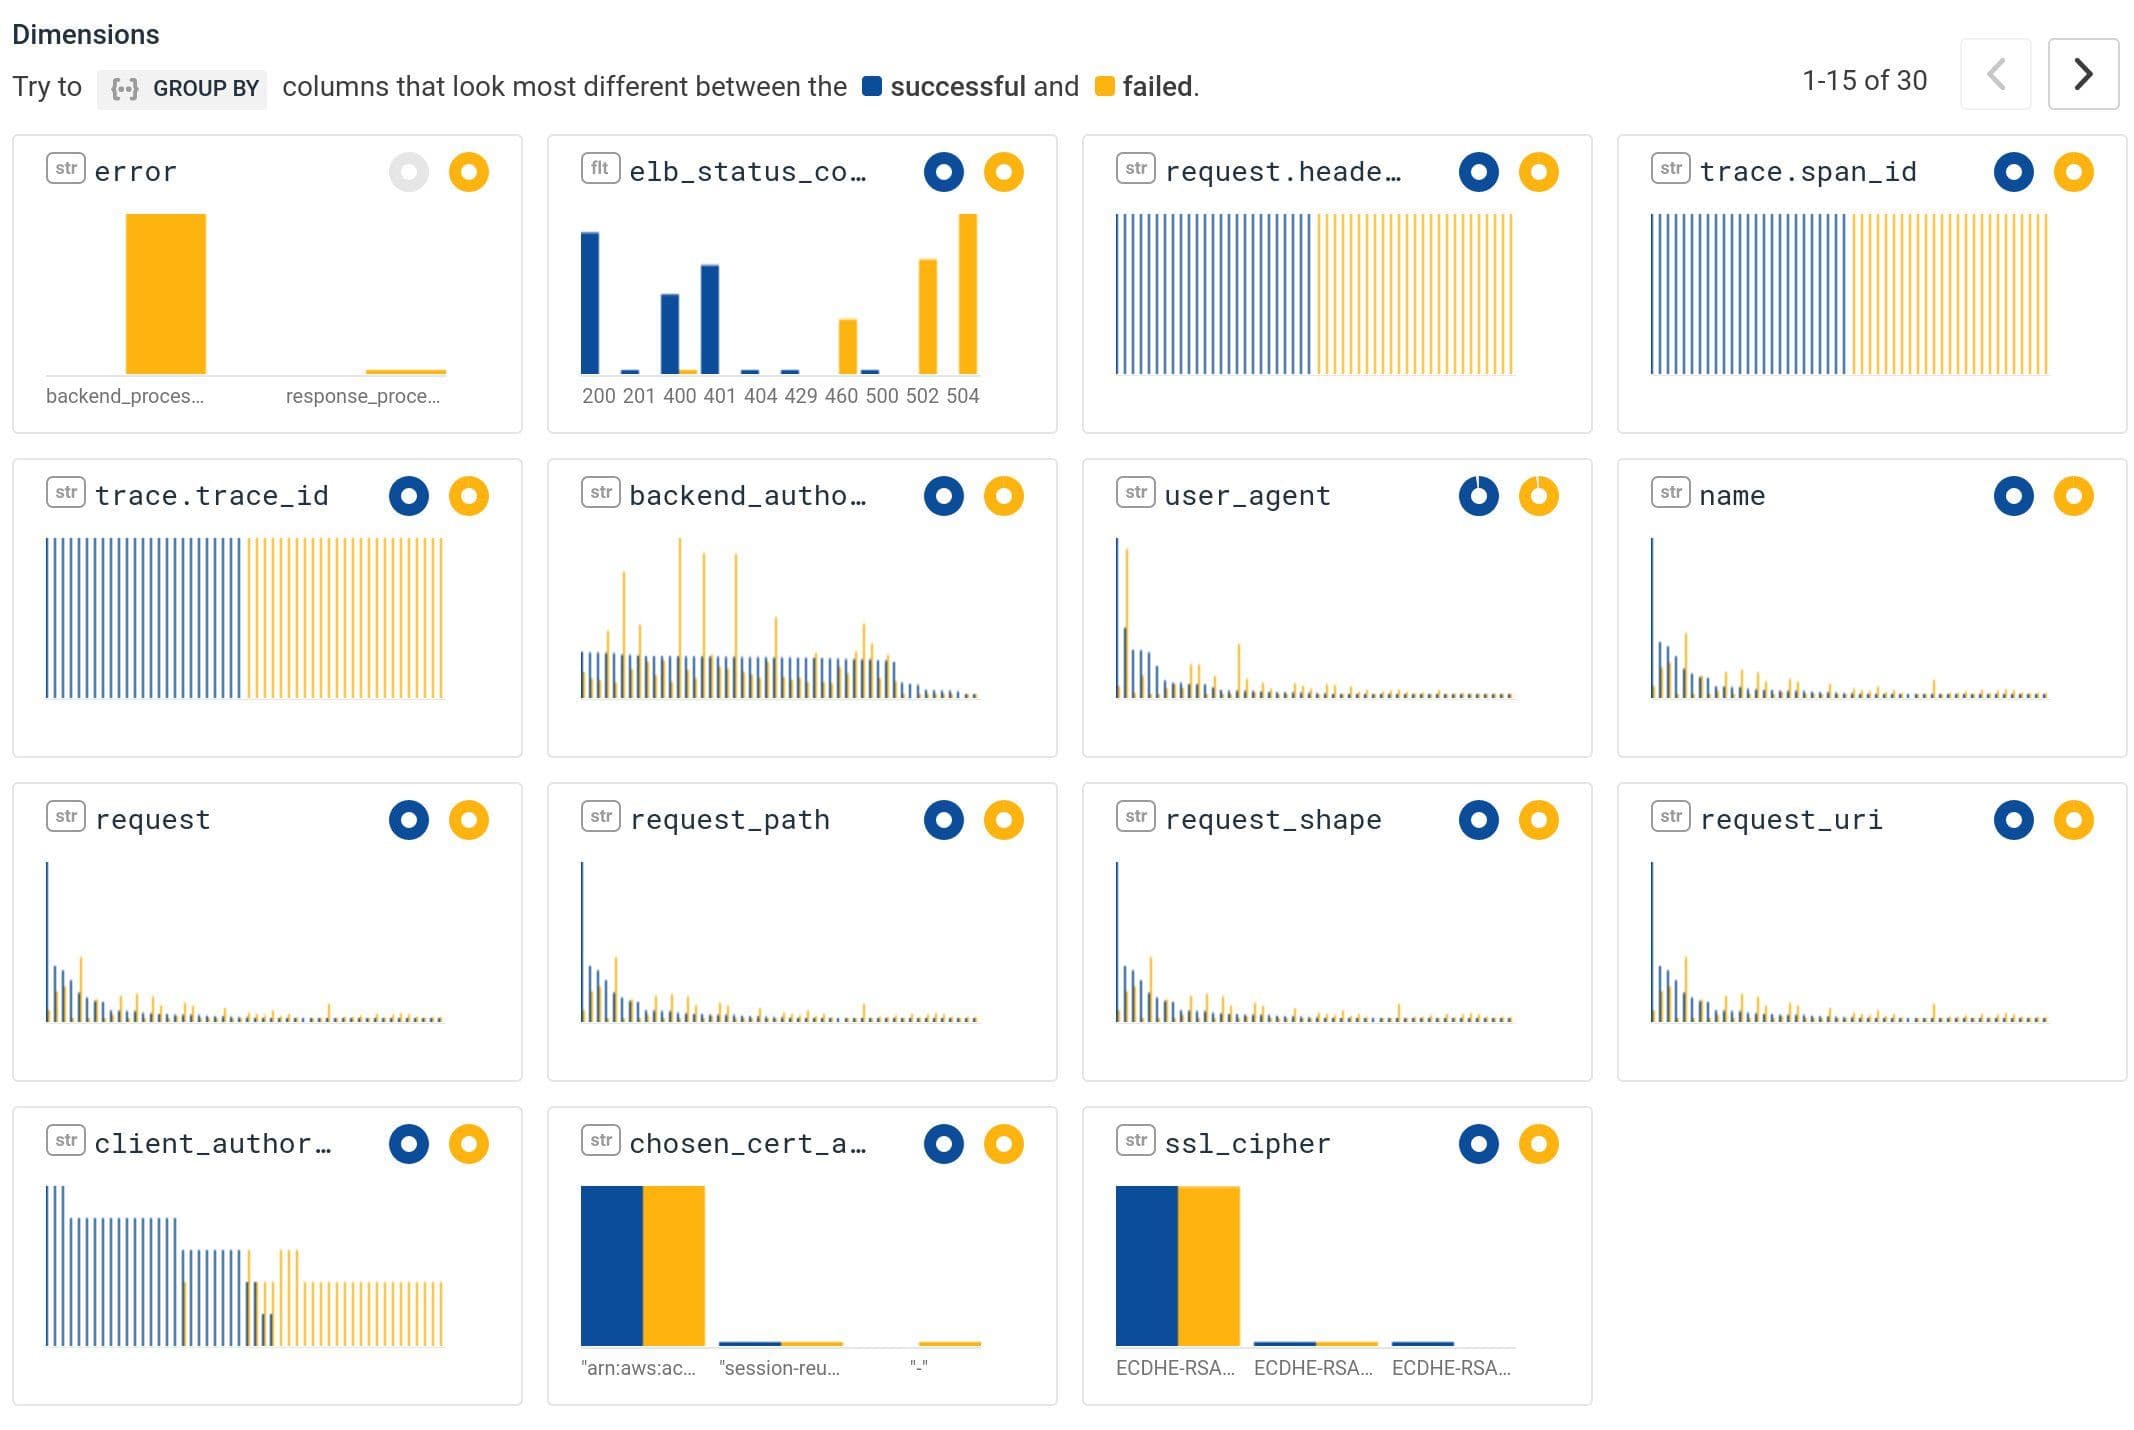
(The e2e check did eventually fire when two probes happened to be in the 1% that timed out… but then it “recovered” immediately.) We were able to get a damage estimate very quickly: “if this 3% error rate continues, we’ll soon violate our quarterly budget of <0.1% total errors…”. The BubbleUp built into the SLO feature told us that the issue was evenly scattered across all our ingest workers and across all our clients, meaning it wasn’t a single bad worker or client.
But then, we got ourselves into trouble…
The Bad (“Where did we get lucky/unlucky?”)
Unclear incident handling contributed to the confusion. The SLO burn alert wasn’t set to paging status (our SLO feature is not yet out of beta), so the alert happened to be picked up by an engineer traveling in Europe who was not oncall at the time. We currently practice week-long oncall shifts based out of a single rotation rather than following the sun, and have historically not had many out of working hours escalations.
After some initial investigation, she decided to wake up the engineer in the US who was oncall. That engineer didn’t say “I’m oncall, this is an incident, I should own this incident and double-check the assumptions,” so we decided it was acceptable to wait and see if it blipped again overnight and let the on-call engineer get more sleep. Meanwhile, the engineer awake in Europe reached out publicly asking if other AWS customers were seeing errors and gave customers a heads-up in Slack, despite there being no formal incident and thus no invocation of our normal outage communications procedures. This transparency may have panicked customers (as well as falsely accused AWS of an outage they weren’t actually having).
The Ugly (“What did we need to improve?”)
We quickly found ourselves locked in a state of confirmation bias – because we hadn’t pushed a new release in the past several hours, we thought it wasn’t one customer or VM, and our ingest workers themselves weren’t reporting they’d served HTTP errors to Honeycomb’s metamonitoring, we were quick to assume the issue was AWS’s Application Load Balancers failing to reach our ingest workers.
At least one AWS customer reached out to say that they saw a blip at a similar time, and we were seeing both “backend unreachable” as well as “backend timed out while processing” responses in the ALB logs to support that networking theory. We jumped to the conclusion that AWS was at fault, so we filed a support ticket and prepared for a long 12+ hour wait for an official answer, while the load balancers continued to spew errors every few hours like clockwork.
When the US Pacific folks woke back up, we started brainstorming ways to mitigate if it was really an ALB issue, for instance switching back to ELBs. Meanwhile, another engineer who had fresh eyes was verifying that they understood the failure mode, and while cross-checking their mental model against service data, discovered the underlying technical issue: the process restarts and memory leaks.
What will we do to address these issues?
Immediately after discovering the memory leak, we reverted the bad commit and pushed a fixed release, causing the service to return to normal. We monitored and ensured that memory usage was staying constant as expected, and no further crashes happened.
It is impossible to prevent every memory leak; therefore our technical fixes are primarily focused around detection and mitigation. A high process crash (panic/OOM) rate is clearly abnormal in the system and that information should be displayed to people debugging issues, even if it is one of many potential causes rather than a symptom of user pain. Thus, it should be made a diagnostic message rather than a paging alert. And rather than outright crash and thereby lose internal telemetry, we will consider adding backpressure (returning an unhealthy status code) to incoming requests when we are resource constrained to keep the telemetry with that vital data flowing if we’re tight on resources. In this situation, it would have resulted in dropping more incoming traffic, but with the benefit of immediately getting the data we needed to diagnose the issue. Obviously, this is not an easy decision to make, and requires more discussion.
Ultimately, the main changes we need to make are to our incident process rather than technical ones. We should be more willing to believe SLO burn alerts, more willing to declare incidents, and more willing to investigate/question assumptions. We’re taking this as a lesson that consistency matters, and we’d rather err on the side of declaring an unnecessary incident than fail to declare an incident and act haphazardly. We’re promoting our user-facing SLO alerts to actually page oncall the same way our end-to-end blackbox probers do. If and when we find we’re spending too much engineer time responding to non-incidents, we will move the pendulum back a bit, and continue to iterate.
Conclusions
We’re sorry about the impact this incident had upon customers. We work hard to avoid incidents like these. When they occur, we are ruthlessly transparent about the details and our process so that you can have confidence in what we tell you and how we run our business.
If transparency and complete understanding of incidents and their outcomes matters to you, consider signing up for a free Honeycomb trial.
Want to know more?
Talk to our team to arrange a custom demo or for help finding the right plan.