Istio, Envoy, and Honeycomb
Here at the hive, we’re exceedingly excited about the emerging future of the “service mesh.” After deploying a sidecar proxy such as Envoy, a service mesh will unlock a number of infrastructure benefits such…

By: Eben Freeman
Here at the hive, we’re exceedingly excited about the emerging future of the “service mesh.” After deploying a sidecar proxy such as Envoy, a service mesh will unlock a number of infrastructure benefits such as:
- Advanced traffic control
- Fault injection
- Request level observability
The Envoy service mesh is a mighty useful tool to have when operating distributed systems.
In particular, this technology makes canary deployments and incremental rollouts dramatically simpler — particularly when used with a control plane such as Istio.
But the whole point of a canary is lost if you can’t usefully observe it! In order to deploy with confidence, you need to know that your canary is receiving the fraction of traffic that you expect, that you’re seeing the changes you want to see, and that you’re not seeing changes you *don’t *want.
Now, you can certainly publish and alert on key metrics — request rate, latency, error rate. But it’s tough to predict every metric you might ever want, and emit them all separately. Especially when you’re making very focused changes. Change the implementation of a REST API endpoint, and you’ll want to see the effect on that endpoint. Fix a customer’s issue, and you’ll want to see the effect for that customer.
Fortunately, you can use Honeycomb to parse Envoy access logs, and slice, dice, or julienne the events that they represent to get the numbers you care about.
How does that work in practice? There are different ways to deploy Envoy, but in this post, we’ll talk about the case that you’re running Istio in a Kubernetes cluster. The Envoy container is deployed as a sidecar alongside your application containers. By deploying the Honeycomb Kubernetes agent and instructing it to parse Envoy access logs, you get immediate, cluster-wide, language-agnostic visibility into every request that’s served.
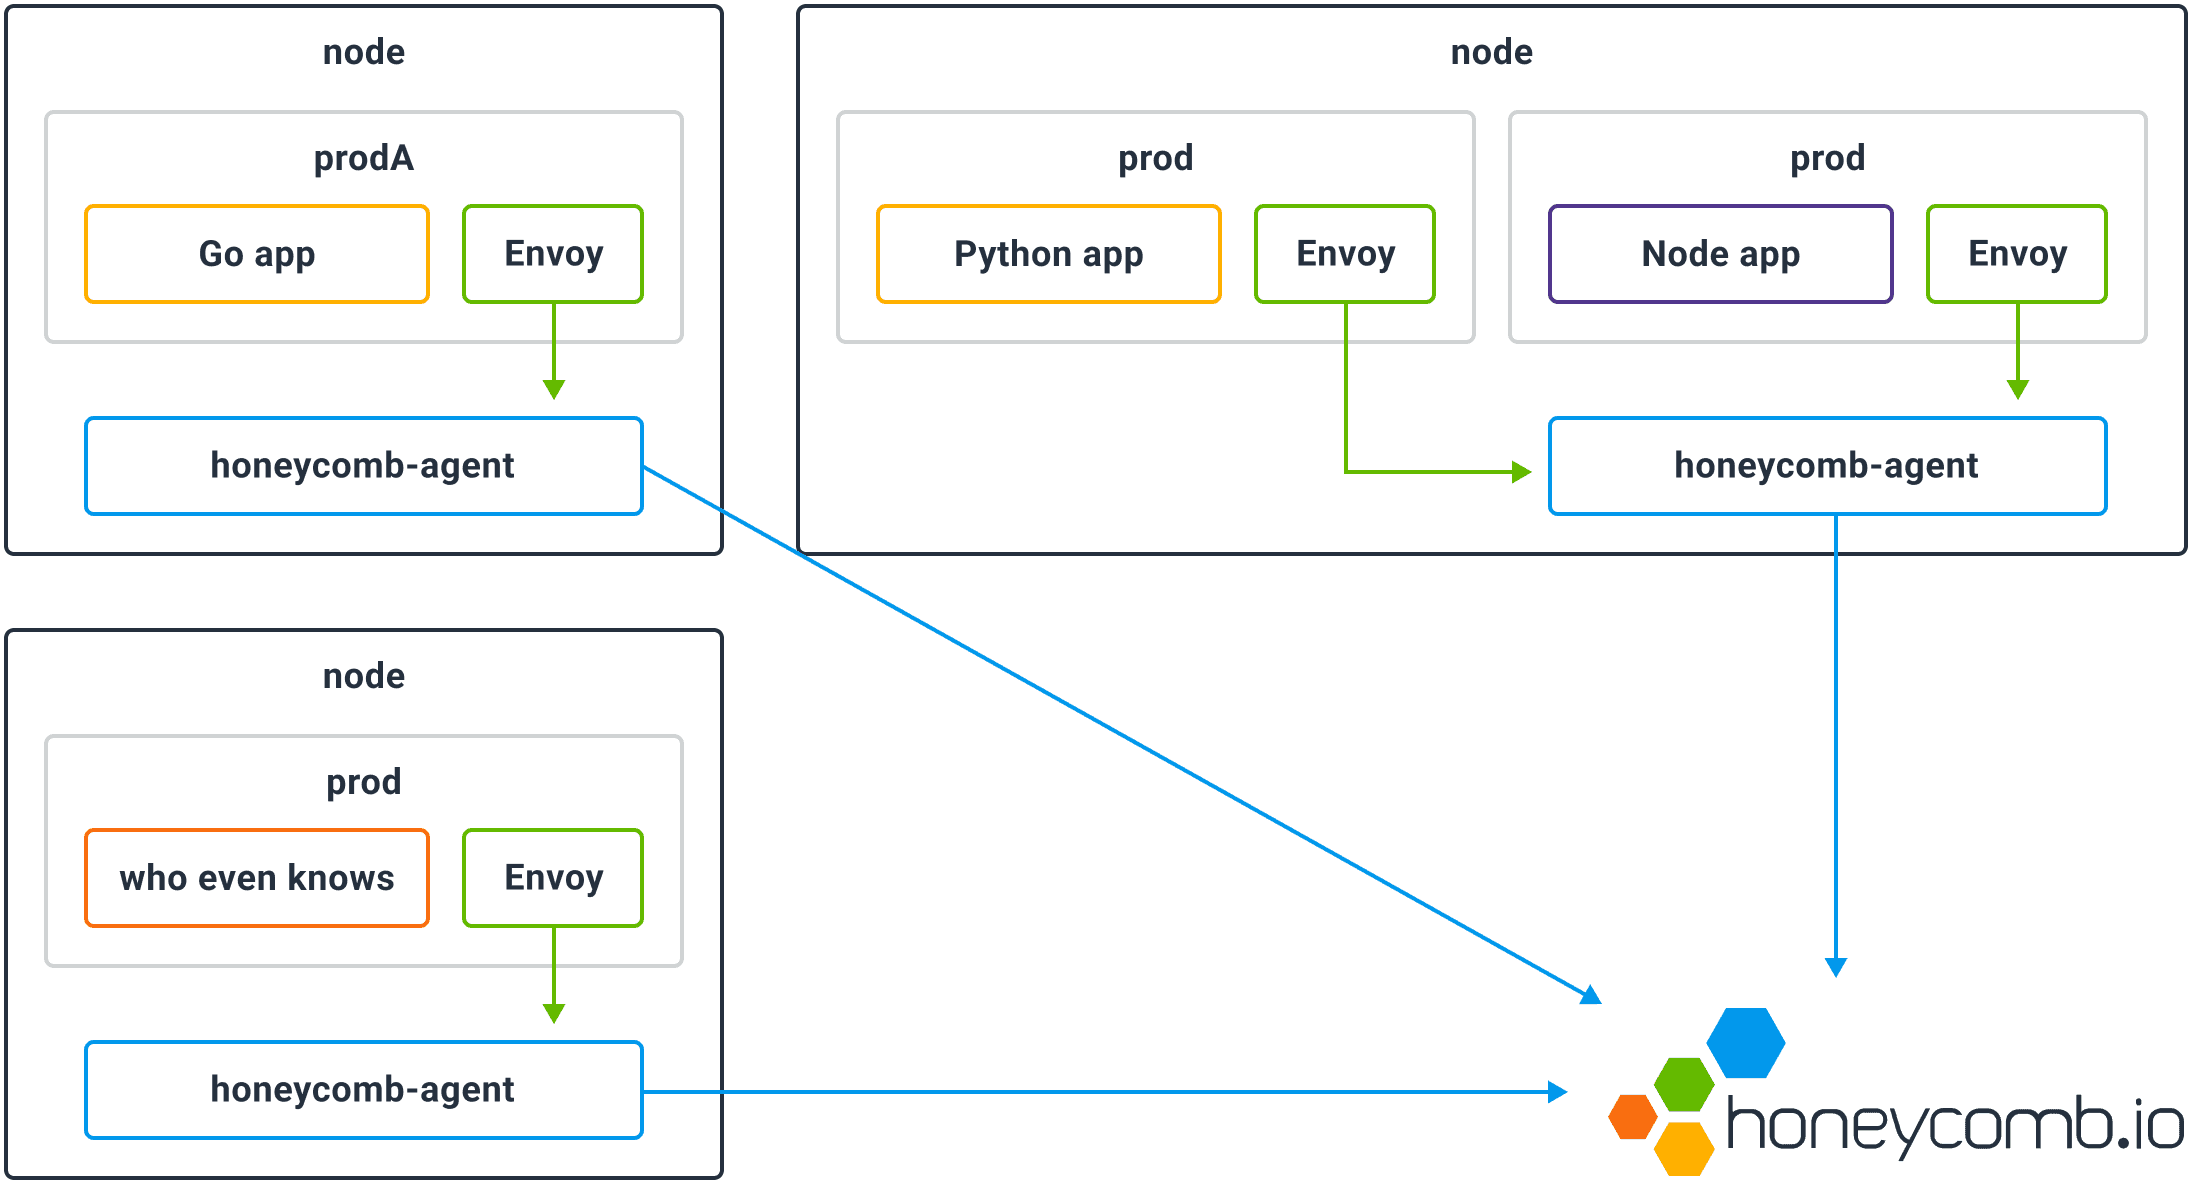
Kubernetes Canary Deployment
To make this concrete, let’s deploy and canary a sample application. (If you’d like to follow along at home, get yourself a test Kubernetes cluster, and install Istio 0.2 and the Honeycomb Kubernetes agent.) This application is a REST-like API that serves information about books.
First, we’ll deploy the app’s backing database and seed it with some data:
git clone https://github.com/honeycombio/bookservice
kubectl apply -f bookservice/kubernetes/mongodb.yaml
-f bookservice/kubernetes/bootstrap.yamlThen, we’ll deploy the actual application with the Istio sidecar injected:
kubectl apply -f <(istioctl kube-inject -f bookservice/kubernetes/service.yaml)ubectl apply -f <(istioctl kube-inject -f bookservice/kubernetes/service.yFinally, we’ll run some clients that’ll issue requests to the service:
kubectl apply -f bookservice/kubernetes/load.yamlkubectl apply -f bookservice/kubernetes/load.yamlLet’s verify that the istio-proxy sidecar container is emitting access logs:
kubectl logs $(kubectl get pod -l app=bookservice -o name | head -n 1) istio-proxy
# [2017-09-26T23:45:51.098Z] "GET /books?isbn=0105566829 HTTP/1.1" 200 - 0 78 113 108 "-" "Go-http-client/1.1" "d7b14d0f-1115-9447-8635-b53981ff589c" "bookservice:8080" "127.0.0.1:8080"
# [2017-09-26T23:45:51.116Z] "GET /books?isbn=0470136456 HTTP/1.1" 200 - 0 106 115 93 "-" "Go-http-client/1.1" "721c3580-3606-9b4d-89b1-2920d4714bbd" "bookservice:8080" "127.0.0.1:8080"
# [2017-09-26T23:45:51.112Z] "GET /books?isbn=0130613428 HTTP/1.1" 200 - 0 134 182 154 "-" "Go-http-client/1.1" "bc4e40f8-36a1-9092-81ad-442c9c3a52e4" "bookservice:8080" "127.0.0.1:8080"
# [2017-09-26T23:45:51.140Z] "GET /books?isbn=0130906964 HTTP/1.1" 200 - 0 111 222 214 "-" "Go-http-client/1.1" "ecbf02e2-2559-9e5e-9954-1f8eaf0220a2" "bookservice:8080" "127.0.0.1:8080"
# [2017-09-26T23:45:51.185Z] "GET /books?isbn=0748314024 HTTP/1.1" 200 - 0 81 192 169 "-" "Go-http-client/1.1" "4ced2b1d-6c01-9135-a51c-0312501400d2" "bookservice:8080" "127.0.0.1:8080"
# ...The Honeycomb agent includes built-in support for parsing Envoy access logs. So let’s tell the agent to look for the sidecar container (named istio-proxy) and send those Envoy logs to Honeycomb:
echo '
---
apiVersion: v1
kind: ConfigMap
metadata:
  name: honeycomb-agent-config
  namespace: kube-system
data:
  config.yaml: |-
    watchers:
      - dataset: envoy-access-logs
        labelSelector: ""
        containerName: istio-proxy
        parser: envoy
        processors:
        - request_shape:
           field: request
' | kubectl apply -f -

# Restart agent pods
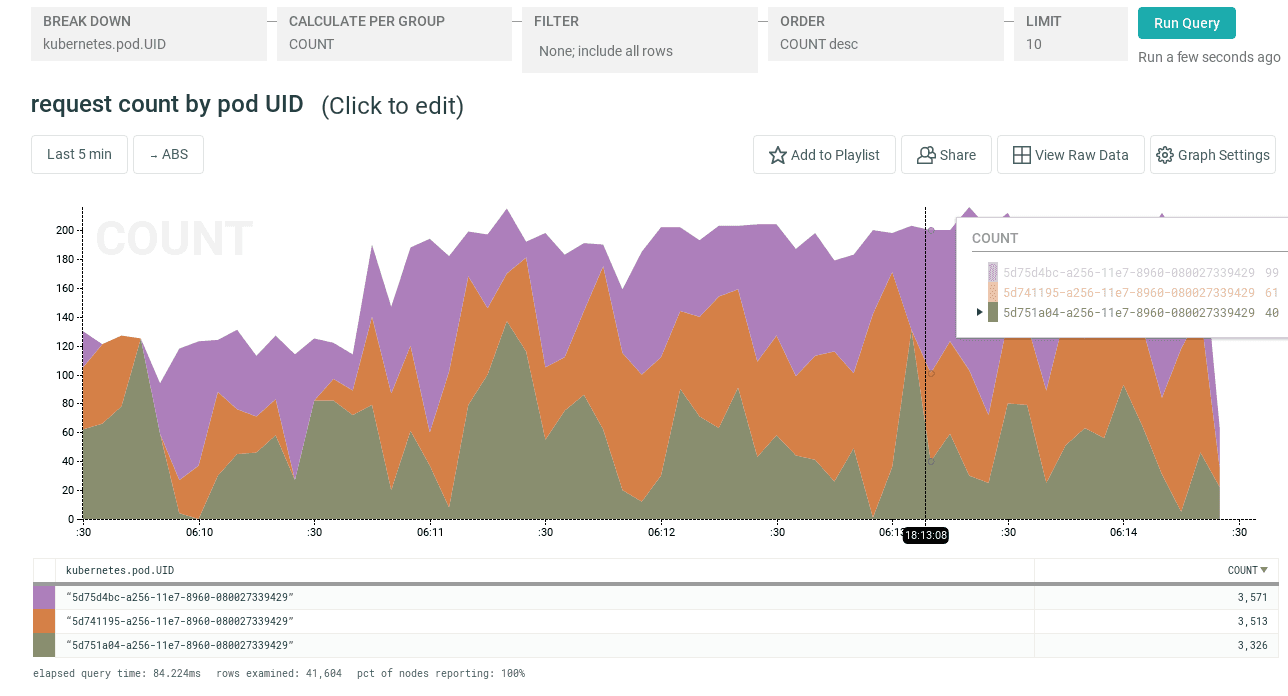
kubectl delete pod -l k8s-app=honeycomb-agent -n kube-systemWith this configuration in place, we can head on over to the Honeycomb UI to look at, for example, request count by pod UID:
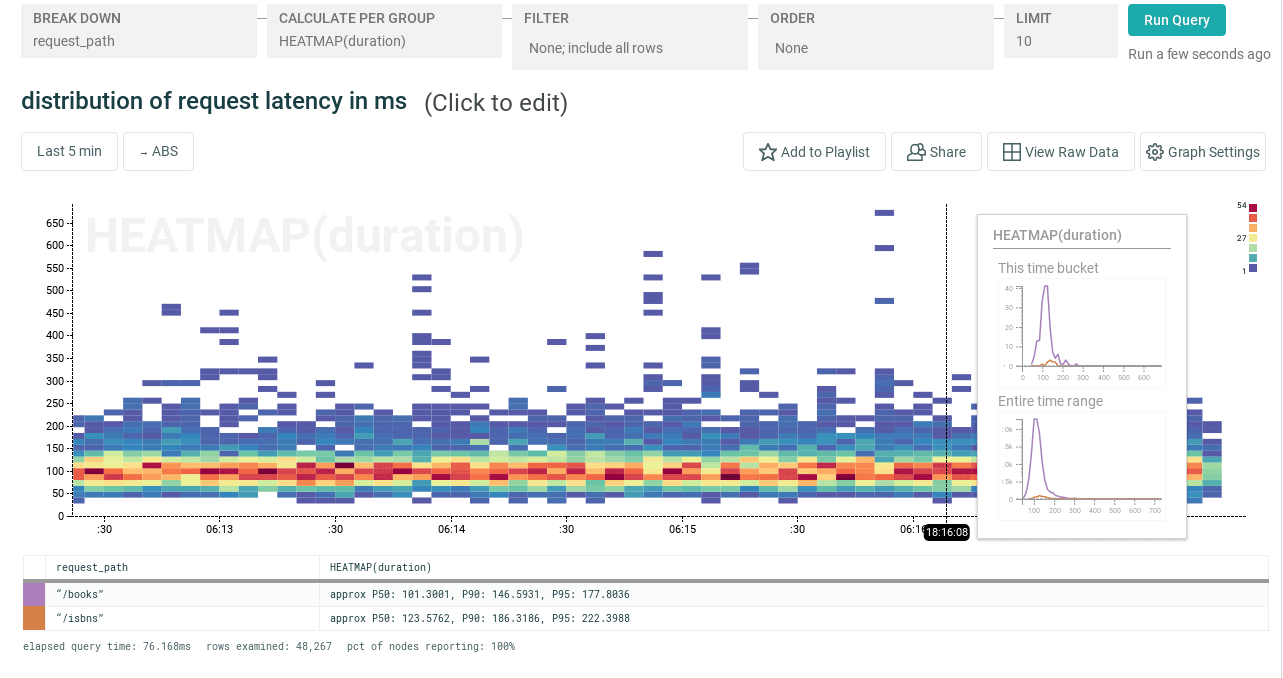
or the distribution of request latency:
But let’s not get fixated on the present state of things! It’s canary time! Let’s deploy a new version of the app:
kubectl apply -f <(istioctl kube-inject -f bookservice/kubernetes/deploy-v2.yaml)
and tell Istio to route 50% of the traffic to the new version (in a production environment, that fraction might be more like 10%):
$ cat <<EOF | istioctl create
---
apiVersion: config.istio.io/v1alpha2
kind: RouteRule
metadata:
  name: bookservice-canary
  namespace: default
spec:
  destination:
    name: bookservice
    namespace: default
  route:
  - labels:
      version: "1"
    weight: 50
  - labels:
      version: "2"
    weight: 50
EOFBy breaking down our traffic by the version label, we can check that the canary deployment is receiving an appropriate amount of traffic. The Honeycomb agent automatically augments Envoy logs with Kubernetes metadata, so we can easily break down our request events by pod labels, pod UID, node, and so on without any application code changes.
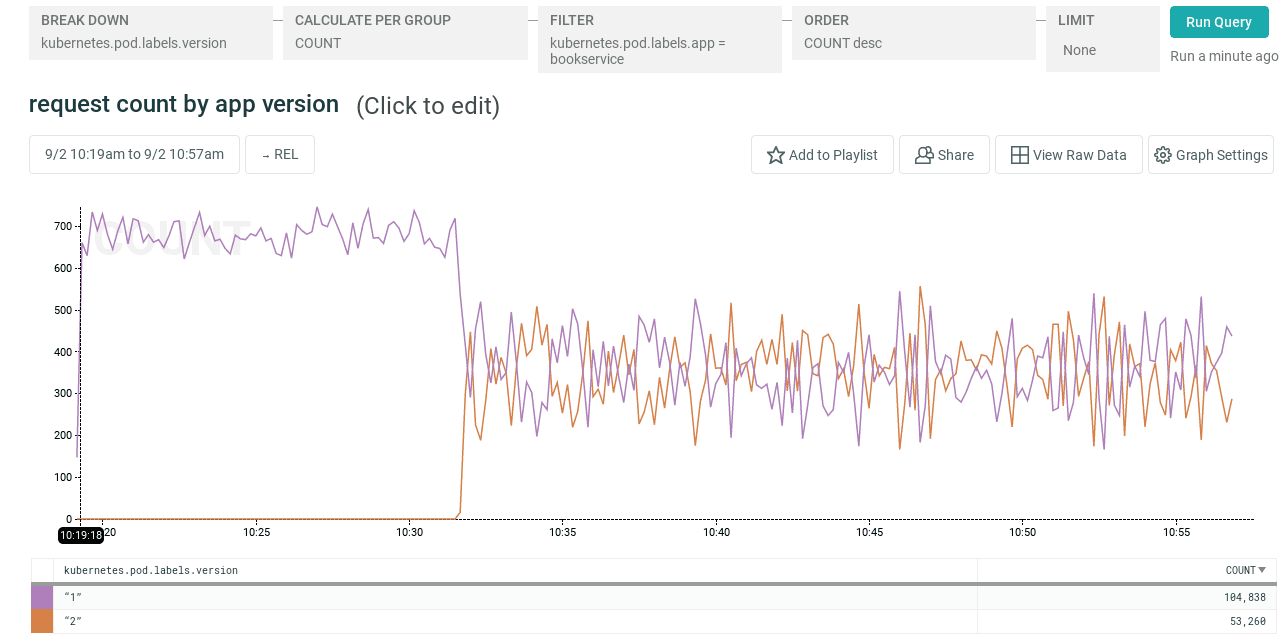
In order to verify that the canary is healthy, we can look at overall response time:
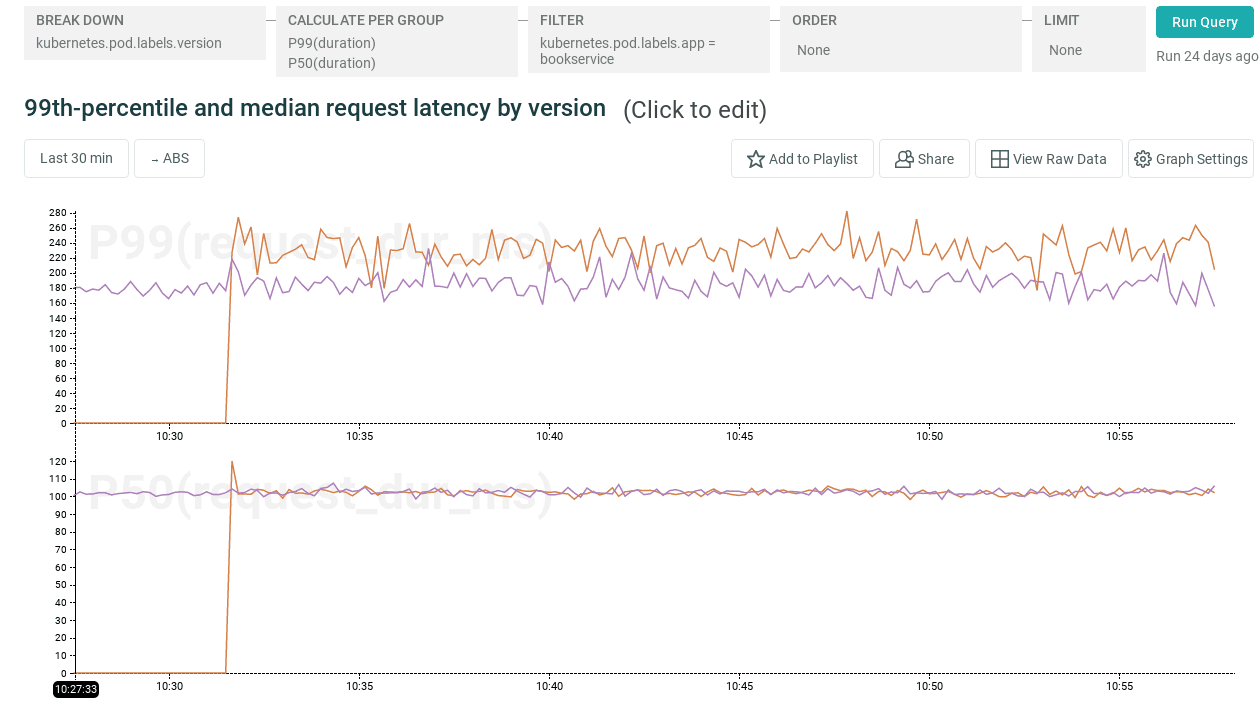
Oha! While median response time is essentially unchanged, it looks like there’s a regression in tail latency in this deployment.
What now?
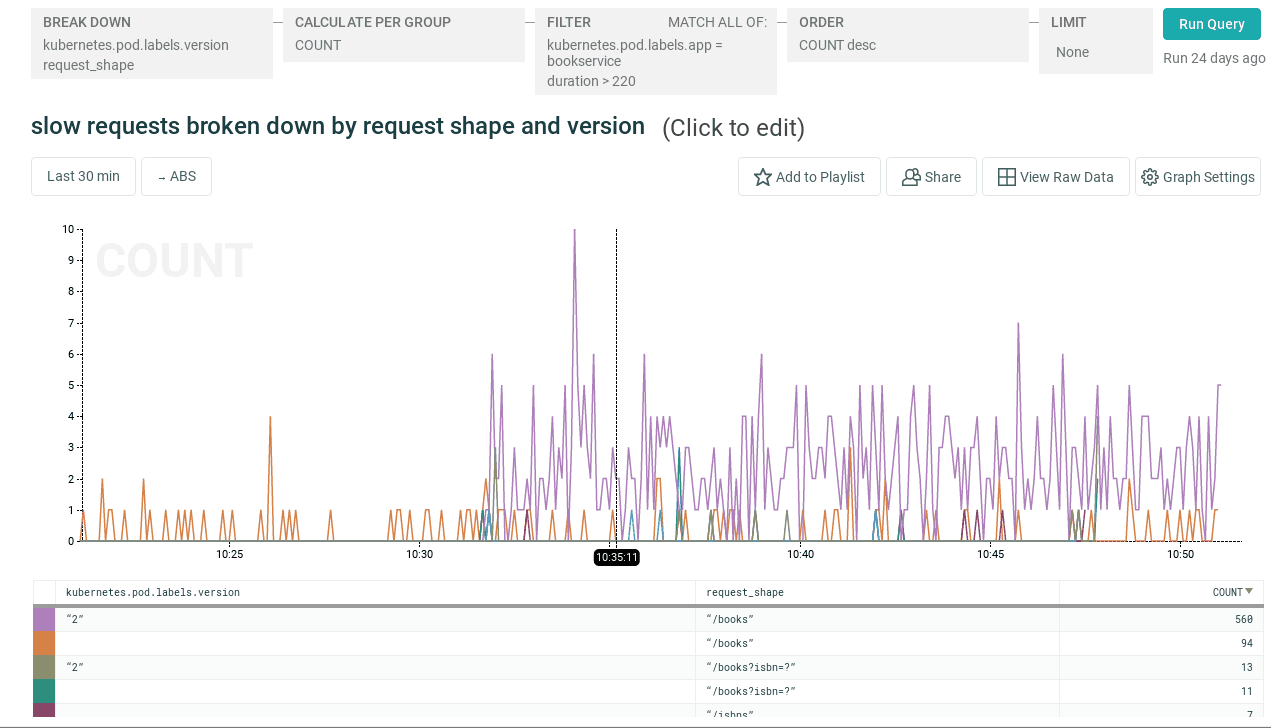
Well, as an operator, you might choose to roll back this deployment. But the ability to break down latency and error rates by endpoint, user ID or any other criterion you like makes identifying the source of the regression much faster. In this case, let’s restrict our query to only include slow requests, by filtering on duration > 220, and breaking down those slow requests by API endpoint in addition to app version. Now we can see that the regression specifically affects the /books endpoint in version 2 of the app, but not other endpoints.
In Conclusion
We’ve barely scratched the surface here. If you’re running Envoy (or a more traditional proxy such as HAProxy or NGINX), this level of visibility into individual requests is pretty much the bare minimum. But there’s a lot more you could be doing, including passing application-specific headers back into the access log, using Envoy’s request_id to follow requests across services, and more.
We’ll cover that in future posts — in the meantime, don’t hesitate to get in touch if you’d like to learn more!
Want to know more?
Talk to our team to arrange a custom demo or for help finding the right plan.