New Dataset Details and Schema Page Updates in Honeycomb
Happy Tuesday! We’ve got some Honeycomb improvements to share that I hope will make your day sweeter. Isn’t that soothing? Feel free to take a moment and remember to breathe. OK. Ready for some…

By: Rachel Perkins

Happy Tuesday! We’ve got some Honeycomb improvements to share that I hope will make your day sweeter.
Isn’t that soothing? Feel free to take a moment and remember to breathe. OK. Ready for some good news?
See Dataset details and descriptions right from the Query Page
If you’ve been querying your datasets in the last few days, you may have noticed this excellent new sidebar to the right of the Query Page:
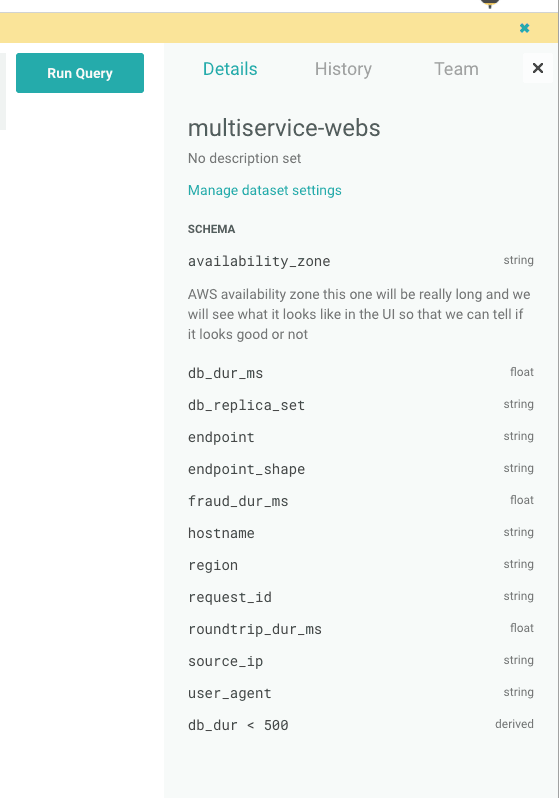
We’ve been working on ways to make Honeycomb even more eye-poppingly useful, and with this release we’ve surfaced dataset and column information in a new Details tab. Not only does the sidebar now list column names–but if you search for a column in your dataset, the sidebar filters for you so you don’t have to remember the exact name:
We know you like your space, so you can also click the X and collapse the sidebar to get it out of the way.
But wait! Where do those column descriptions come from?
Now you can click through from the Details tab to the Dataset Settings and edit that information directly:
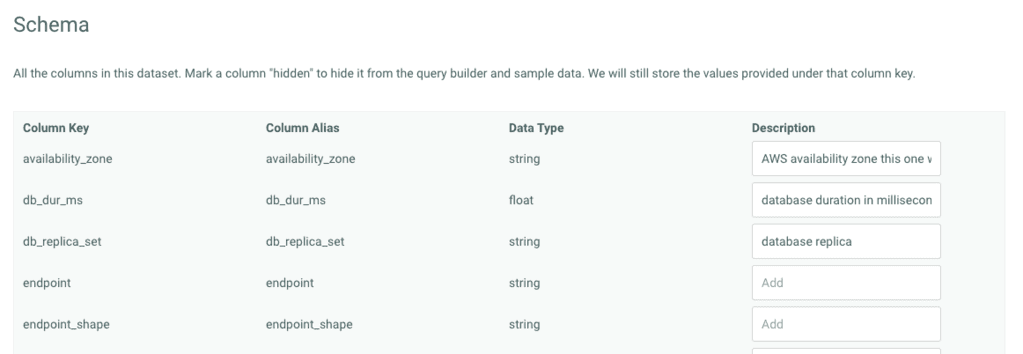
When you add a description for a column here, then locate and click on it in the sidebar from the Query page, you’ll see its description. If you’re a Team Owner, you can also mark a column “hidden.”
See your own History and your Teammates Activity
Don’t go alone, take this!

Back on the Query page, make sure to check out the History and Activity tabs on the sidebar as well–use the thumbnail graphs to remind yourself of a useful query you made a while back, or discover what your team has been up to.
Like to see the details? Give Honeycomb a try for free for 30 days!
Want to know more?
Talk to our team to arrange a custom demo or for help finding the right plan.