Observability Is About Confidence
Observability is important to understand what’s happening in production. But carving out the time to add instrumentation to a codebase is daunting, and often treated as a separate task to writing features. This means that we end up instrumenting for observability long after a feature has shipped, usually when there’s a problem with it and we’ve lost all context. What if we instead treated observability similarly to how we treat tests? We don’t submit code without a test, so let’s do the same with observability: treat it as part of the feature while the code is still fresh in our mind, with the benefit of being able to observe how the feature behaves in production.

By: Jamie Danielson
Observability is important to understand what’s happening in production. But carving out the time to add instrumentation to a codebase is daunting, and often treated as a separate task to writing features. This means that we end up instrumenting for observability long after a feature has shipped, usually when there’s a problem with it and we’ve lost all context.
What if we instead treated observability similarly to how we treat tests? We don’t submit code without a test, so let’s do the same with observability: treat it as part of the feature while the code is still fresh in our mind, with the benefit of being able to observe how the feature behaves in production.
The goal is to add instrumentation during development so it feels like a natural part of the development workflow. I recommend OpenTelemetry as an open standard, and that’s what I use in the example below for tracing an application.
If you know how to log, you know how to trace
Think of your log lines: there’s a lot of good information, but it can be hard to see correlations and how different logs relate to each other. Imagine if your log lines could show those correlations:
"2023-11-01T12:34:50.789Z INFO "GET /books/book-123"
   "2023-11-01T12:34:51.789Z INFO "handle request"
   "2023-11-01T12:34:52.789Z INFO "route request"
   "2023-11-01T12:34:53.789Z INFO "lookup item in cache"
       "2023-11-01T12:34:54.789Z INFO "fetch resource for book"
       "2023-11-01T12:34:55.789Z INFO "return book info"
"2023-11-01T12:34:56.789Z INFO "add book info to cache"Each of those logs can be structured a bit better:
{
 "timestamp": "2023-11-01T12:34:56.789Z"
 "level": "info",
 "message": "GET /books/book-123",
}To show relationships between spans in a trace, or in a single process, a trace includes a traceID that is present on all spans in the trace, indicating a correlation between those spans. Spans also have IDs, with a parent span ID to represent the hierarchy of operations in the trace.
{
 "traceId": "2e47303e0997c98ecedd1aa5c589dbc0",
 "trace.span_id”: "96778c41814e9d81",
 "timestamp": "2023-11-01T12:34:50.789Z",
 "level": "info",
 "message": "GET /books/book-123",
}
{
 "traceId": "2e47303e0997c98ecedd1aa5c589dbc0",
 "trace.parent_id”: "96778c41814e9d81",
 "trace.span_id”: "b7c2a707a3fffb48",
 "timestamp": "2023-11-01T12:34:51.789Z",
 "level": "info",
 "message": "handle request",
}
...So if you think about it… a trace is just a fancy log.
Start small and get value quickly
Automatic instrumentation allows you to instrument your code without actually touching your code. Automatic instrumentation includes instrumentation libraries for popular frameworks and libraries in different languages.
For applications running in Kubernetes, the OpenTelemetry Operator is a great way to get started as it injects automatic instrumentation for you. Alternatively, you can set up OpenTelemetry in code, which also generally allows for more fine-tuning. As you see what is provided by the automatic instrumentation, you can make adjustments based on what data seems valuable, and what may need changing. You can also tell where gaps in visibility may be.
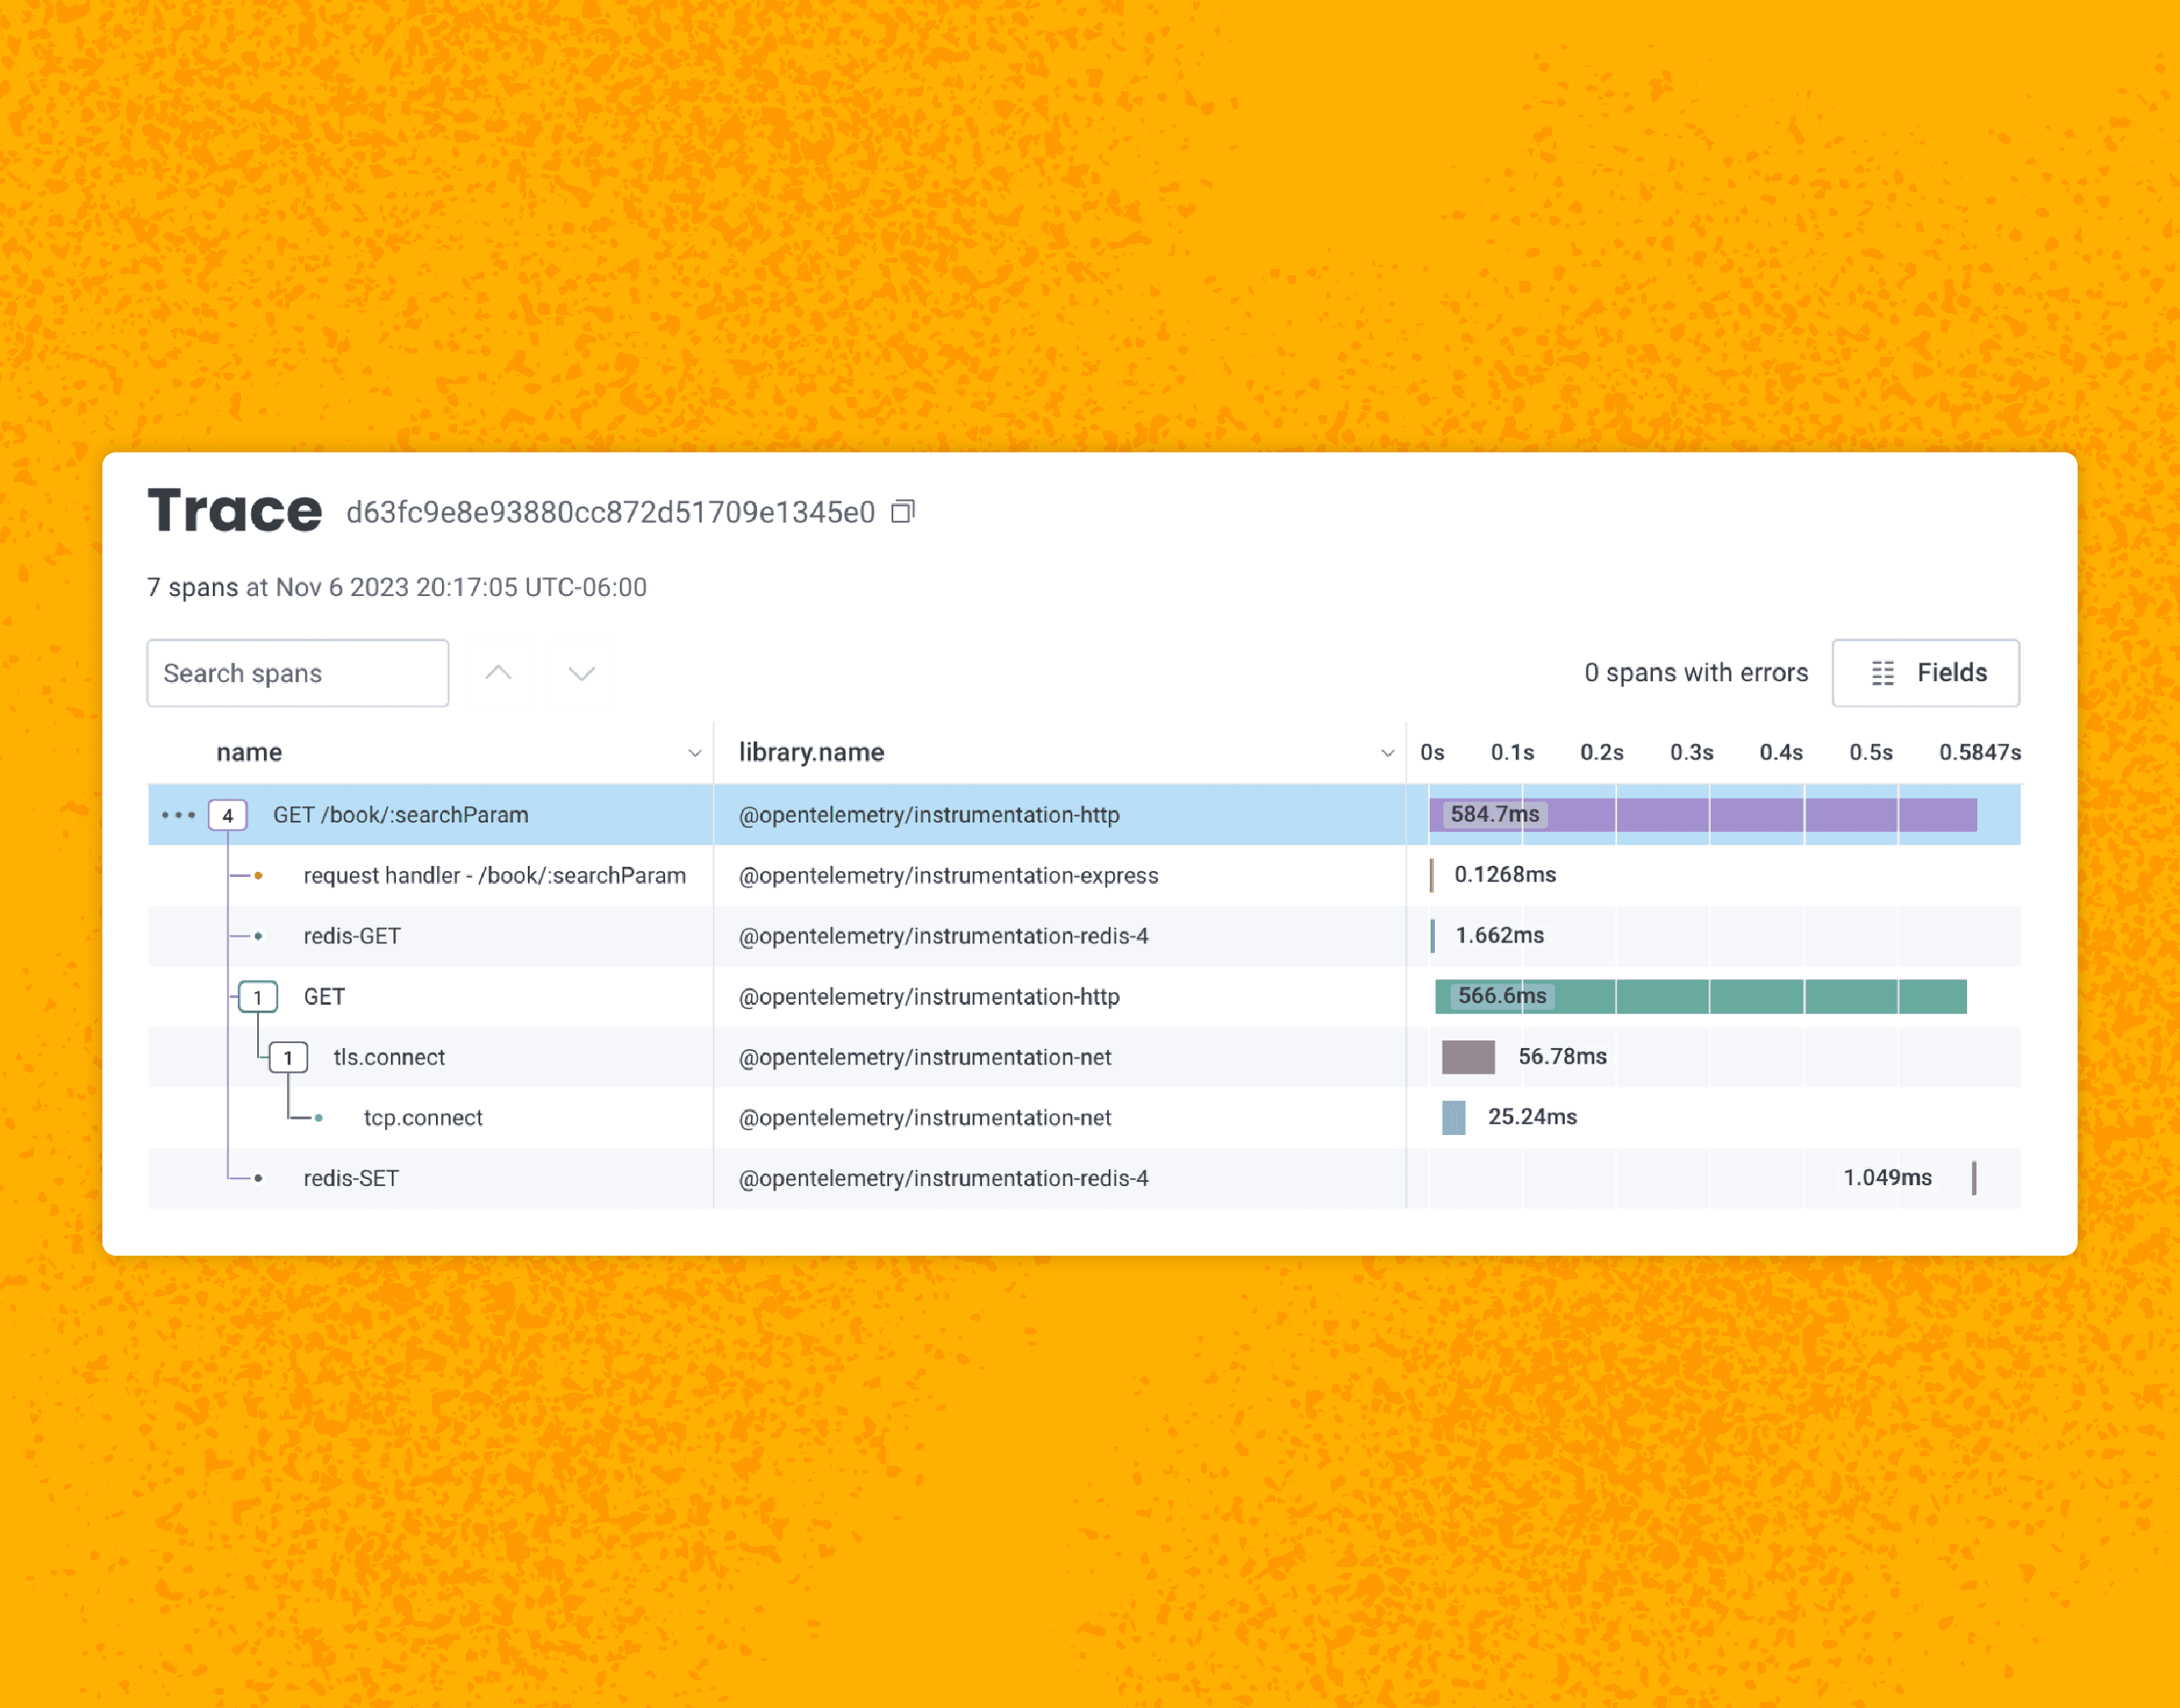
After enabling automatic instrumentation in Node and disabling some instrumentations that aren’t relevant to what I need, I can see a trace depicting the life cycle of this request, including setting data into a newly created cache:
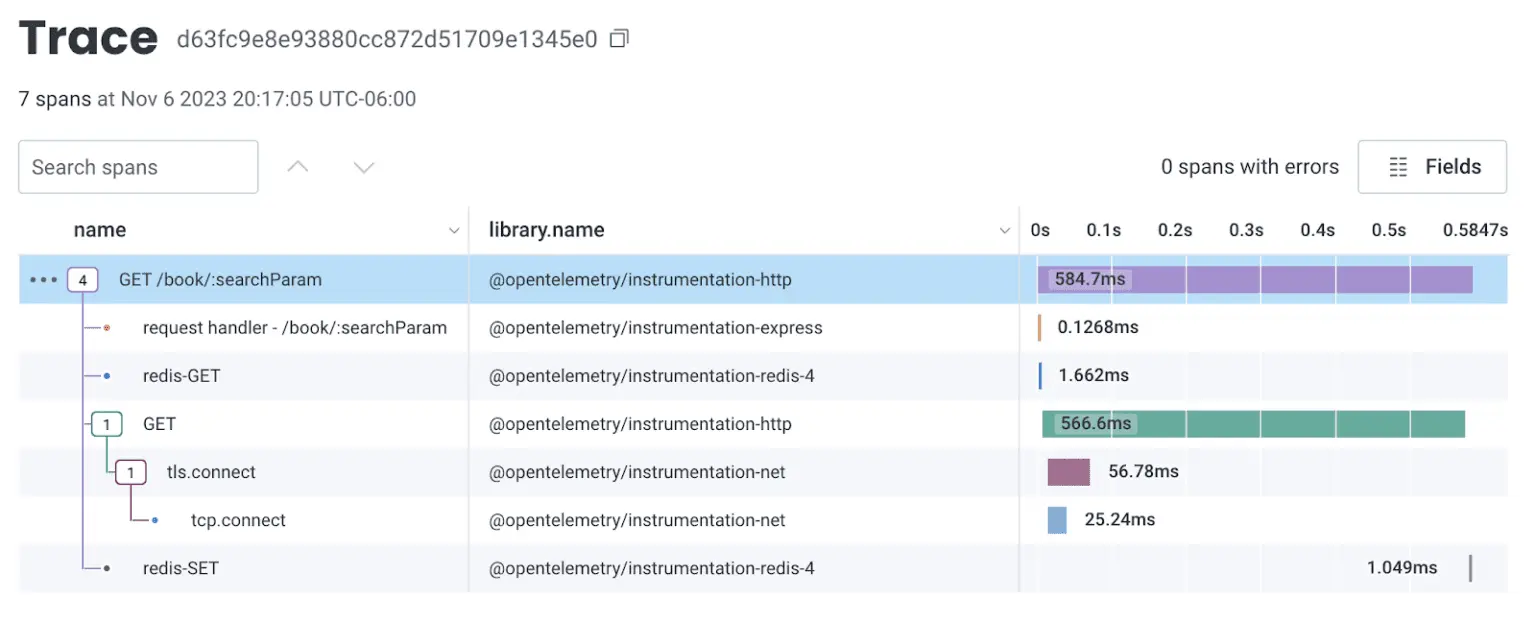
By standardizing the data with attributes instead of only blobs of text, it becomes easier to slice and dice the data. And by using OpenTelemetry instrumentation to trace an HTTP request, for example, you also get more rich information out of the box:
{
 "traceId": "2e47303e0997c98ecedd1aa5c589dbc0",
 "trace.span_id": "96778c41814e9d81",
 "timestamp": "2023-11-01T12:34:56.789Z",
 "name": "GET /books/:searchParam",
 "http.method": "GET",
 "http.route": "/books/:searchParam",
 "http.target": "/books/book-123",
 "http.status_code": "200",
 "http.status_text": "OK",
...
}
{
 "traceId": “2e47303e0997c98ecedd1aa5c589dbc0”,
 "trace.parent_id": "96778c41814e9d81",
 "trace.span_id": "b7c2a707a3fffb48",
 "timestamp": "2023-11-01T12:35:56.789Z",
 ...
}Tying things together
Automatic instrumentation is a great way to get started and quickly see what’s happening in your system. To get even more value based on what is important to you in the context of your specific system, it’s helpful to add manual instrumentation—also known as custom instrumentation—which involves changes to your source code, like adding attributes or creating new spans.
As you’re writing code, you will commonly find yourself adding a log—either to save somewhere later, or logging to the console for quick debugging. Those are the places you want to add extra instrumentation, either as an attribute to a current span, or a new span for specific functionality.
For example, if you add caching logic to an application, the end result of the application call from the end user’s perspective shouldn’t change much at all, aside from (ideally) better performance. But when working on that code, you want to make sure your caching logic is working as expected, and that you can analyze production results once the code is deployed.
When you find yourself logging to the console, capture the current span and add extra attributes:
const activeSpan = trace.getActiveSpan();
if (cacheResults) {
 console.log('Data retrieved from the cache');
 activeSpan?.setAttribute('app.in_cache', true);
 results = JSON.parse(cacheResults);
 res.send({
   fromCache: true,
   data: results,
 });
} else {
 console.log('Data not retrieved from the cache');
 activeSpan?.setAttribute('app.in_cache', false);
 next();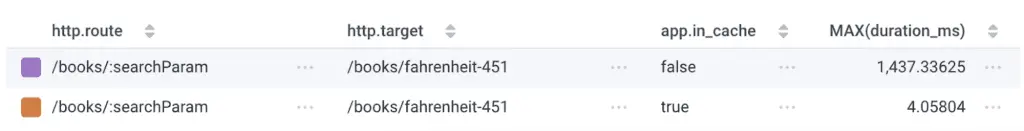
}While automatic instrumentation is typically higher-level, showing connections between Service A and Service B, manual instrumentation allows you to further break down A and B and add more context and detail based on your specific application. After updating the caching logic to include these new attributes, you can see now whether those code paths are hit, and also track the performance impact on cached vs. non-cached results.
Observability is about confidence
Observability helps build confidence in what you’re working on, and helps you gain context as to how your code fits in with the rest of the system. You can confirm whether your changes have the impact you expect, and predict how things should behave in production—which will make it easier to debug later if things do behave in unexpected ways. We at Honeycomb have resolved incidents and near-incidents based solely on the instrumentation of our services.
People often see instrumentation and observability as a “nice to have,” and also have the perception that it adds too much extra work on top of their regular work. Much of this just requires a perspective shift by viewing instrumentation as something you do when writing your code, but in a different format. It has become commonplace to write tests, and it is slowly becoming more acceptable to write instrumentation as part of feature work.
If you’d like to learn more about instrumentation, please continue your journey with these helpful links:
https://opentelemetry.io/docs/kubernetes/operator/automatic/
https://opentelemetry.io/docs/instrumentation/js/getting-started/nodejs/
https://opentelemetry.io/docs/instrumentation/go/getting-started/
Here’s my talk, if you’d like to watch it:
Here are the slides for my KubeCon talk.
Want to know more?
Talk to our team to arrange a custom demo or for help finding the right plan.