A to Z With Observability and OpenTelemetry
“How do I get started on instrumentation with OpenTelemetry, while also following best practices for the long-term?” This article is all about taking you from A to Z on instrumentation. Learn how to create immediate observability and see traces in your application right away, without changing code—and more!

By: Brian Langbecker
How do you go from A to Z with observability and OpenTelemetry? This post answers a question we hear often: “How do I get started on instrumentation with OpenTelemetry, while also following best practices for the long-term?”
This article is all about taking you from A to Z on instrumentation. This will help you:
- Create immediate observability and see traces in your application right away, without changing code
- Add attributes and spans using environmental attributes, without changing code
- Add richer context with custom instrumentation
- Plan the timeline of your observability journey at a steady, achievable pace that connects with your business needs
We will use a simple greeting service application written in Node.js to understand the journey. You can find the pre-instrumented state here. Use the project named “node-before-otel.”
Things you will need:
- Node.js installed
- NPM
- Honeycomb account
- Honeycomb API key (here’s a Free account)
- Docker (highly suggested but optional)
The real instrumentation journey
Before we begin, let’s talk about the real instrumentation journey.
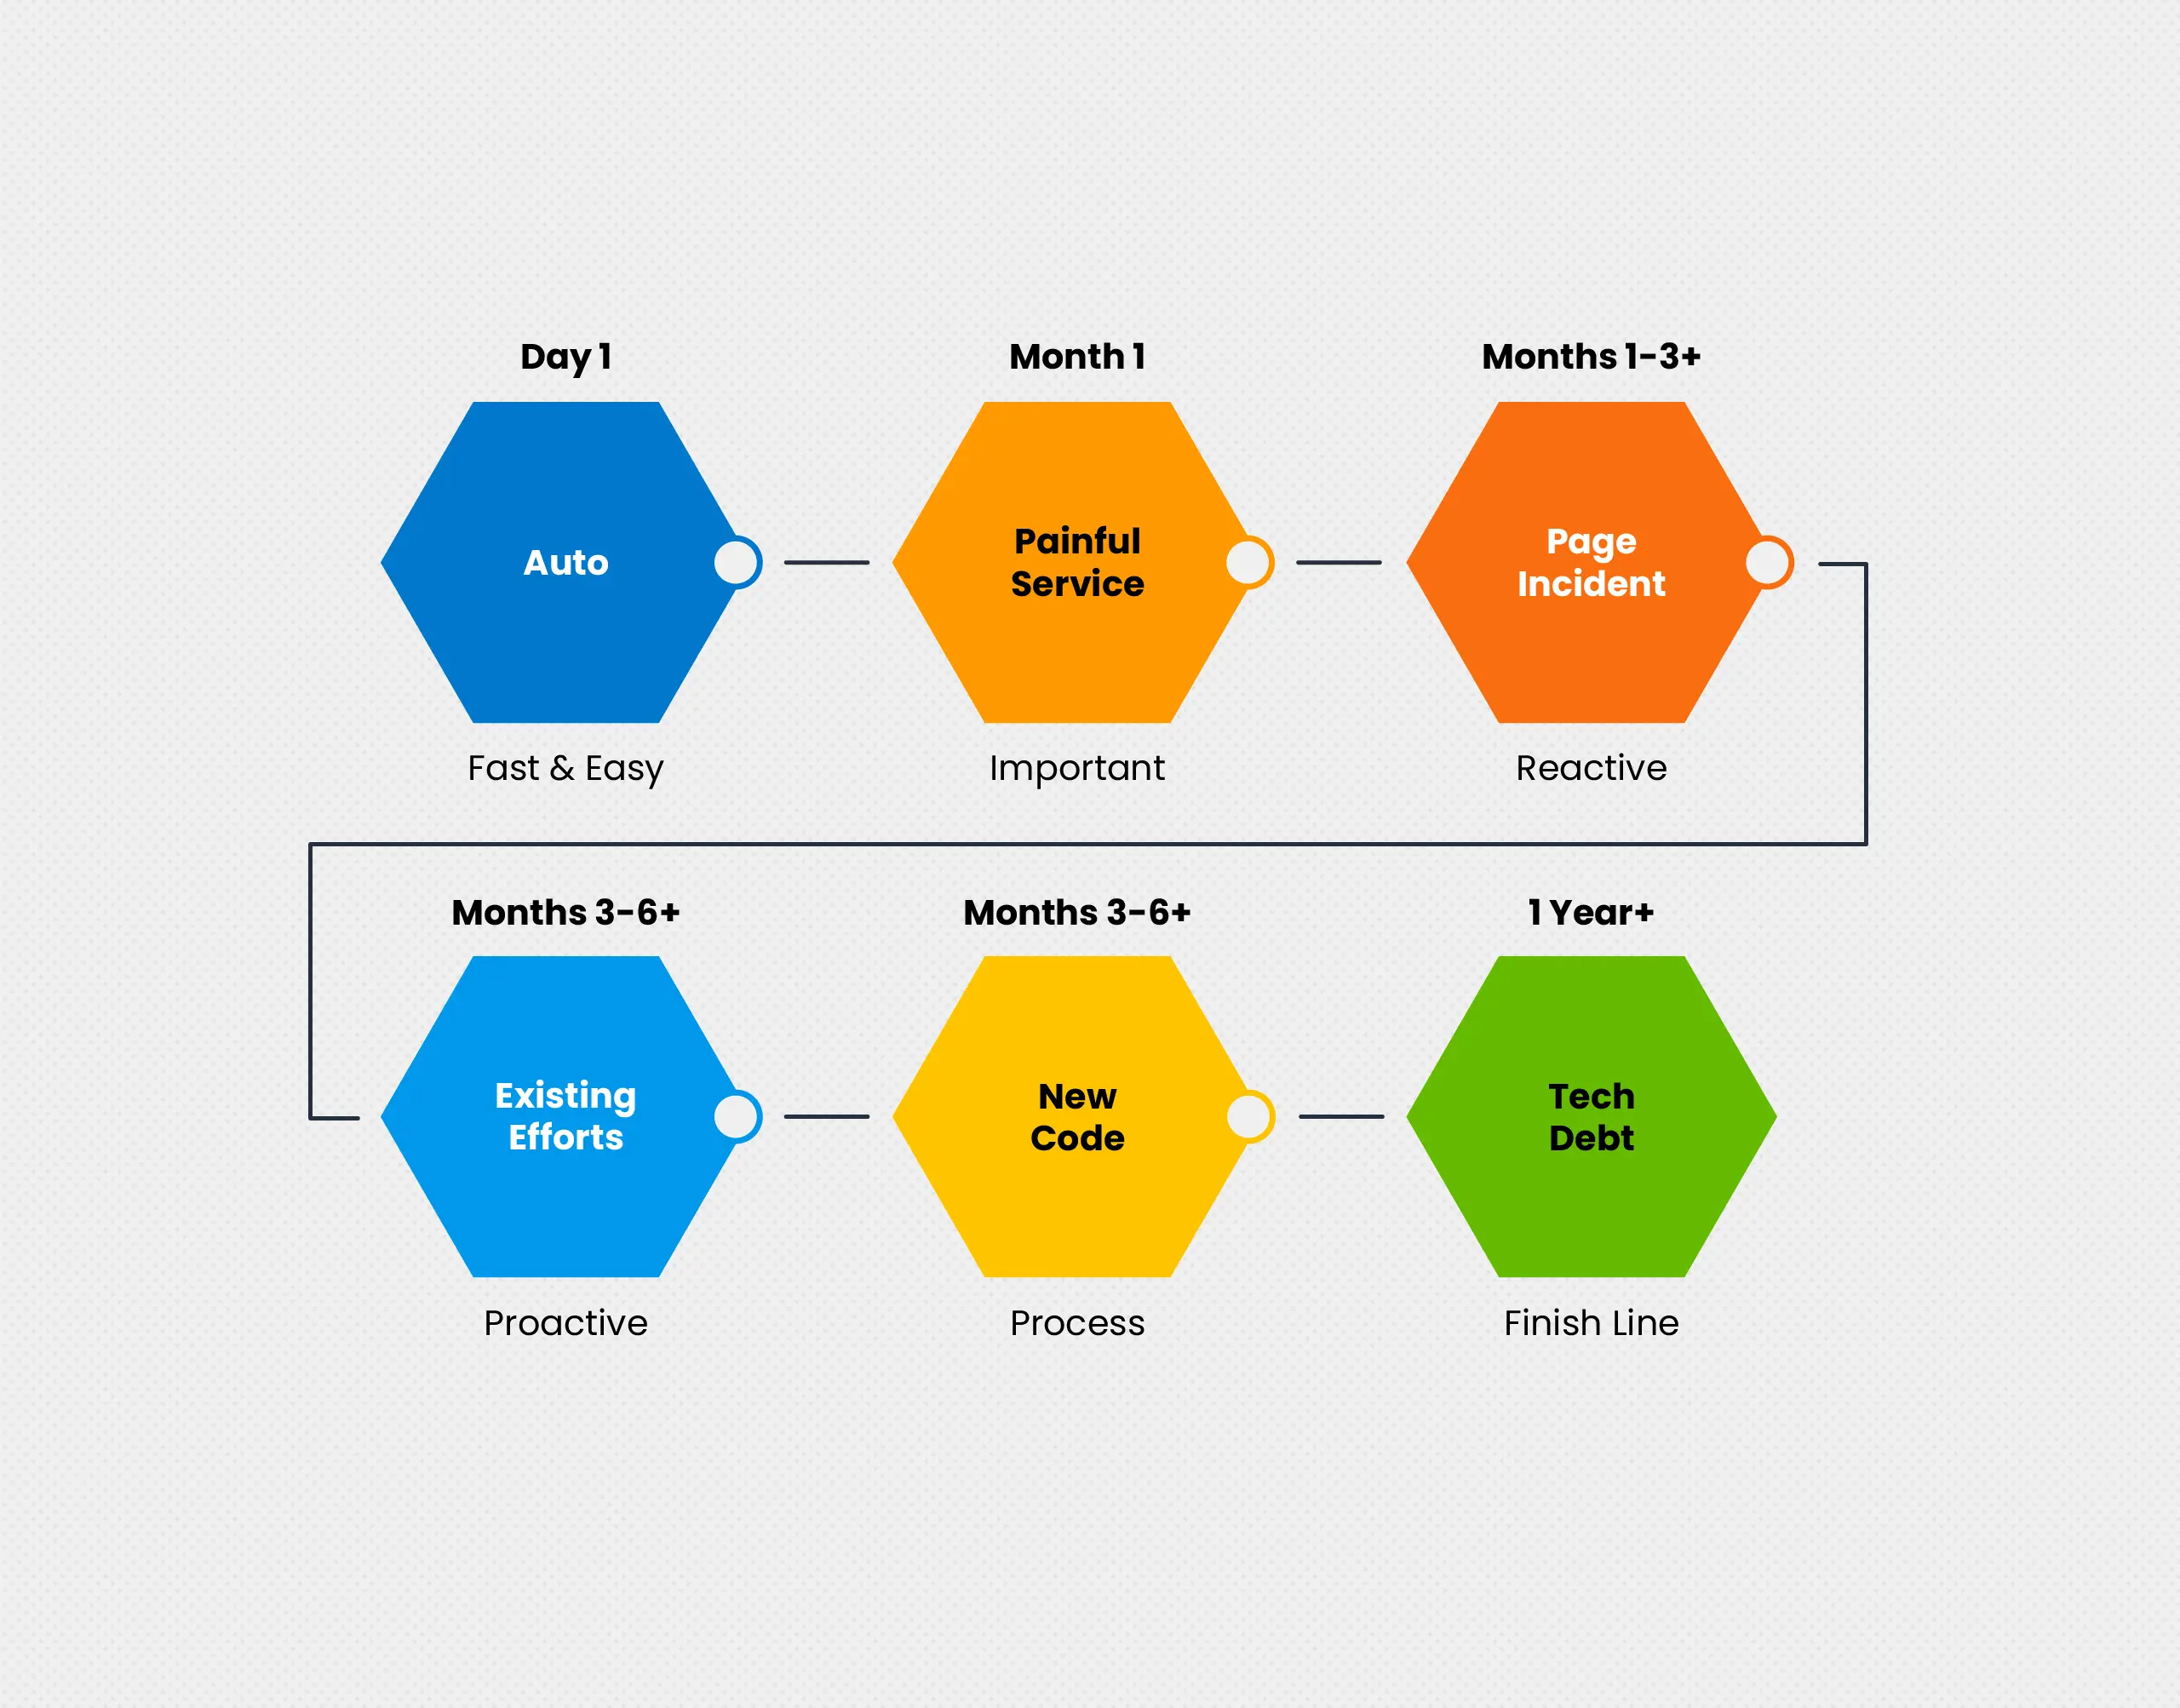
Note: The inspiration for this article was based on the diagram below, as well as the attributes diagram further down. Michael Sickles created these diagrams and their accompanying talk track at Honeycomb.
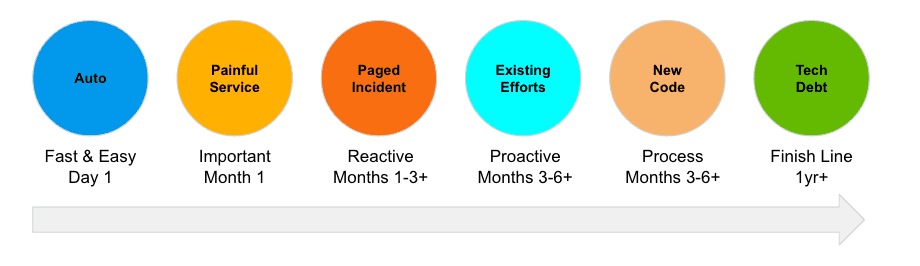
Here’s a brief summary of each step:
Day 1: Locate a simple, fast, and easy service to instrument just get your feet wet and get data flowing in Honeycomb.
Month 1: Find a painful or critical service that requires deeper observability.
Tips for identifying a painful or critical service:
Is there a service that always shows up in alerts or paged incidents? Is it critical to core operations, but not always clear if it functions correctly when anomalies occur or when it is under load? Does it lack visibility? This is a prime candidate for instrumentation.
Month 1-3: Use a critical incident to assess your instrumentation needs. Add custom instrumentation to answer these needs.
Questions to ask yourself:
Did you have the right telemetry in place?
What questions were you unable to answer, but would have been valuable?
Month 3-6+: Build o11y into existing efforts at your organization. What major efforts is your engineering team undertaking? How can o11y play a role?
Examples:
Is there a migration in progress? Observability can help you assess true progress by measuring if the system is working the same, better, or worse after migration based on established criteria.
Are you splitting a monolith? Observability can help you measure your changes from a large monolith to smaller microservices by helping you understand how the system works before and after.
Month 3-6+: Proactively build instrumentation into your process. As you add new code, plan the instrumentation that will provide value.
Process:
When adding a PR, make sure all engineers ask whether the instrumentation in place is adequate.
Year 1+: You have the opportunity to address tech debt. This can sometimes be a lofty goal, balanced against new code efforts and critical new features. If some parts of your codebase are showing their age, evaluate what instrumentation can help you understand how legacy functionality is performing—better or worse over time. Take the opportunity when working in code in that area to add that instrumentation.
Let’s get started with our example
Start by pulling down our repo here. Use the project named “node-before-otel.” Change into the frontend directory and ensure you have the following libraries or more recent versions.
npm install --save \
    @grpc/grpc-js@1.4.4 \
    @opentelemetry/api@1.0.0 \
    express \
    @opentelemetry/sdk-node@0.27.0 \
    @opentelemetry/exporter-trace-otlp-proto@0.27.0 \
    @opentelemetry/auto-instrumentations-node@0.27.0 \
@grpc/grpc-jsAdd the following tracing.jsto the frontend service:
// tracing.js
'use strict';

const { NodeSDK } = require('@opentelemetry/sdk-node');
const { getNodeAutoInstrumentations } = require('@opentelemetry/auto-instrumentations-node');
const { OTLPTraceExporter } = require("@opentelemetry/exporter-trace-otlp-proto");
const { credentials } = require("@grpc/grpc-js");


// Name your service name, also can pulled from environment variable
const OTEL_SERVICE_NAME = process.env.OTEL_SERVICE_NAME || 'node-year-service';

// The Trace Exporter exports the data to Honeycomb and uses
// the environment variables for endpoint, service name, and API Key.
const traceExporter = new OTLPTraceExporter({
  credentials: credentials.createSsl(),
});

const sdk = new NodeSDK({
  traceExporter,
  instrumentations: [getNodeAutoInstrumentations()]
});

sdk
  .start()
  .then(() => console.log('Tracing initialized'))
  .catch((error) => console.log('Error initializing tracing', error));

process.on('SIGTERM', () => {
  sdk
    .shutdown()
    .then(() => console.log('Tracing terminated'))
    .catch((error) => console.log('Error terminating tracing', error))
    .finally(() => process.exit(0));
});
Set up your environment variables:
export OTEL_EXPORTER_OTLP_ENDPOINT="https://api.honeycomb.io"
export OTEL_EXPORTER_OTLP_HEADERS="x-honeycomb-team=your-api-key"
export OTEL_SERVICE_NAME="frontend-service"
Or, if your account is Honeycomb Classic, use:
export OTEL_EXPORTER_OTLP_HEADERS="x-honeycomb-team=your-api-key,x-honeycomb-dataset=greeting-service"Update package.jsonto read:
"scripts": {
  "dev": "nodemon main.js",
  "start": "node -r ./tracing.js main.js",
  "test": "echo \"Error: no test specified\" && exit 1"
}Update your Dockerfile:
CMD [ "node", "-r", "./tracing.js", "main.js" ]It’s that easy! No code changes at all—but you now have basic auto instrumentation done. ✅
Run the auto-instrumented service
In the main directory, run this. This is the easy way!
docker-compose up --buildIf you’d prefer to run the app on your local machine, start each service, one at a time:
npm startOnce up and running, send a curl message:
curl localhost:7000/greetingYou should see something like this:
curl localhost:7000/greeting
Hello liam, what's good?Next, go to your Honeycomb UI.
- In the left sidebar, navigate New Query.
- Under VISUALIZE, enter HEATMAP(duration_ms).
- In the heatmap results, click on a dot to get a trace.
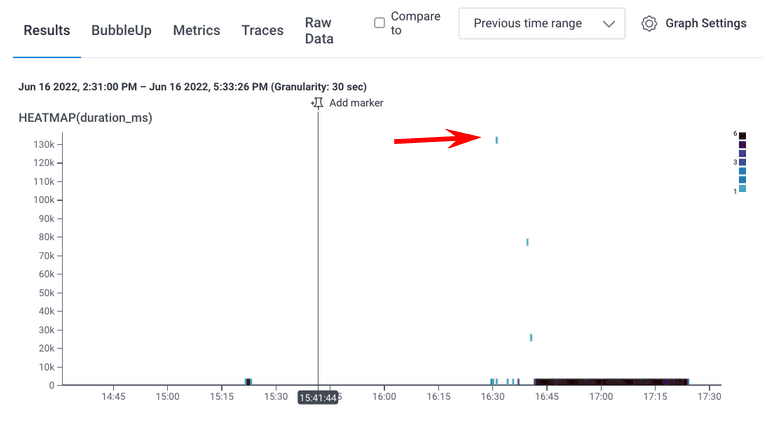
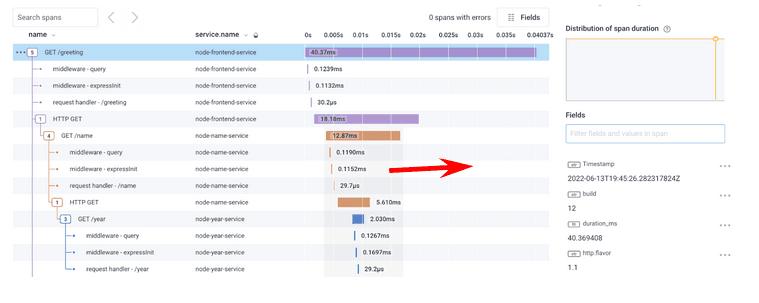
Here’s the example trace:
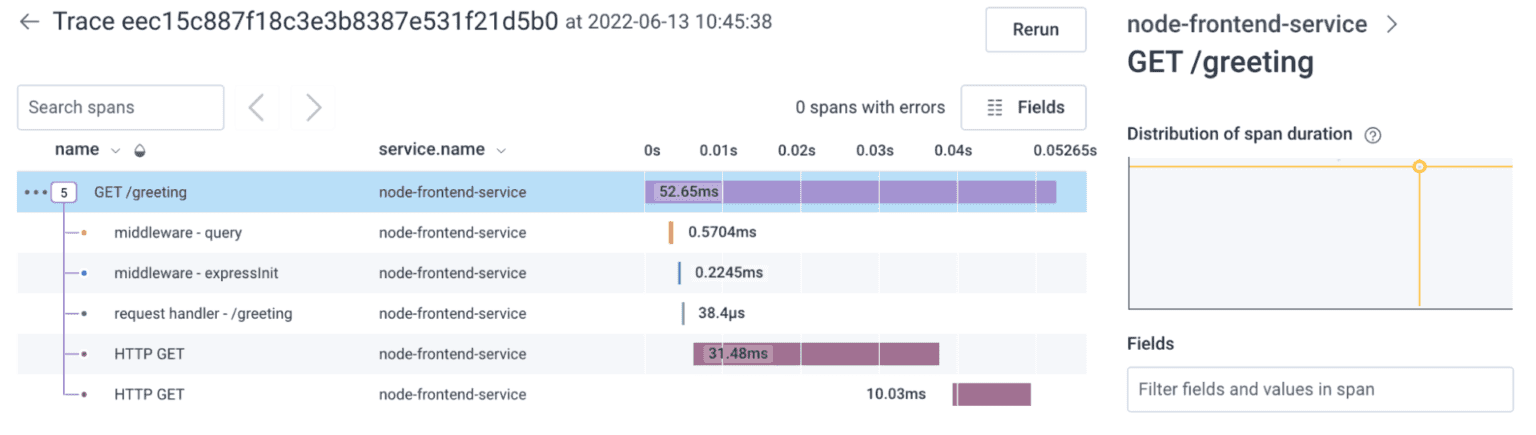
Woohoo! You leveraged automatic instrumentation and you now have a basic trace. With no code changes at all, you now have a basic view of all the services that your curl request ran through—an end-to-end view of your system in a trace.
Optional additional steps. Go into each project:
- Install the necessary support JavaScript packages
- Copy the tracing.js file into your project
- Update your package.json
- Update your Dockerfile
- Run each service or Docker Compose
- Send a curl call
- Examine the results in Honeycomb
What’s next?
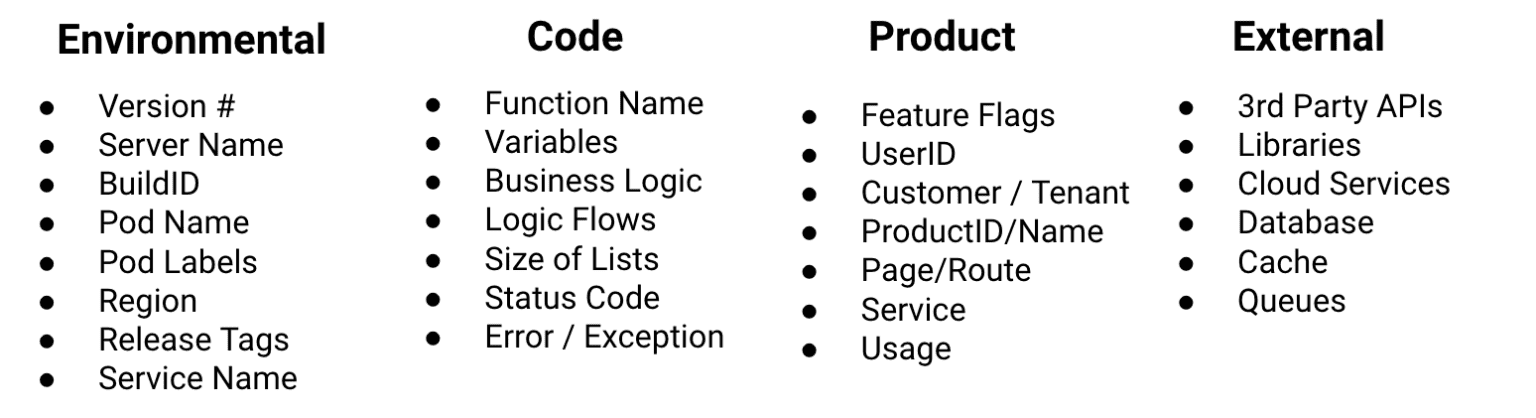
You’ll need to consider the spans and attributes you can add to enrich the context you can see and query in Honeycomb. Here are some common fields that customers add (from the easiest on the left, to the most complicated on the right):
Start with the easy ones. Here’s how to add a version and build using environment variables:
export OTEL_RESOURCE_ATTRIBUTES="version=1.0,build=12"Start the following steps:
- Run Docker Compose, or run each service in its directory
- Make the curl calls
- Log in to Honeycomb and find your trace (as shown above)
In the trace, you can now see the build and version number on every span. You’ve still made no code changes up to this point!
Deeper context with custom attributes and spans
So far, you’ve done everything through auto-instrumentation and simple configuration. Sometimes, this may be enough—but often, you need more context.
What if you have a paged incident, and realize you want more information? Instead of staring at the code or jumping into the log file, which is hard on the brain to change context between tools, you can create better observability with custom attributes and spans.
Custom attributes and spans help you get more specific answers to your questions, faster.
Let’s add three spans and three custom attributes total (one for each span), in our example. If you want to skip the work, use the project named “node-after-otel.”
Update the Frontend’s main.jsfile with the following:
const opentelemetry = require('@opentelemetry/api');

...

app.get('/greeting', async (req, res) => {
  try {
    const greetingSpan = opentelemetry.trace.getTracer('default').startSpan('Preparing Greeting');
    greetingSpan.end();
    const nameSpan = opentelemetry.trace.getTracer('default').startSpan('call /name');
    const name = await getName(nameUrl);
    nameSpan.setAttribute("person name", name);
    nameSpan.end();

    const messageSpan = opentelemetry.trace.getTracer('default').startSpan('call /message');
    const message = await getMessage(messageUrl);
    messageSpan.setAttribute("message", message);
    messageSpan.end();

    res.send(`Hello ${name}, ${message}`);
  } catch (error) {
    console.error(error);
  }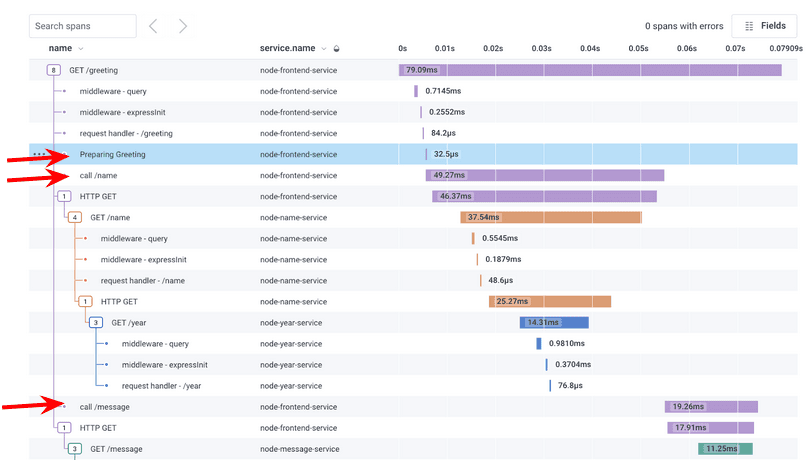
});Spin up the service and make some curl calls. You will now see more goodness!
There are three additional spans:
- Prepare greeting
- Call name
- Call message
You’ll also see new attributes in the fields, such as the message you sent.
Extra credit: Add spans and attributes to other services. If you want to see the final work product, use the project named “node-before-otel-extra-credit.”
What have you learned?
You created immediate value with auto-instrumentation and can see rich traces, right away, without changing code! You’ve added attributes and spans and learned that you can add environmental attributes easily. If you want to go deeper, you can add custom attributes to suit the needs of your team.
You’ve taken the first steps but you aren’t done yet (even though you are just about done with this article). Every time you have a paged incident or you add new code, you may want to ask: do I have the right telemetry in place?
This is your journey, and Honeycomb is here to partner with you on it! Keep iterating and fine-tuning. Our end results are here.
Best wishes!
Want to know more?
Talk to our team to arrange a custom demo or for help finding the right plan.