User Tips: Sending NGINX Logs to Honeycomb
You use NGINX as a proxy for your application, and you want to leverage Honeycomb’s amazing features to help make sense of the traffic data. Have no fear: Honeycomb has a solution just for you.

By: Guest Blogger
Written by Andrew Puch and Brian Langbecker
You use NGINX as a proxy for your application, and you want to leverage your favorite features in Honeycomb to help make sense of the traffic data. Have no fear: Honeycomb is more than capable and ready to help!
Things you will need:
- Node.js with NPM (to use a sample application)
- Honeycomb account
- Honeycomb API key (here’s a Free account)
- Docker.
Before you start with the instructions, let’s discuss a lightweight tool called Honeytail. This utility will tail log files, parse the various formats, and send the data to Honeycomb. This is the ✨ secret sauce ✨ to ingesting NGINX logs into Honeycomb.
For the sample today, we have a NodeJS Express application that uses Redis, MySQL, and NGINX to receive requests. Here’s the sample code.
Setting Honeytail Up
Begin by cloning this Honeytail repository.
Next, change into the honeytail directory and edit the following environment variables and command in the Dockerfile:
ENV HONEYCOMB_WRITE_KEY NULL
ENV NGINX_LOG_FORMAT_NAME combined
ENV NGINX_CONF /etc/nginx.conf
ENV HONEYCOMB_SAMPLE_RATE 1
ENV NGINX_ACCESS_LOG_FILENAME access.log
CMD [ "/bin/sh", "-c", "honeytail \
--parser nginx \
--writekey $HONEYCOMB_WRITE_KEY \
--file /var/log/nginx/$NGINX_ACCESS_LOG_FILENAME \
--dataset nginx \
--samplerate $HONEYCOMB_SAMPLE_RATE \
--nginx.conf $NGINX_CONF \
--nginx.format $NGINX_LOG_FORMAT_NAME \
--tail.read_from end" ]
Your HONEYCOMB_WRITE_KEY is the API key from your Honeycomb Account. Replace NULL with this value above. The key can be found here. You will use the NGINX parser to read your log file, though the regex parser can be useful for these types of log files.
Update NGINX_CONF to /tmp/nginx.conf since it is a shared Docker volume.
Update NGINX_ACCESS_LOG_FILENAME to /tmp/access.log since it is a shared Docker volume.
In the same file, you want to edit the CMD:
--file $NGINX_ACCESS_LOG_FILENAME \
--dataset YOUR_DATASET_HERE \
Pick a dataset file name, for instance, nginx. Lastly, build your Honeytail Docker image:
docker build -t honeytail .
You now have a Docker container with Honeytail that you can use later on.
A bit more on NGINX
In your setup, by specifying combined as your format and not specifying a specific log_format, Honeytail will use the default one below for parsing the log lines.
// the combined log format is predefined by nginx
const combinedLogFormat = `$remote_addr - $remote_user [$time_local] "$request" $status $body_bytes_sent "$http_referer" "$http_user_agent"`
If you have custom logging turned for NGINX, you will need to specify your log format. See here for more details.
Setting up our test application
Clone this repo.
Next, change into the honeytail-tracing-logs-demo directory. Install the dependencies:
npm install
Next, you will set up your environment by copying your .env.sample to .env:
cp .env.sample .env
Update the details by using the API key and dataset name from above. See below:
OTEL_EXPORTER_OTLP_ENDPOINT="https://api.honeycomb.io"
OTEL_EXPORTER_OTLP_HEADERS="x-honeycomb-team=your-key"
OTEL_SERVICE_NAME="your-service-name"
Please note that you may need to add x-honeycomb-dataset in your headers if you are running Honeycomb Classic. For example, you can set it to test-app. This is where the Honeycomb traces will be sent. In this blog, we focus on NGINX.
Run the docker-compose via make:
make up
Now you have a running set of Docker containers with NGINX, Honeytail, MySQL, Redis, and our application. Time to generate some load and see how your data looks in Honeycomb.
Start load testing and evaluating results
Run the load script and define how many requests per second you want:
./load.sh 5
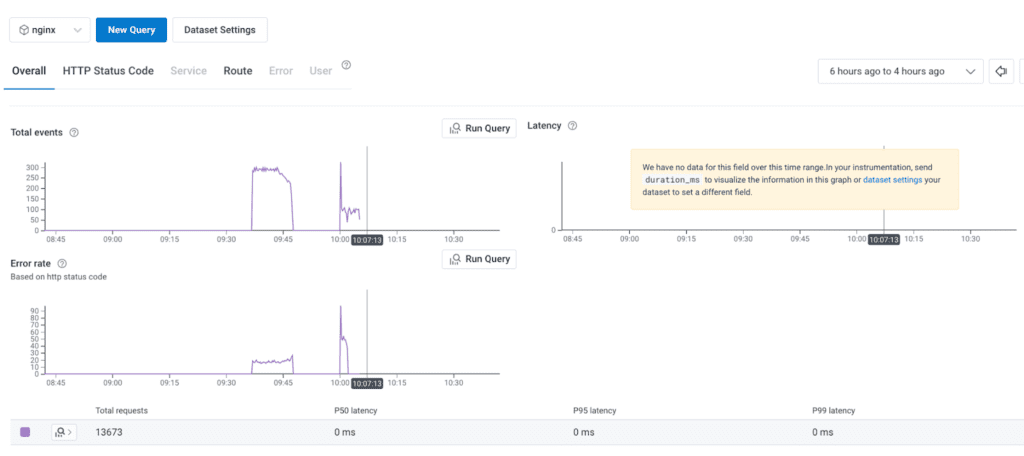
Go to the Honeycomb UI and update the dataset to nginx via the pull-down in the upper left.
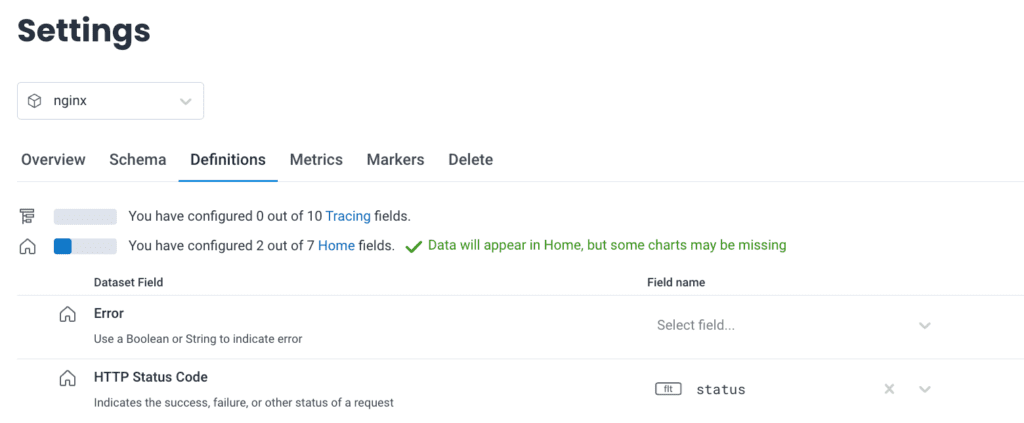
Note: For the errors to show above, you will need to modify your schema to use status. See below:
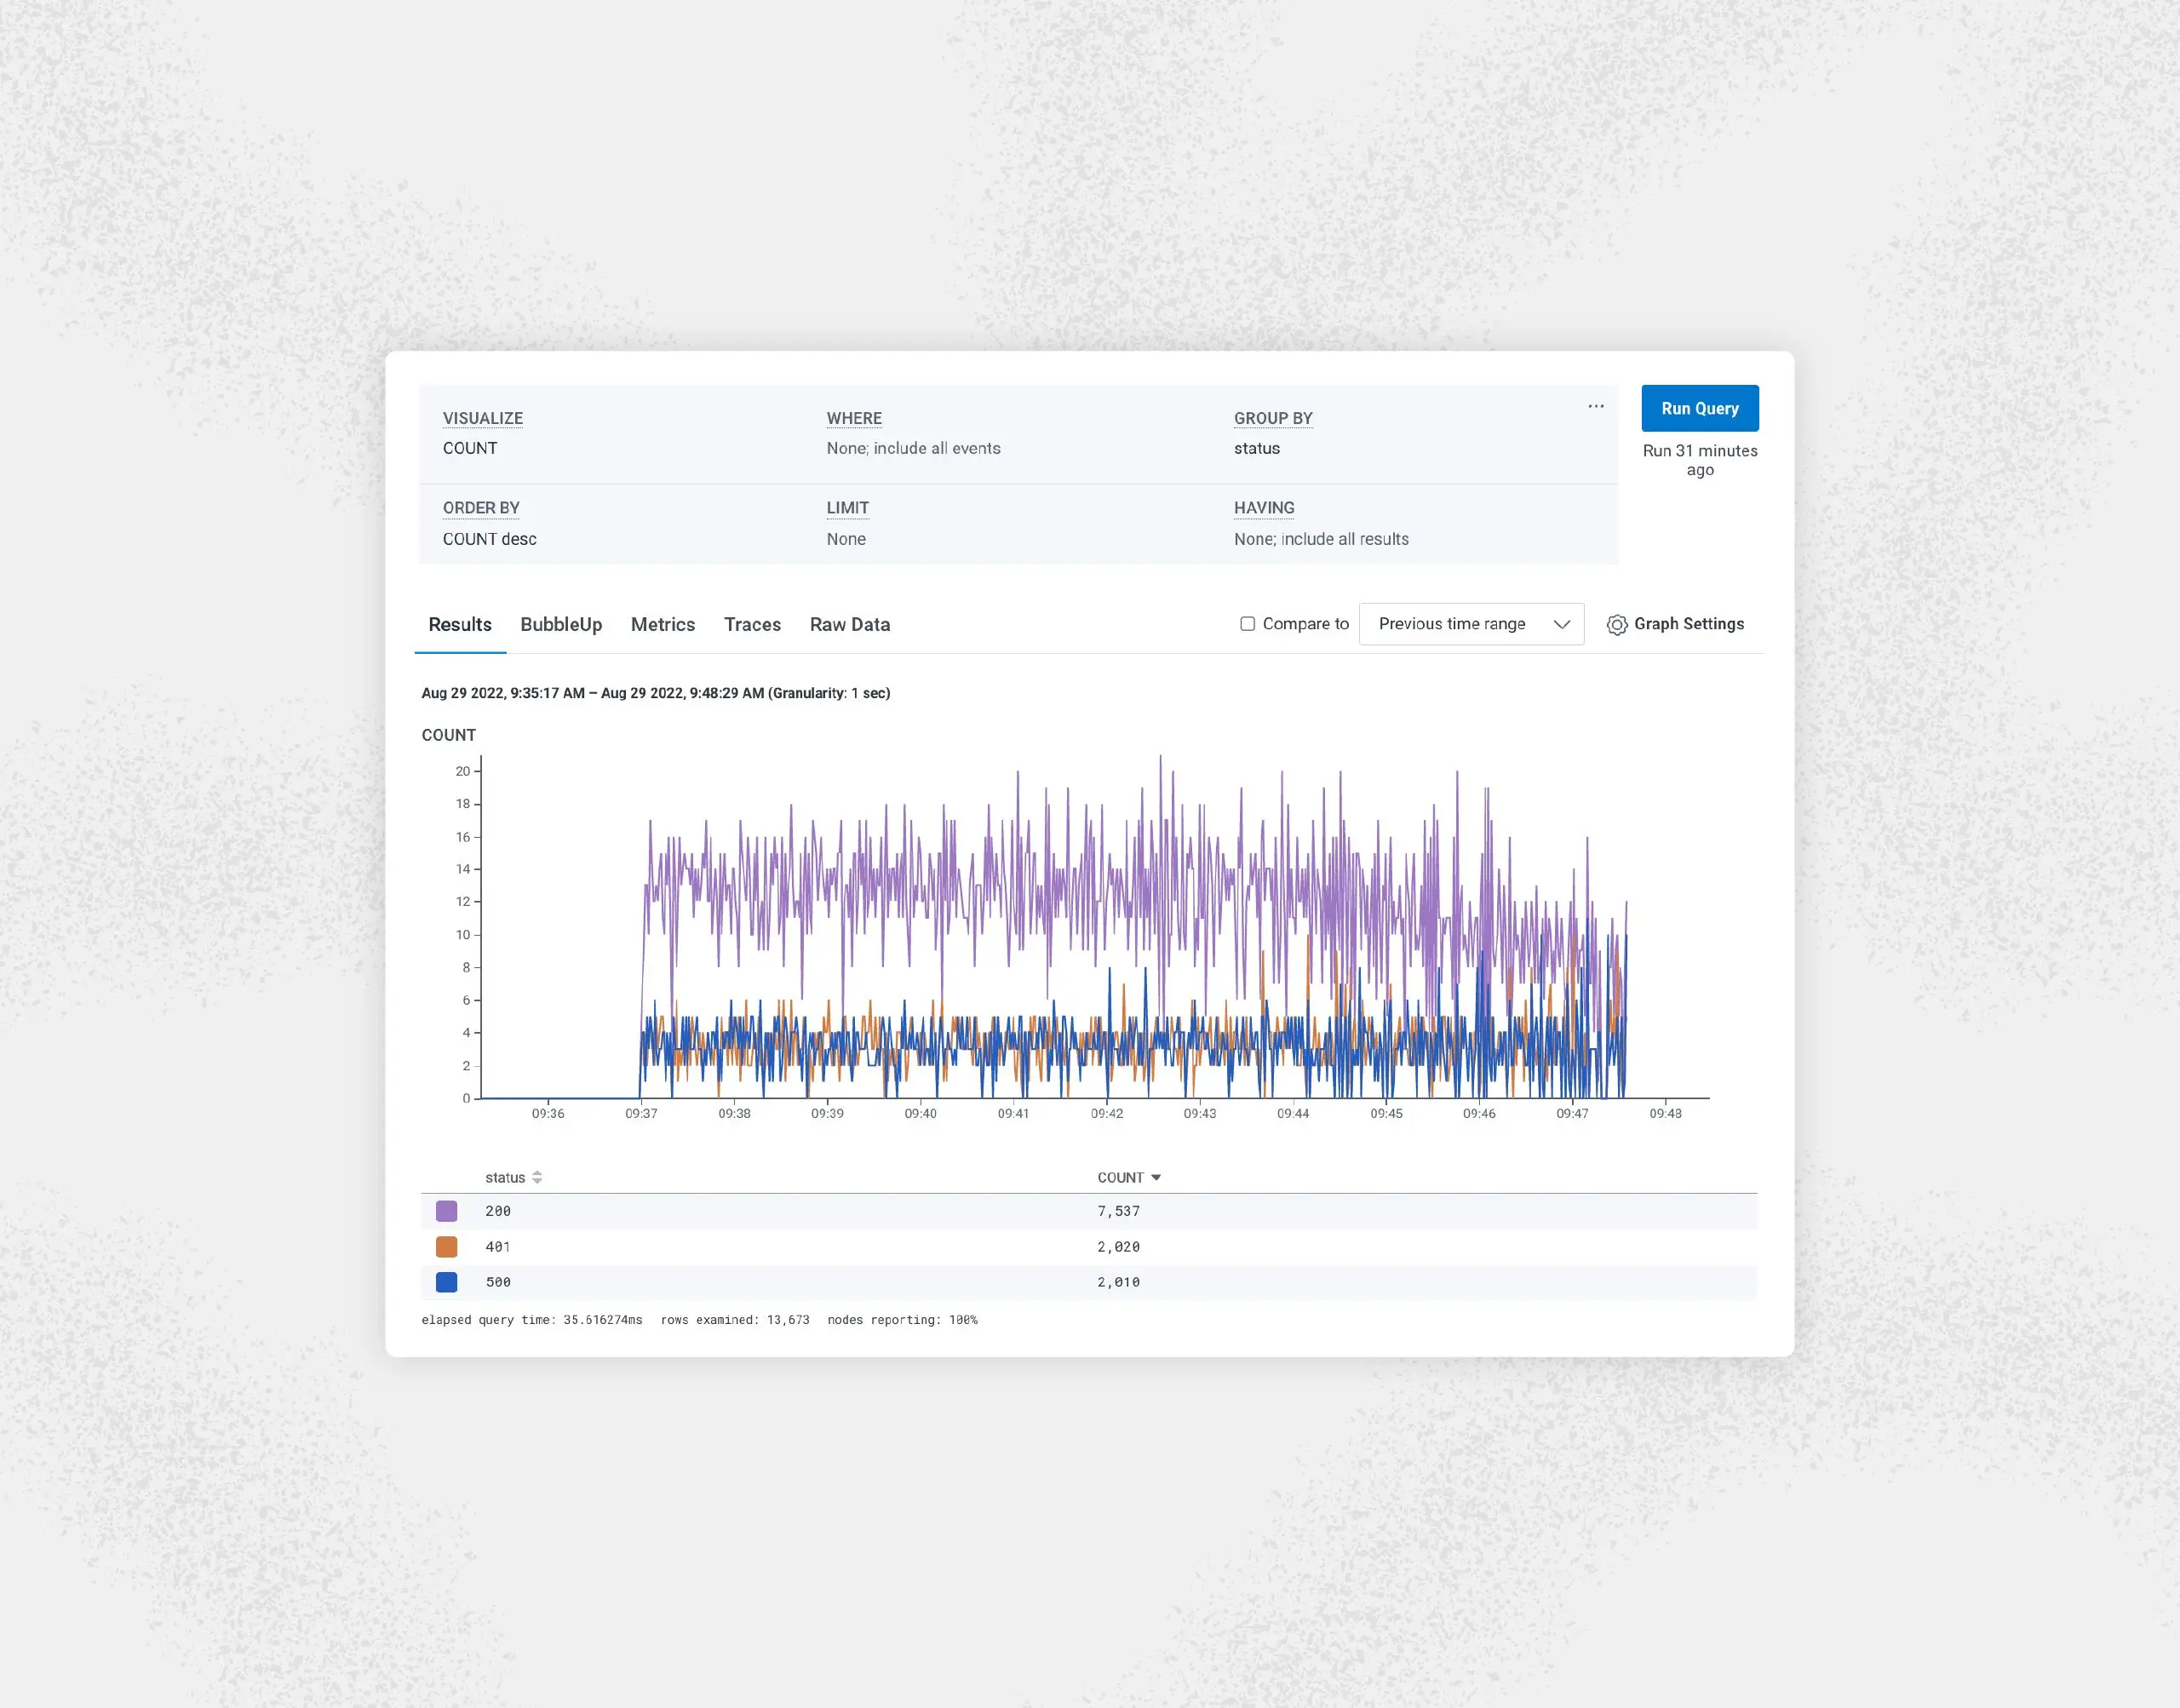
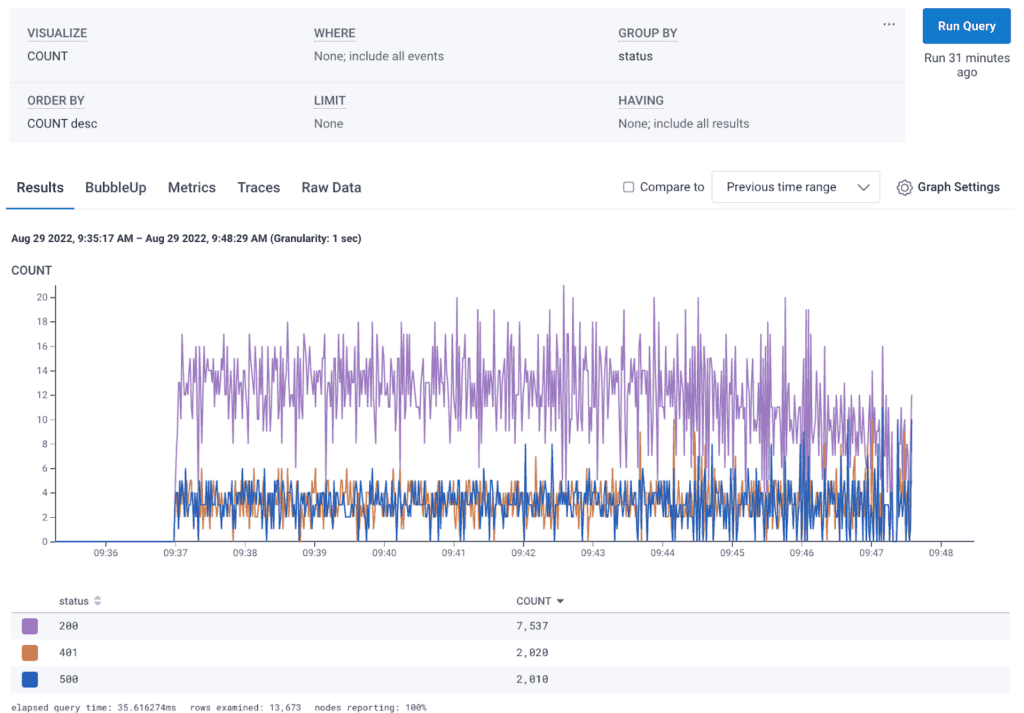
Next, run a few queries captured in the screenshots below. With this first one, you can see a breakdown of status codes by throughput containing 500 errors. Definitely something to dive into deeper.
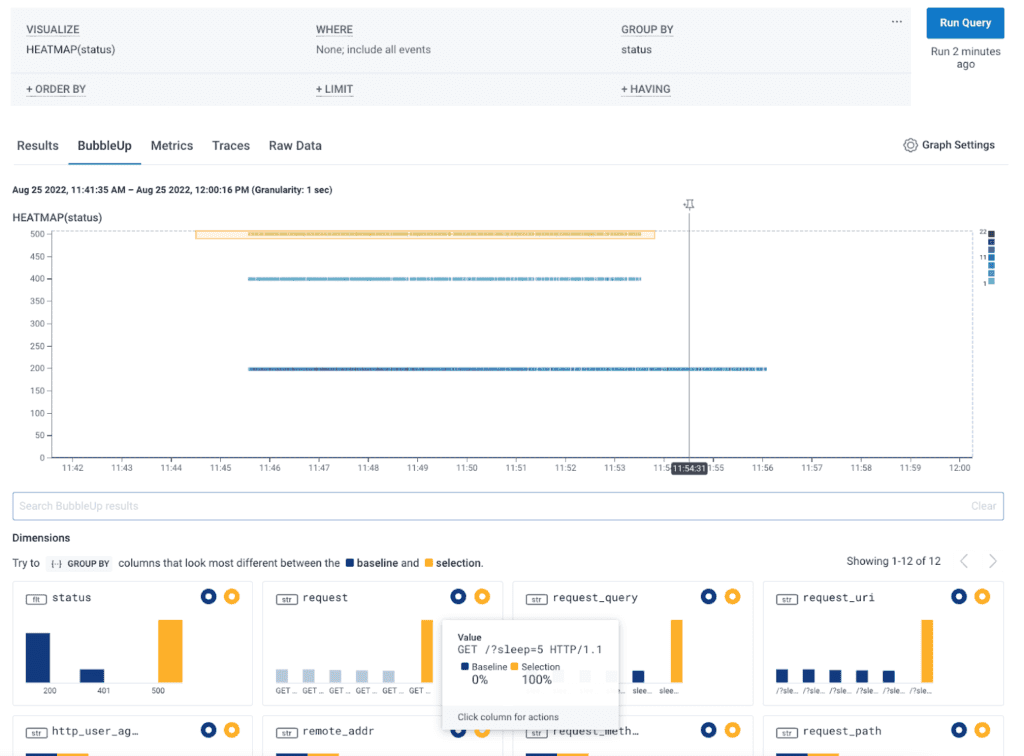
In this screenshot, we actually create a heatmap based on the status codes, and use BubbleUp to surface the requests causing the 500 errors by drawing a box around that area. It looks like most of the 500s occur around GET /?sleep=5 HTTP 1.1.
Lastly, you can look at the raw data below:
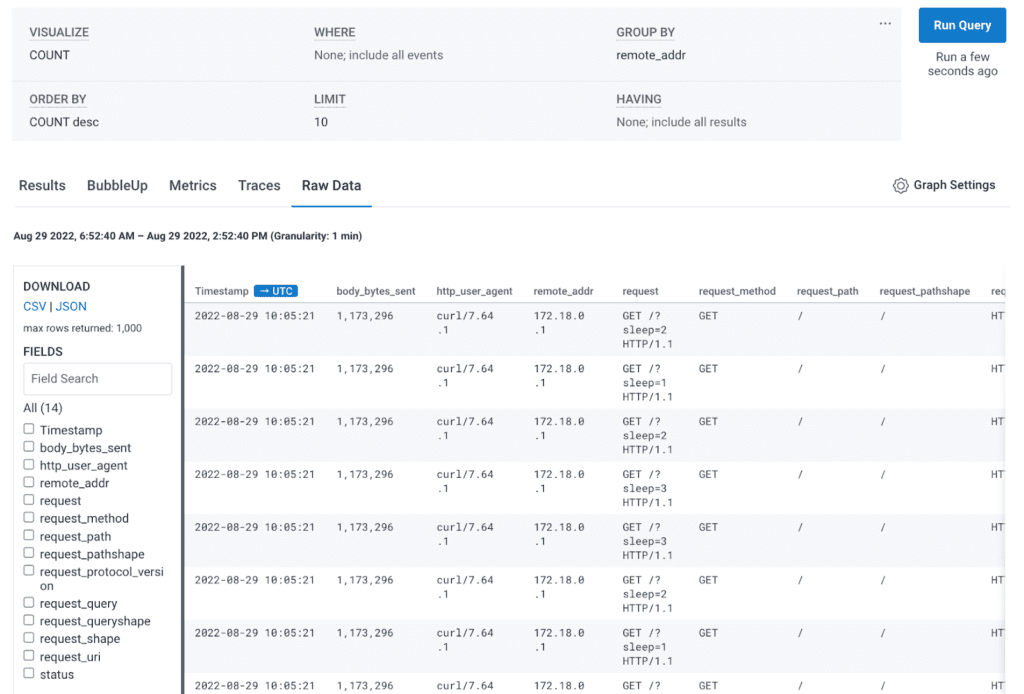
With these simple queries to start, you can explore your data and set up some dashboards.
What have you learned?
You have learned an easy way to parse NGINX logs using Honeytail. In today’s example, you used an application with an NGINX proxy, parsed the logs, and sent that data to Honeycomb.
Have fun exploring your data more and creating your own NGINX setup, and don’t forget to get your free account today!
Want to know more?
Talk to our team to arrange a custom demo or for help finding the right plan.