How We Use Smoke Tests to Gain Confidence in Our Code
Also known as confidence testing, smoke testing is intended to focus on some critical aspects of the software that are required as a baseline. The term originates in electronic hardware testing; as my colleague Robb Kidd stated, “We want to apply power and see if smoke comes out.” If a smoke test fails, there is almost definitely a problem to address. If it passes, it doesn’t necessarily mean there is no problem, but we can feel confident that the major functionality is okay.

By: Jamie Danielson
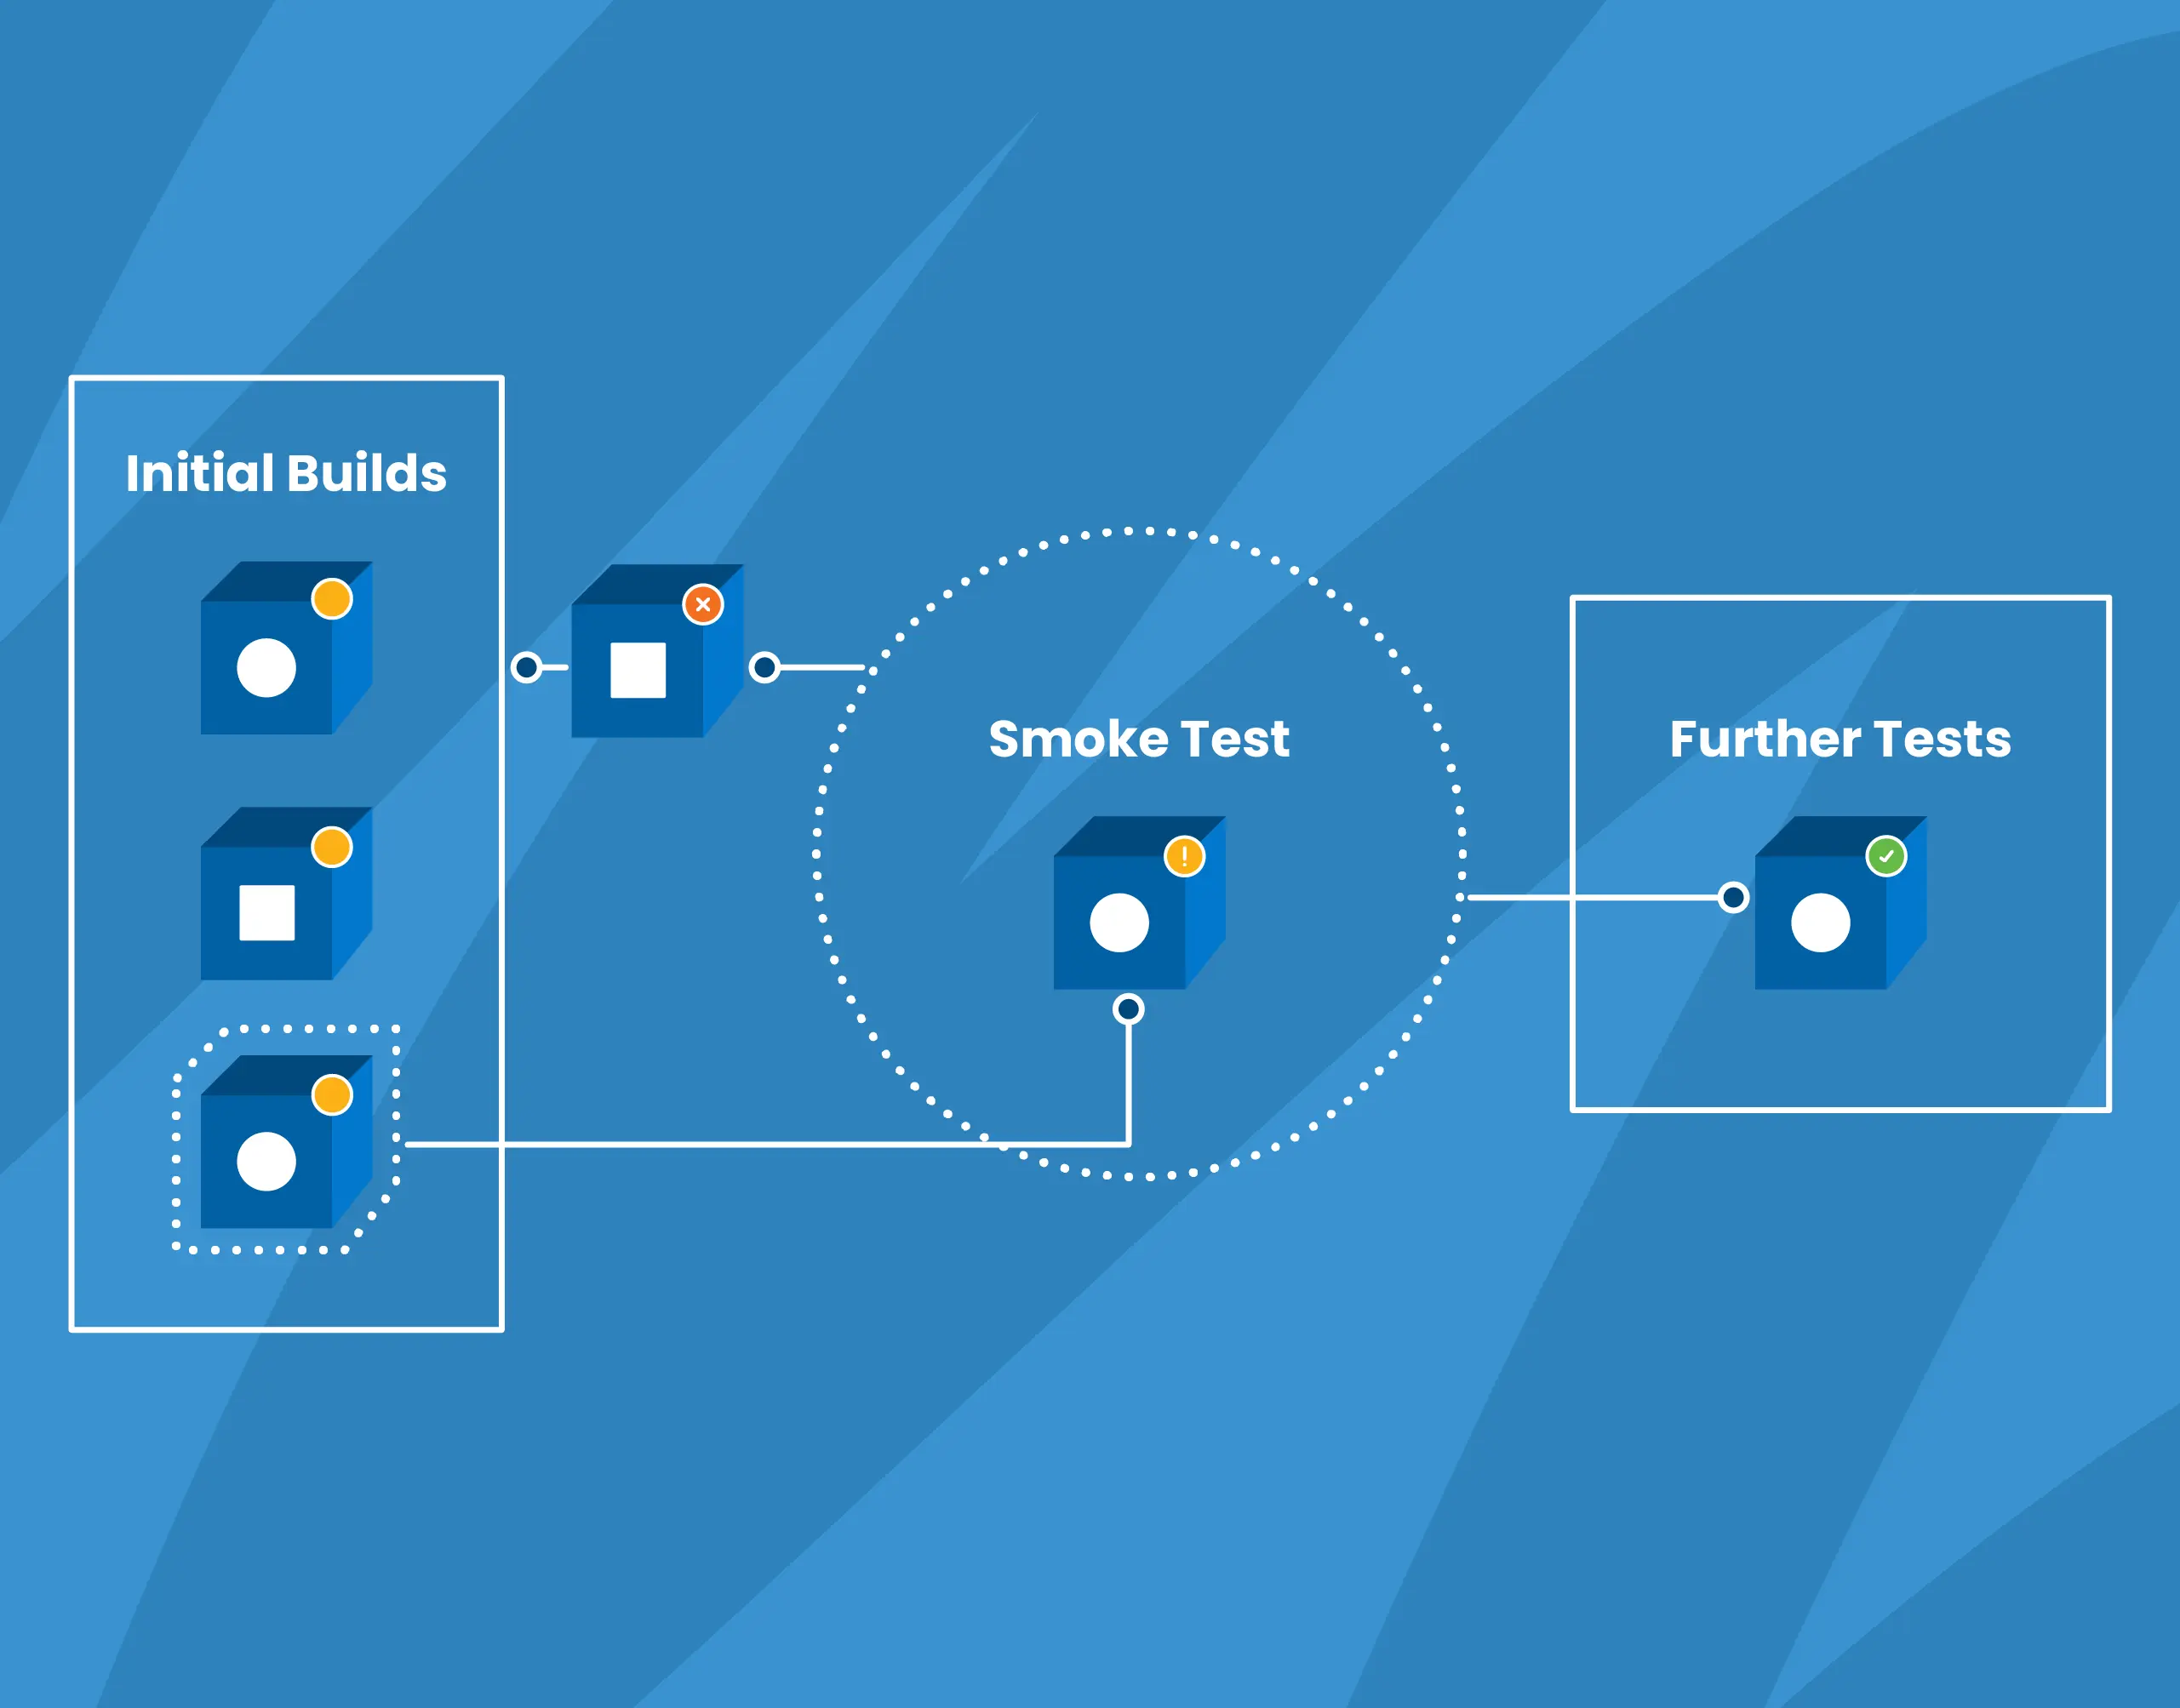
Wikipedia defines smoke testing as “preliminary testing to reveal simple failures severe enough to, for example, reject a prospective software release.” Also known as confidence testing, smoke testing is intended to focus on some critical aspects of the software that are required as a baseline. The term originates in electronic hardware testing; as my colleague Robb Kidd stated, “We want to apply power and see if smoke comes out.” If a smoke test fails, there is almost definitely a problem to address. If it passes, it doesn’t necessarily mean there is no problem, but we can feel confident that the major functionality is okay.
How we do smoke tests at Honeycomb
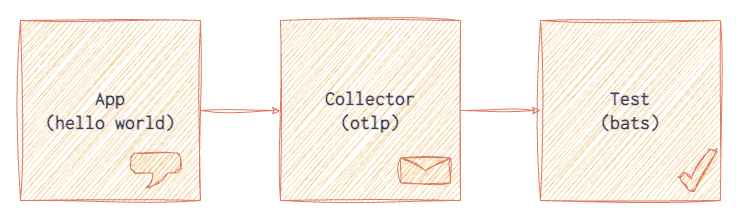
For smoke tests in our OpenTelemetry distributions, we run one or more example applications in a container. We then interrogate the telemetry exported to an OpenTelemetry Collector with tests written in Bash, using jq and the bats-core testing framework. Each application configures an SDK, utilizes some key components like instrumentation libraries and attributes, and exports telemetry to a Collector. The Collector then exports the telemetry to a file in json format. Tests are run against the json output and indicate whether the results are as expected, like the span names, attributes, and metrics.
This has multiple benefits:
- We have at least one example of how to use the library.
- Building and running the example in a container illustrates whether there are any build or runtime errors in a clean environment.
- Exporting telemetry to a Collector confirms exporting works, and can be received and parsed at an OTLP endpoint.
- Exporting from the Collector and saving to a json file lets us see the data itself, as we also upload this file as an artifact in our CI pipeline.
- By having a file with json output, we can use a language-agnostic testing framework that is repeatable across other projects and we can be precise about what fields we expect for each application.
{
 "traceId": "b29ba8bde2f87b487bf5c5385ded95c2",
 "spanId": "3e79a819f620a70e",
 "parentSpanId": "d0f406d4b8095df9",
 "name": "world",
 "kind": "SPAN_KIND_INTERNAL",
 "startTimeUnixNano": "1682975000542426619",
 "endTimeUnixNano": "1682975000542472030",
 "attributes": [
  {"key":"SampleRate", "value": { "intValue": "1" }},
  {"key":"baggy", "value": { "stringValue": "important_value" }},
  {"key":"for_the_children", "value": { "stringValue": "another_important_value" }},
   {"key":"message", "value": { "stringValue": "hello world!" }}
 ]
}See it in action
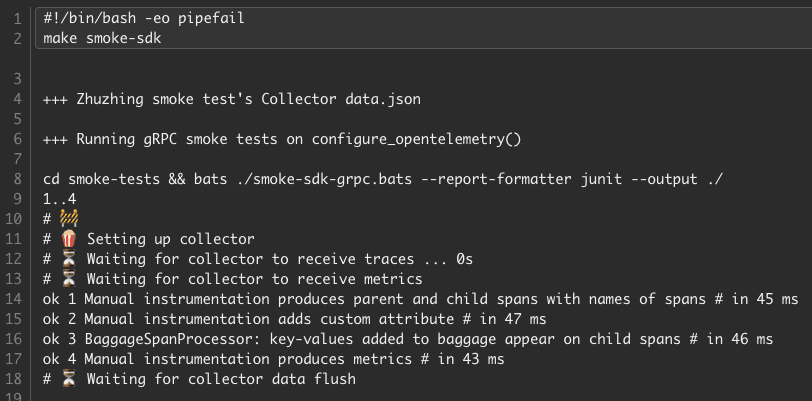
Check out our smoke tests in our Python SDK Distribution for OpenTelemetry, which run against our examples in the repository. There is a basic Hello World python app with a Dockerfile that is referenced in Docker Compose, along with a Collector. A test is run with a Makefile command make smoke, which builds the app and Collector, waits for telemetry to be exported, and then makes assertions:
- That the span names include “hello” and “world”
- That span attributes defined in the app are included on the span
- That attributes added to baggage are propagated to child spans
- And that metrics are produced
The results of the test, including the actual json files containing the telemetry, are uploaded as artifacts during the CI workflow. These can also be run locally during development.
Smoke tests are a great start
Like any test suite, this is only one aspect of testing and works best as part of a workflow that includes other kinds of unit tests and automated checks for linting and formatting. But we have found that adding smoke tests early in the lifecycle of a new project—and continuing to iterate on those tests as the project grows—helps our team gain confidence in building features and upgrading dependencies.
Interested in trying Honeycomb? Sign up for our very useful and generous free tier and start exploring for yourself!
Want to know more?
Talk to our team to arrange a custom demo or for help finding the right plan.