Support for AWS Application Load Balancer in the Honeycomb AWS Bundle
When we announced support for ingesting AWS Elastic Load Balancer access logs to Honeycomb, one of the first follow-up requests was for us to add support for AWS Application Load Balancer as well (which, alongside the…

By: Nathan LeClaire

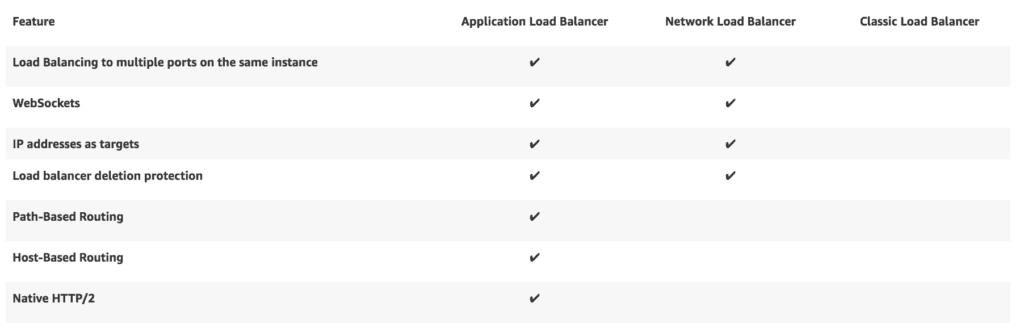
When we announced support for ingesting AWS Elastic Load Balancer access logs to Honeycomb, one of the first follow-up requests was for us to add support for AWS Application Load Balancer as well (which, alongside the Network Load Balancer, represents ELBv2). Given the list of features that ALB supports, it’s not difficult to see why. Who doesn’t want microservice-friendly path routing, native HTTP/2 support, tight integration with Amazon’s container-related services, and more?
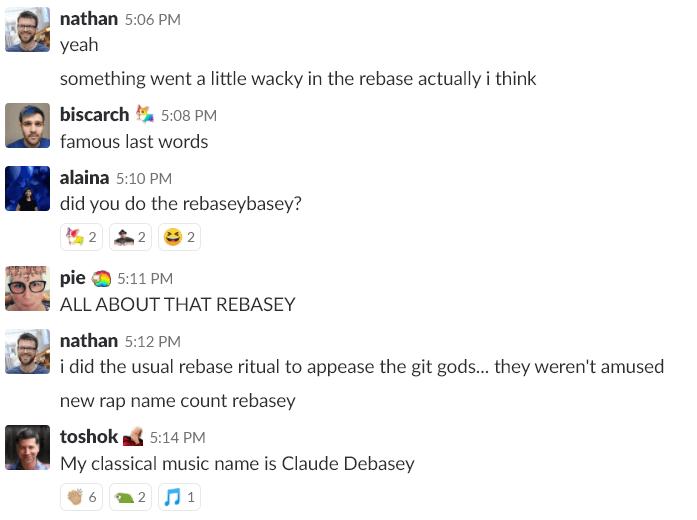
Today, we’re happy to announce that we’ve released support for ingesting such ALB logs. Based on work originally submitted by Jonathan Reichhold, community member Pavan Ravipati carried the pull request most of the way to the finish line after a dreaded “Rebaseapocalypse” in the repository. We at Honeycomb then followed up on Pavan’s work and added ALB support to our line of hand crafted artisanal Go binaries.
What’s it like?
Just like the honeyelb command line in the AWS Bundle, the new binary supporting ALB is straightforward to use. honeyalb ls will list available ALBs, and honeyalb ingest will download their access logs, parse them, and forward them to Honeycomb for querying.
$ honeyalb ls
bentest
prod
staging

$ honeyalb ingest --writekey=<writekey> bentest
INFO[2018-05-21T12:09:51-07:00] State tracking enabled - using local file system.
INFO[2018-05-21T12:09:52-07:00] Attempting to ingest ALB                      lbName=bentest
INFO[2018-05-21T12:09:52-07:00] Access logs are enabled for ALB ♥             bucket=nathanleclaire-bentest-alb-accesslogs lbName=bentest
INFO[2018-05-21T12:09:52-07:00] Getting recent objects                        entity=bentest prefix=AWSLogs/702835727665/elasticloadbalancing/us-east-1/2018/05/21/702835727665_elasticloadbalancing_us-east-1_app.bentest
INFO[2018-05-21T12:09:53-07:00] Downloading access logs from object           entity=bentest from_time_ago=44m50.003635725s key=AWSLogs/702835727665/elasticloadbalancing/us-east-1/2018/05/21/702835727665_elasticloadbalancing_us-east-1_app.bentest.bc31281184718073_20180521T1825Z_34.230.157.235_2mjst11f.log.gz size=265
What’s new?
Some of the fields are the same as what you can get in an Elastic Load Balancer access log, such as backend_processing_time (the amount of time the server took to process the request) and backend_authority (the client and port combination that served the request), but there are some important differences that speak to the ALB’s unique advantages.
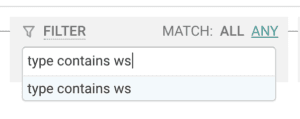
Since ALBs can support traffic going over WebSockets, you can look forward to filtering down to only wsand wss in the type field to gain increased visibility into the real time functionality in your apps.
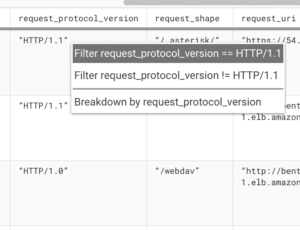
Same thing with HTTP protocol versions: verifying which of your traffic is getting served as HTTP/2 or 1.1, 1.0, etc. is a no brainer when examining the ALB access logs in Honeycomb. It’s only a FILTER request_protocol_version away:
The addition to ALB access logs I’m most excited about, however, is the presence of the X-Amzn-Trace-Idheader in the trace_id field. With this field, Amazon will automatically set a root span for the purposes of tracing your requests across multiple services in your infrastructure. If you then forward this header to another downstream request through an ALB, the root ID will be preserved and a unique ID will be added for each load balancer hop. Thus, the possibilities of examining the lifecycle of a request across your entire infrastructure open up dramatically.
In addition to the obvious uses like querying with FILTER on a specific request ID, we can start taking advantage of this by doing things like creating a derived column for trace_root to look at aggregate information (e.g., percentile latency) associated with an outermost request. Here, for instance, we use REG_VALUE to match the Root=<id> portion of the header.
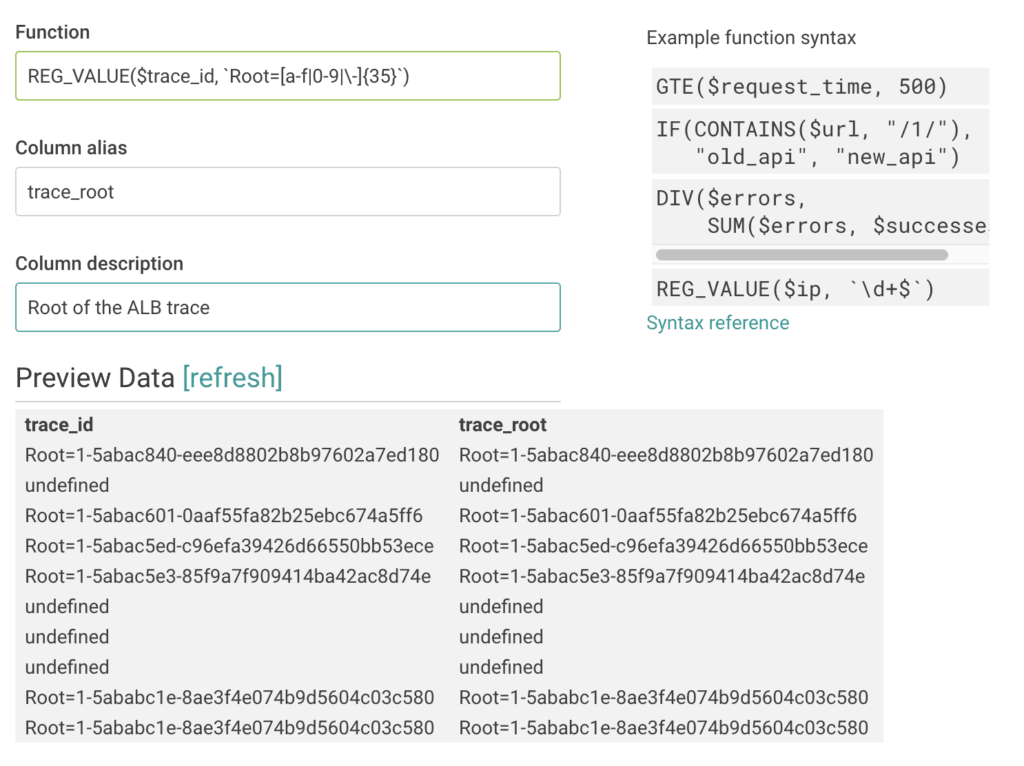
This will then allow us to query using the root span ID as if it were an actual field recorded in the access logs. Thus, something like a BREAK DOWN by trace_root accompanied by a SUM backend_processing_time will allow us to start identifying outliers and digging into the specific details related to the problem, such as which endpoints are misbehaving.
Try it Today
We’d love if you sign up for a Honeycomb account and try the ALB integration today. Let us know what you think!
Want to know more?
Talk to our team to arrange a custom demo or for help finding the right plan.