There And Back Again: A Honeycomb Tracing Story
In our previous post about Honeycomb Tracing, we used tracing to better understand Honeycomb’s own query path. When doing this kind of investigation, you typically have to go back and forth, zooming out and back…

By: Ian Wilkes

In our previous post about Honeycomb Tracing, we used tracing to better understand Honeycomb’s own query path. When doing this kind of investigation, you typically have to go back and forth, zooming out and back in again, between your analytics tool and your tracing tool, often losing context in the process.

To avoid this annoying and time-consuming context-switch, use Honeycomb to do everything you need! For example, here’s how I diagnosed a single slow query:
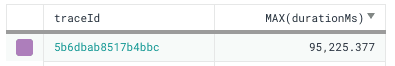
95 seconds is a long time! Why was this query so slow? To find out, I’ll click on the trace ID and dig into the waterfall.
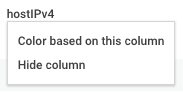
Most of the work is being done by the retriever service, and in this case the query is distributed across six hosts. To help distinguish them, I’ll tell the UI to color based on the default hostIPv4 column.
Rolling up the major spans, I get a pretty clear breakdown of where the time went:
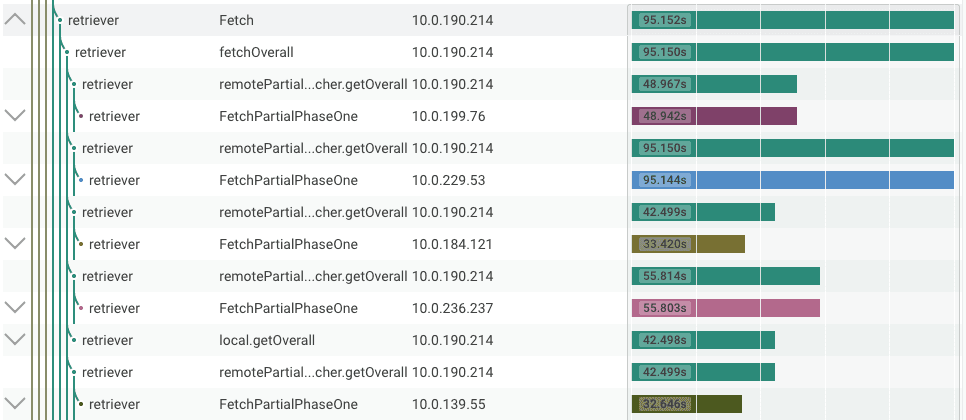
Here we can see that the top-level Fetch took 95.152s, which includes FetchPartialPhaseOne for all of the underlying hosts. One of these took 95.144s, so that’s obviously the bottleneck, and, oddly, took a full 40 seconds longer than the next slowest host, for what should be an evenly distributed workload. So I’ll open up that span and take a look inside.
Most of the interior spans are processSegment, each of which corresponds to loading about a million records from storage. They’re pretty quick (there are dozens in the 300-700ms range), until suddenly they aren’t.
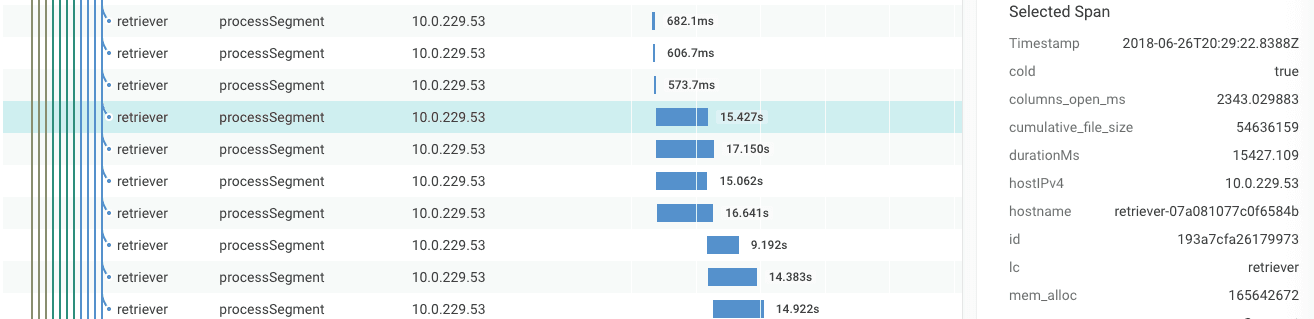
Why does segment processing increase from ~600ms to ~15s?
To find out, I can click on the spans to take a look at their metadata. Here we see the value of adding extra fields to your spans; that cold: true field means this segment has rolled to Secondary Storage, which isn’t expected to be as fast. This query took a long time because it went far beyond the dataset’s Fast Query window.
While I’m here, I can check to see if the host in question was facing memory pressure. A mem_alloc of about 166MB means we’re not using much RAM, so that’s not an issue here.
But that doesn’t explain why this host in particular took so much longer than the others. To figure that out, I’ll return to Honeycomb’s normal aggregate view and start asking questions about this trace in particular.
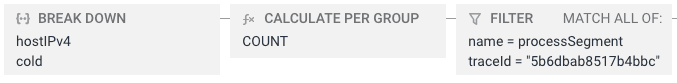
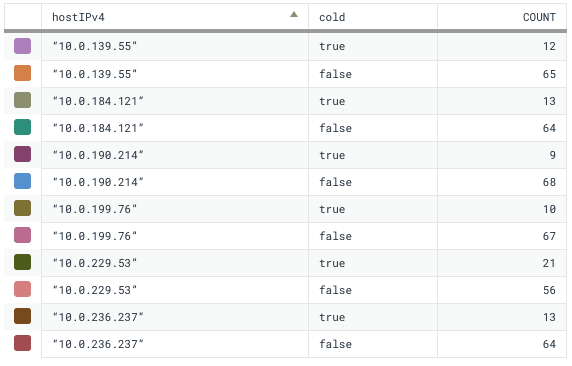
It doesn’t take long to find a smoking gun. Each host processed exactly 77 segments, but the number on Secondary Storage varies. In the case of the slow host, there are 8 more than the next highest. Given how long they take to read, this explains the 40 second discrepancy.
So now I have a clear answer for why my query took 95 seconds, despite only reading a mere half billion records. First, the query’s time range ran into Secondary Storage, and second, we have some inconsistency in how we age data out to secondary. I’ve learned all of this from a single tool and a single dataset. No need to switch back and forth!
What have you learned from Honeycomb Tracing? Drop us a note and maybe we’ll send you something in the mail 🙂
Want to know more?
Talk to our team to arrange a custom demo or for help finding the right plan.