Using Honeycomb to Investigate a Redis Connection Leak
This is a guest post by Alex Vondrak, Senior Platform Engineer at true[X]. This is the story of how I used Honeycomb to troubleshoot redis/redis-rb#924 and discovered a surprising workaround. The Problem Emergent failures…

By: Guest Blogger
This is a guest post by Alex Vondrak, Senior Platform Engineer at true[X].
This is the story of how I used Honeycomb to troubleshoot redis/redis-rb#924 and discovered a surprising workaround.
The Problem
Emergent failures aren’t fun. I’ve long since learned to dread those subtle issues that occur at the intersection of old code bases, eclectic dependencies, unreliable networking, third party libraries & services, the whims of production traffic, and so on.
That’s why, when RedisLabs emailed us early in December 2019 about our clients spiking up to ~70,000 connections on a new Redis database, I really didn’t want to deal with it. Our application was deployed across ~10 machines with 8 processes apiece – so you’d think maybe around 100 connections tops, if everything was going smoothly. Yet there the stale connections were.
Of course, I already knew where the problem came from. The new database was for a workaround we’d just deployed. It was a bit of over-engineering for a very specific use case, and it relied on blocking operations to force parallel HTTP requests into some serial order. The logic is replicated in this GitHub gist.
The important thing to note is that we relied on BLPOP to populate most of our responses. This Redis command blocks the client for a given number of seconds, waiting for data to appear on a list for it to pop off. If no data arrives in the given timeout, it returns nil.
Elapsed Time (sec) Client 1 Client 2 Client 3 0 BLPOP list 2 BLPOP list 4 1 (waiting) (waiting) 2 RPUSH list x y z nil (timed out) (waiting) 3 x (didn’t time out)
We were under stringent timeouts ourselves, so we’d just wait 1 second for this data. Our customers would timeout long before Redis did anyway.
To add to the stress, this legacy code base was using relatively old/unmaintained software: Goliath, em-synchrony, the recently-deprecated Redis synchrony driver, and other such things built atop the often-confusing EventMachine. Suffice to say, we’ve had our issues in the past.
RedisLabs instituted a connection cap to stop paging their ops people. With the intervening holidays (and just slow customer ramp-up on the new feature), it wouldn’t be until February 2020 that we realized no requests were succeeding because RedisLabs constantly sat at max capacity – no one was able to connect.
Searching in the Dark
What could I do? The Ruby code was as straightforward as it could be. I used the redis gem to initialize a single Redis instance shared across each process. Nothing but a simple call to the Redis#blpop method:
redis.blpop(key, timeout: 1)Was the problem in my application? Redis? EventMachine? I spent weeks trying to read each library’s code line-by-line, wishing I could just squint hard enough to understand where it could go wrong. I went through several Hail Mary attempts:
- I tried sending a QUIT command after every request. Nothing.
- I investigated setting a client timeout, but that’s not configurable on RedisLabs.
- I tried to monkey-patch underlying EventMachine connections to set inactivity timeouts. No dice.
The only remaining suggestion was to write a script that periodically fed the CLIENT LIST into CLIENT KILL. That was my reality check: surely that couldn’t be an appropriate fix. What was I missing?
Enter Honeycomb
At the time, we had signed up for Honeycomb, but hadn’t really instrumented any of our old systems. I whinged about how much I didn’t want to spend time on this decrepit code – exactly because of problems like this. So of course I didn’t want to instrument it! But I was getting nowhere with this bug. I didn’t know what triggered it, short of production traffic. What’s more, it was likely a bug in some library, not my application.
But hey, this is Ruby: I could just monkey-patch the libraries. It wouldn’t be my first time. I even wrote the Redis integration for the Ruby beeline (full disclosure), and that works by monkey-patching the redis gem.
So I spun up a canary instance pointing to some frenzied branch of my code where I iteratively added stuff like this:
Redis::Client.prepend(Module.new do
  def connect
    Honeycomb.start_span(name: 'Redis::Client#connect') do
      super
    end
  end

  def disconnect
    Honeycomb.start_span(name: 'Redis::Client#disconnect') do
      super
    end
  end

  def reconnect
    Honeycomb.start_span(name: 'Redis::Client#reconnect') do
      super
    end
  end
end)It was ugly, but it did the trick. I could finally see the code in action.
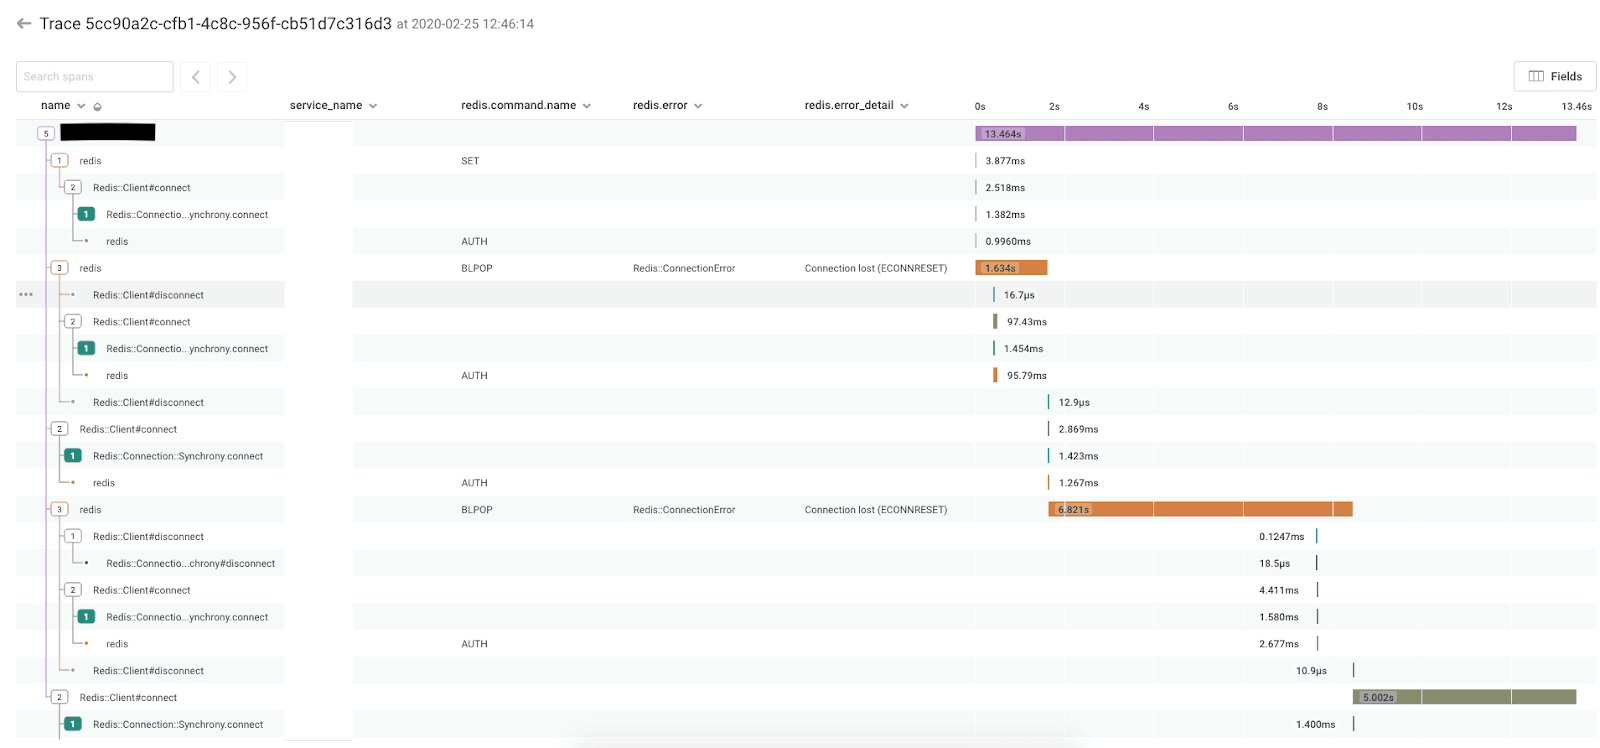
It still took some flipping back & forth between the trace and the Redis code, but I finally noticed a pattern:
- The BLPOP command was being wrapped in a client-side read timeout that added 5 seconds on top of the 1 second I was trying to block for. I didn’t expect or even need that.
- By using that read timeout code, connection errors would also be retried endlessly.
- Due to the read timeout, each connection error took the full 6 seconds to surface.
- Each retry would disconnect & reconnect the client.
One reason the connection errors were likely happening was because of the RedisLabs connection cap. They may still have been happening for mysterious reasons, as in redis/redis-rb#598. Regardless, I could observe this endless retry loop triggering a disconnect & reconnect – several of them per request. So I thought: if those connections aren’t actually being closed, that could be the source of my idle connections.
After weeks of endless squinting, guessing, and checking, within a day of using Honeycomb, I had an idea actually backed up by data. Carefully inspecting the redis gem’s code, I circumvented their read timeout & retry logic with:
-redis.blpop(key, timeout: 1)
+redis.call([:blpop, key, 1])Once it was deployed to the whole cluster, our connection count plummeted, and the feature finally worked as intended.
Takeaways
- Think about what you’re actually trying to do. I could’ve written a CLIENT KILL cron job, but that’s trying to reap idle connections, not stop them from being generated in the first place. When you don’t have enough information about the problem you’re trying to solve, the answer probably isn’t to fix some other symptom.
- When the only thing you can do to reproduce an error is to launch production traffic at it, live tracing is the only way to see exactly the details you need.
- The code bases you hate the most are usually the ones that need the most instrumentation. But a little instrumentation still goes a long way.
- Know when to stop. I don’t know why this bug happened just the way it did. But I figured out enough to fix the problem for our customers. It’s a reasonably precise workaround, and further investigation can go from there.
Download the Observability for Developers white paper to learn more about how observability can help you debug emergent failure modes in production.
Want to know more?
Talk to our team to arrange a custom demo or for help finding the right plan.