Honeycomb Empowers Teams With Complete Insight Into the Production Experience for Their Users With the Addition of Honeycomb Metrics

By: George Miranda
San Francisco, Calif., September 8, 2021 – Organizations using Honeycomb for observability now have a new metrics capability to quickly identify and resolve system issues. Honeycomb, which provides industry-leading observability software for understanding, troubleshooting, and optimizing cloud-native distributed systems, today announced that their Honeycomb Metrics feature is generally available for its enterprise customers.
Used together—Honeycomb’s observability platform for exploring application data and Honeycomb Metrics for monitoring system data—developers now have complete visibility into how their code is behaving and performing, down to the individual request level, and down to the health of the underlying systems running their code. The sum of application behavior and system behavior determines the user’s experience, which can now be explored in its entirety, without having to switch between different tools, resulting in faster debugging workflows.
Today’s engineering teams are tasked with quickly locating and fixing issues in their systems and applications to prevent downtime and to optimize performance. Traditional monitoring tools provide both application metrics and systems metrics. By design, metrics are aggregate measures. Once application metrics are calculated, they can’t be decomposed back into individual events to understand how individual requests behave. Developers can only see the symptoms of a health issue in their code with traditional application metrics dashboards. They cannot explore beneath the metric to find the cause or the cure. This results in extended outages or wasted engineering cycles as developers are forced to guess at what the fix might be and validate through trial and error.
To address this, teams are moving away from application metrics and to application observability, where they can go from alerts and anomaly detection straight to powerful querying of their high-cardinality and high-dimensionality application data to quickly and definitively determine where issues are happening in their code. But as they make this move from application metrics to application observability, they still want visibility into the health of the underlying systems running their code to ensure they are looking holistically at the entire user experience.
Honeycomb now gives engineering teams the best of both worlds: metrics for debugging system issues and event-based observability to debug application issues. It provides a single interface to identify and diagnose complex performance and quality issues, regardless of where they originate. Organizations using Honeycomb can gain quick insights into their application-level issues through observability and system-level issues through Honeycomb Metrics. This reduces the need to context switch and connect the dots between tools, which reduces the cognitive load for the team, and results in faster issue resolution.
“For too long, engineering teams have been forced to cobble together traditional monitoring tools and use metrics in ways that have proven ineffective in diagnosing the performance issues common in today’s complex environments,” said Christine Yen, CEO of Honeycomb. “Honeycomb Metrics, with native support for system-level metrics, together with event-driven observability at the application level, provides a best-in-class solution. It is a continuation of our commitment to help organizations across the globe boost their business performance.”
“We have just started using Honeycomb Metrics, and we’re already seeing value in having metrics data next to our observability data,” said Michael Garski, Director of Platform Engineering at Fender Musical Corporation. “Whenever we fix the issue, we’ll stop seeing errors in our Honeycomb event data. Now, we can also verify recovery by seeing our metrics go down in Honeycomb Metrics.”
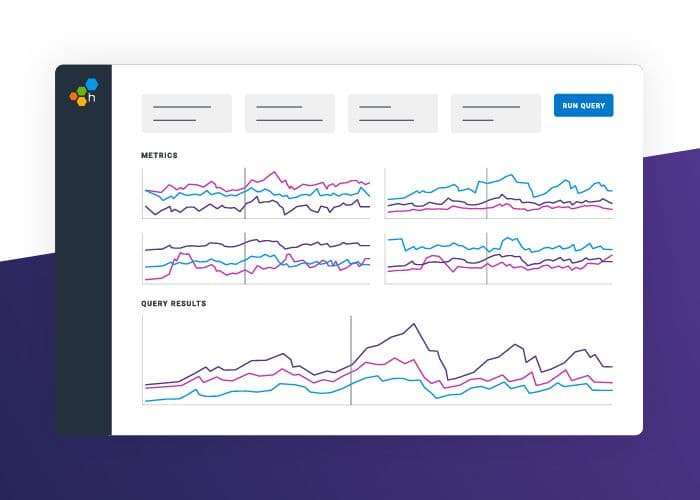
Honeycomb Metrics, available to all enterprise customers, ingests metrics data from OpenTelemetry, Prometheus, or Amazon CloudWatch. Visualizations of systems metrics are then created alongside application data visualizations. Customers can then quickly correlate or rule out the impacts underlying systems have on application performance, making it substantially faster and easier to identify the source of issues.
Read more about Honeycomb Metrics and how it works or sign up for an enterprise trial.
About Honeycomb
Honeycomb provides observability for modern development teams to learn, debug, and improve their production systems efficiently so that business-critical apps perform with minimal disruption to users. Honeycomb’s customers rely on the product for fast incident response, system optimization, and delivering pain-free releases across the software engineering cycle that translates to happy devs and happy customers. Learn more at www.honeycomb.io and follow us on Twitter.
Contact:
George Miranda
512-481-2876
Want to know more?
Talk to our team to arrange a custom demo or for help finding the right plan.