Ask Miss O11y: Logs vs. Traces
Tracing looks like a lot of work. We already have logs. Why bother adding traces? Ah, good question! TL;DR: Trace instead of log. Traces show connection, performance, concurrency, and causality. Logs are the original…

Tracing looks like a lot of work. We already have logs. Why bother adding traces?
Ah, good question!
TL;DR: Trace instead of log. Traces show connection, performance, concurrency, and causality.
Logs are the original observability, right? Back in the day, I did all my debugging with `printf.` Sometimes I still write `console.log(“JESS WAS HERE”)` to see that my code ran. That’s instrumentation, technically.
What if I emitted a “JESS WAS HERE” span instead? What’s so great about a span in a trace?
- A span has a timestamp. You know when it started.
Yeah, and so do logs in any decent framework.
- A span has a duration. You know how long it took.
Yeah, so I can put a ‘start’ and a ‘finish’ and then write a tool to tell me how long … if I really want to know.
- A span has attributes. You can search each field, and query over its values.
Yeah, and any decent framework supports structured logs. I can pass fields with the message.
- All spans in a trace are connected. You can see everything that happened in a single request, across services.
Yeah, and I can put a requestID in my structured logs. I can search by that … within each service, anyway.
- Spans contain causal attribution. You can see cause and effect between them.
Yeah, and I can kind of get that from the order in the logs … if everything executes sequentially. Otherwise, I can mostly guess.
If you don’t want to guess about connection, performance, concurrency, or causality, then traces are for you.
Back in the day, my software did everything in one service, sequentially. I wasn’t optimizing for performance. Logs were good enough.
Today, even in one service that’s all sequential because slow is fine, logs aren’t good enough for me. I’ve seen traces, and I won’t go back.
Why? Here’s a log.
1649986663435 3 GET /fib?index=2
1649986663435 3 Handling /fib
1649986663435 3 index=2
1649986663436 3 HTTP GET: url=http://127.0.0.1:3000/fib?index=1
1649986663440 3 HTTP GET: url=http://127.0.0.1:3000/fib?index=0
1649986663449 4 GET /fib?index=1
1649986663450 4 Handling /fib
1649986663450 4 index=1
1649986663450 4 Finished /fib result=1
1649986663452 5 GET /fib?index=0
1649986663452 5 Handling /fib
1649986663452 5 index=0
1649986663452 5 JESS WAS HERE
1649986663452 5 Finished /fib result=0
1649986663459 3 start calculating
1649986663460 3 finish calculating. result=1
1649986663460 3 Finished /fib result=1
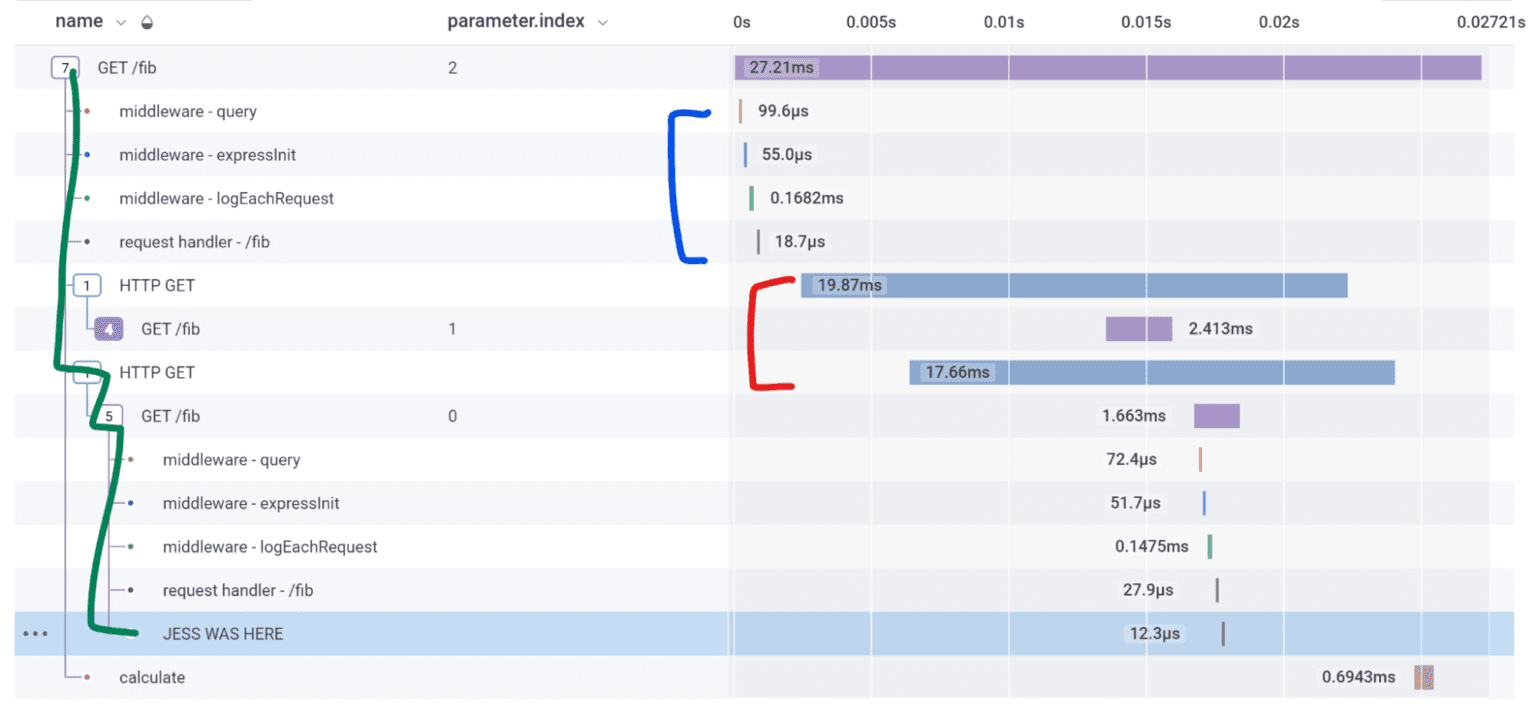
And the same execution, in a trace:

Traces are more than a list of what happened. They’re connected spans in a causal tree, drawn on a timeline. I can see what caused what (green line). I can see what ran concurrently (red) and what ran sequentially (blue group). I can see where all the time went.
The trace has more information, more clearly expressed. And thanks to OpenTelemetry autoinstrumentation, it’s less code than the logs.
If you have log statements and they’re familiar and you can read them quickly, cool. (Clue: it doesn’t work for new team members the way it works for you.)
If you add log statements, add spans or attributes instead. Observability standards are higher now.
Want to learn more about tracing? Check out our guide to distributed tracing. Or send us an email if you have a question for Miss O11y you’d like answered in a future post!
Want to know more?
Talk to our team to arrange a custom demo or for help finding the right plan.
