Observing Core Web Vitals with OpenTelemetry: Part Two
In a previous blog post, we outlined how to set up our own auto-instrumentation to send Core Web Vitals data to Honeycomb. We recently released a beta version of an OpenTelemetry wrapper to send traces from the browser to Honeycomb.

By: Purvi Kanal

Core Web Vitals (CWV) are Google’s preferred metrics for measuring the quality of the user experience for browser web apps.
Currently, Core Web Vitals measure loading performance, interactivity, and visual stability. These are the main indicators of what a user’s experience will be while using a web page:
- Largest Contentful Paint (LCP): how long it takes for the page to download resources and display something to the user (loading performance). LCP should occur within 2.5 seconds of when the page first starts loading.
- Cumulative Layout Shift (CLS): how much a web page moves around after the initial paint (visual stability). To provide a good user experience, pages should maintain a CLS of 0.1 or less.
- Interaction to Next Paint (INP): the longest delay for all click, tap and keyboard interactions throughout the lifespan of a page. A low INP means the page is consistently able to respond quickly to the vast majority of user interactions. An INP equal to or less than 200 milliseconds means your page has good responsiveness.
Note: As of March 12th, INP has become a stable Core Web Vital, replacing First Input Delay (FID). FID only measured the delay of the first input (whether it was a click, tap, or keyboard interaction), but this fell short. While the user’s first interaction might be quick, over the lifetime of the page, other interactions might get slower. As such, INP is a better representation of a user’s experience interacting with a web page.
Sending data with OpenTelemetry in the browser
In a previous blog post, we outlined how to set up our own auto-instrumentation to send Core Web Vitals data to Honeycomb. We recently released a beta version of an OpenTelemetry wrapper to send traces from the browser to Honeycomb. To get started, install the package:
npm install @honeycombio/opentelemetry-web @opentelemetry/auto-instrumentations-webOpenTelemetry initialization needs to happen as early as possible in your application or web site. Add the following code to the entrypoint of your application:
import { HoneycombWebSDK} from '@honeycombio/opentelemetry-web';
import { getWebAutoInstrumentations } from '@opentelemetry/auto-instrumentations-web';

const sdk = new HoneycombWebSDK({
  apiKey: 'api-key-goes-here',
  serviceName: 'your-great-browser-application',
  instrumentations: [getWebAutoInstrumentations()], // add automatic instrumentation
});
sdk.start();The SDK automatically enables Core Web Vitals instrumentation. Add your API key and CWV traces will be sent to Honeycomb.
Alternatively, if you would like to use base OpenTelemetry, install the following packages:
npm install --save \
@opentelemetry/api \
@opentelemetry/sdk-trace-web \
@opentelemetry/exporter-trace-otlp-http \
@opentelemetry/context-zone \
@opentelemetry/instrumentation \
@opentelemetry/auto-instrumentations-web \
@honeycombio/opentelemetry-webSet up the following tracing.js file:
// tracing.js
import { OTLPTraceExporter } from '@opentelemetry/exporter-trace-otlp-http';
import { WebTracerProvider, BatchSpanProcessor } from '@opentelemetry/sdk-trace-web';
import { ZoneContextManager } from '@opentelemetry/context-zone';
import { Resource } from '@opentelemetry/resources';
import { SemanticResourceAttributes } from '@opentelemetry/semantic-conventions';
import { registerInstrumentations } from '@opentelemetry/instrumentation';
import { getWebAutoInstrumentations } from '@opentelemetry/auto-instrumentations-web';
Import { WebVitalsInstrumentation } from ‘@honeycombio/opentelemetry-web’

// The exporter is responsible for sending traces from the browser to your collector
const exporter = new OTLPTraceExporter({
url: "https://api.honeycomb.io/v1/traces",
headers: {
"x-honeycomb-team": "your-api-key", // replace with your Honeycomb API key
},
});
// The TracerProvider is the core library for creating traces
const provider = new WebTracerProvider({
resource: new Resource({
[SemanticResourceAttributes.SERVICE_NAME]: 'browser',
'user_agent.original': window.navigator.userAgent, // add the user agent on every span
}),
});
// The processor sorts through data as it comes in, before it is sent to the exporter
provider.addSpanProcessor(new BatchSpanProcessor(exporter));
// A context manager allows OTel to keep the context of function calls across async functions
// ensuring you don't have disconnected traces
provider.register({
contextManager: new ZoneContextManager()
});
// initialize auto-instrumentation
registerInstrumentations({
instrumentations: [
getWebAutoInstrumentations(),
new WebVitalsInstrumentation(),
],
});Then, load the initialization file at the top of your web page’s header or entrypoint file. This file needs to be loaded as early as possible in the page to ensure that you capture as much data about page load and timing as possible.
// index.js
import './tracing.js'
// ...rest of the app's entry point codeQuerying Core Web Vitals
As outlined in a previous post, we recommend looking at P75 values for Core Web Vitals, as well as segmenting between desktop and mobile while looking at those values.
We can dig into anomalies and slower LCP values by looking at a heatmap of LCP values:
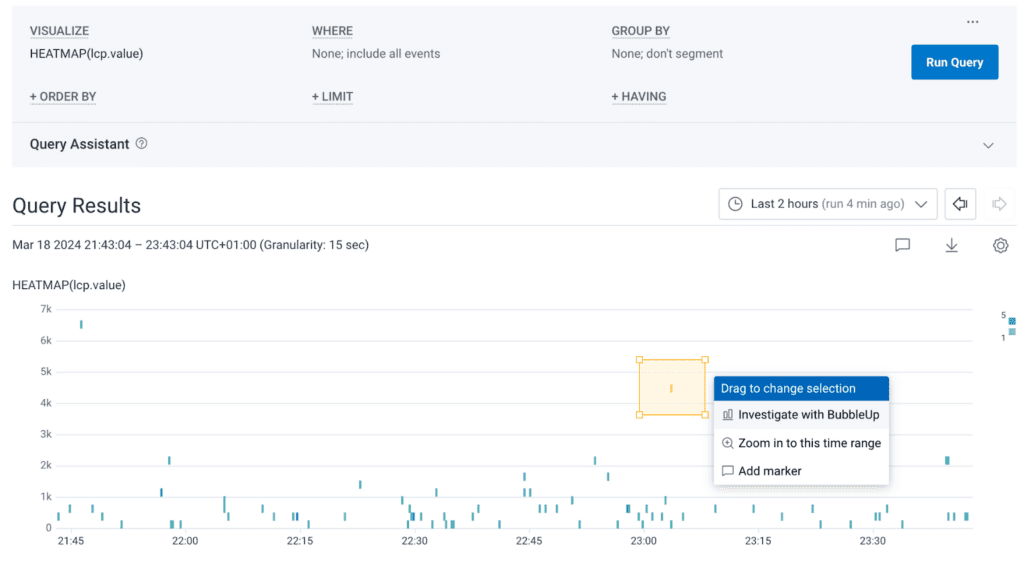
Drag your mouse along the anomaly and select “Investigate with BubbleUp.”
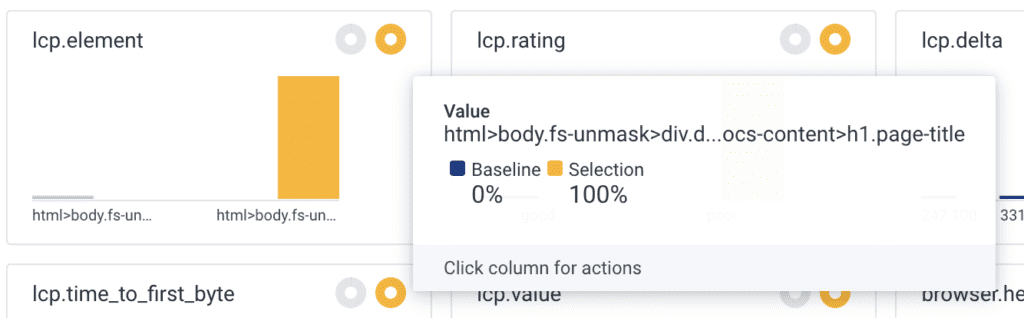
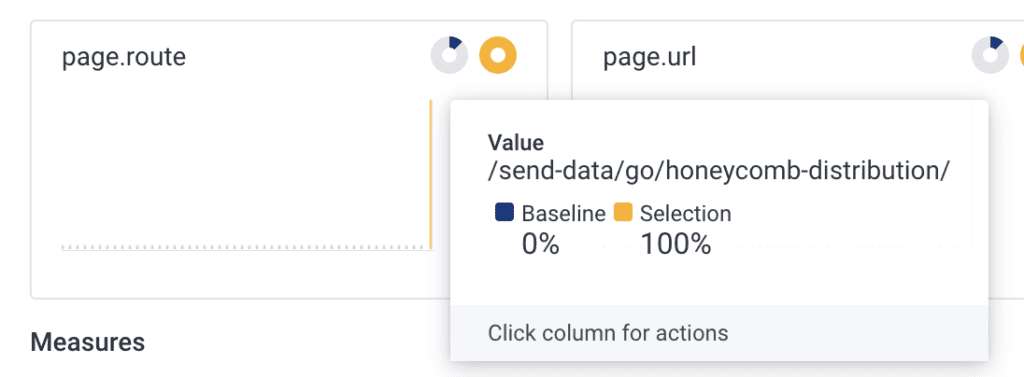
From BubbleUp, we can see at a glance specifically which element caused the LCP value to be larger than the baseline, and we can see what page it’s on:
Conclusion
Honeycomb’s OpenTelemetry wrapper and BubbleUp make debugging poor CWV values much easier, because we know exactly where to look to start optimizing these values. Take advantage of their combined powers: Get started sending spans from the browser to Honeycomb today!
RUM can leave questions unanswered.
Honeycomb for Frontend Observability doesn’t.
Want to know more?
Talk to our team to arrange a custom demo or for help finding the right plan.