Observing Core Web Vitals with OpenTelemetry
Each CWV measures a specific part of the end user experience. CWV scores can help identify gaps in web page performance. Additionally, Google uses CWV scores as one of the measures it uses to rank pages, which means they are important for SEO.

By: Purvi Kanal
Core Web Vitals (CWV) are Google’s preferred metrics for measuring the quality of the user experience for browser web apps.
Currently, Core Web Vitals measure loading performance, interactivity, and visual stability. These are the main indicators of what a user’s experience will be while using a web page:
- Largest Contentful Paint (LCP): how long it takes for the page to download resources and display something to the user (loading performance). LCP should occur within 2.5 seconds of when the page first starts loading.
- First Input Delay (FID): how long it takes before a user is able to take any action on the web page (interactivity). Pages should have a FID of 100 milliseconds or less. Think about when (especially on mobile devices) a web page might load visually, but when you touch your screen, nothing happens.
- Cumulative Layout Shift (CLS): how much a web page moves around after the initial paint (visual stability). To provide a good user experience, pages should maintain a CLS of 0.1 or less.
Why measuring Core Web Vitals is important
Each CWV measures a specific part of the end user experience. CWV scores can help identify gaps in web page performance. Additionally, Google uses CWV scores as one of the measures it uses to rank pages, which means they are important for SEO.
Learn how to measure Core Web Vitals
Get started with Honeycomb & Vercel.
Getting started with OpenTelemetry in the browser
You can use OpenTelemetry to instrument your browser frontend application. Install the OpenTelemetry API, SDK, exporter, and span processor packages:
npm install --save \
	@opentelemetry/api \
	@opentelemetry/sdk-trace-web \
	@opentelemetry/exporter-trace-otlp-http \
	@opentelemetry/context-zone \
	@opentelemetry/instrumentation \
@opentelemetry/auto-instrumentations-webOpenTelemetry initialization needs to happen as early as possible in the webpage. Create a file called `tracing.js` and add the following initialization code:
// tracing.js
import { OTLPTraceExporter } from '@opentelemetry/exporter-trace-otlp-http';
import { WebTracerProvider, BatchSpanProcessor } from '@opentelemetry/sdk-trace-web';
import { ZoneContextManager } from '@opentelemetry/context-zone';
import { Resource }  from '@opentelemetry/resources';
import { SemanticResourceAttributes } from '@opentelemetry/semantic-conventions';
import { registerInstrumentations } from '@opentelemetry/instrumentation';
import { getWebAutoInstrumentations } from '@opentelemetry/auto-instrumentations-web';


// The exporter is responsible for sending traces from the browser to your collector
const exporter = new OTLPTraceExporter({
url: "https://api.honeycomb.io/v1/traces",
headers: {
  "x-honeycomb-team": "your-api-key", // replace with your Honeycomb API key
},
});


// The TracerProvider is the core library for creating traces
const provider = new WebTracerProvider({
resource: new Resource({
  [SemanticResourceAttributes.SERVICE_NAME]: 'browser',
  'user_agent.original': window.navigator.userAgent, // add the user agent on every span
}),
});


// The processor sorts through data as it comes in, before it is sent to the exporter
provider.addSpanProcessor(new BatchSpanProcessor(exporter));
// A context manager allows OTel to keep the context of function calls across async functions
// ensuring you don't have disconnected traces
provider.register({
contextManager: new ZoneContextManager()
});


// initialize auto-instrumentation
registerInstrumentations({
instrumentations: [
  getWebAutoInstrumentations(),
],
});
Then, load the initialization file at the top of your web page’s header or entry point file. This file needs to be loaded as early as possible in the page to ensure that you can capture as much data about page load and timing as possible.
// index.js
import './tracing.js'


// ...rest of the app's entry point codeInstrumentation
Let’s look at how to use OpenTelemetry to send Core Web Vitals data to Honeycomb.
Core Web Vitals has an npm package that we can use for instrumentation. Install the web-vitals package and OpenTelemetry’s instrumentation package.
$ npm install web-vitals --save
$ npm install @opentelemetry/instrumentation --saveWe’ll create our own auto-instrumentation to send Core Web Vitals data to Honeycomb. The following code snippet uses OpenTelemetry’s instrumentation package to create a `WebVitalsInstrumentation` class. Copy this snippet into a new file called web-vitals-instrumentation.js.
// web-vitals-autoinstrumentation.js


import { onFID, onLCP, onCLS} from 'web-vitals';
import { InstrumentationBase } from '@opentelemetry/instrumentation';
import { trace, context } from '@opentelemetry/api';
import { hrTime } from '@opentelemetry/core';


export class WebVitalsInstrumentation extends InstrumentationBase {
 // function that creates a span for each web vital and reports the data
 // as attributes
 onReport(metric, parentSpanContext) {
   const now = hrTime();


   // start the span
   const webVitalsSpan = trace
     .getTracer('web-vitals-instrumentation')
     .startSpan(metric.name, { startTime: now }, parentSpanContext);


   // add core web vital attributes
   webVitalsSpan.setAttributes({
     [`web_vital.name`]: metric.name,
     [`web_vital.id`]: metric.id,
     [`web_vital.navigationType`]: metric.navigationType,
     [`web_vital.delta`]: metric.delta,
     [`web_vital.rating`]: metric.rating,
     [`web_vital.value`]: metric.value,
     // can expand these into their own attributes!
     [`web_vital.entries`]: JSON.stringify(metric.entries),
   });


   // end the span
   webVitalsSpan.end();
 }


 enable() {
 if (this.enabled) {
   return;
 }
 this.enabled = true;


 // create a parent span that will have all web vitals spans as children
 const parentSpan = trace.getTracer('web-vitals-instrumentation').startSpan('web-vitals');
 const ctx = trace.setSpan(context.active(), parentSpan);
 parentSpan.end();


 // Capture First Input Delay
 onFID((metric) => {
   this.onReport(metric, ctx);
 });


 // Capture Cumulative Layout Shift
 onCLS((metric) => {
   this.onReport(metric, ctx);
 });


 // Capture Largest Contentful Paint
 onLCP((metric) => {
   this.onReport(metric, ctx);
 });
 }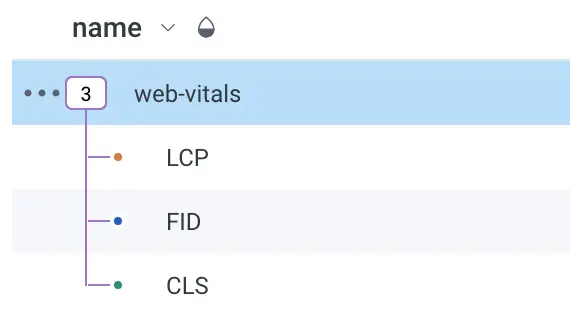
}Once you run your app, you should see Core Web Vitals data in Honeycomb that is structured like this:
Useful queries
For each of the Core Web Vitals, it is recommended to measure the 75th percentile of page loads. It is also important to separately measure desktop and mobile devices, since those can be very different user experiences.
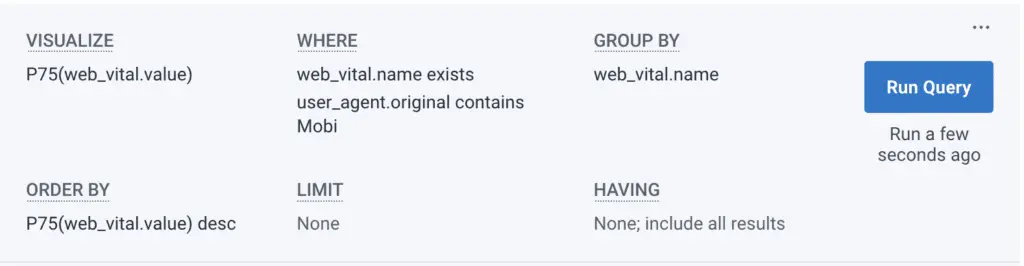
This allows us to set up some baseline queries for Core Web Vitals in Honeycomb. In Honeycomb, navigate to “New Query” and set up the following query:
- Enter P75(web_vital.value) into VISUALIZE
- Enter browser.user_agent contains “Mobi” AND web_vital.name exists into WHERE
- Enter web_vital.name into GROUP BY
Note: User agent sniffing to figure out if something is being sent from a mobile device is complicated! MDN recommends looking for the substring “Mobi” to determine if the device is a mobile device. It is also possible to turn this into a derived column in Honeycomb to simplify the query since this is a common thing to segment on.
You should see a result of the P75 values for each of the Core Web Vitals.
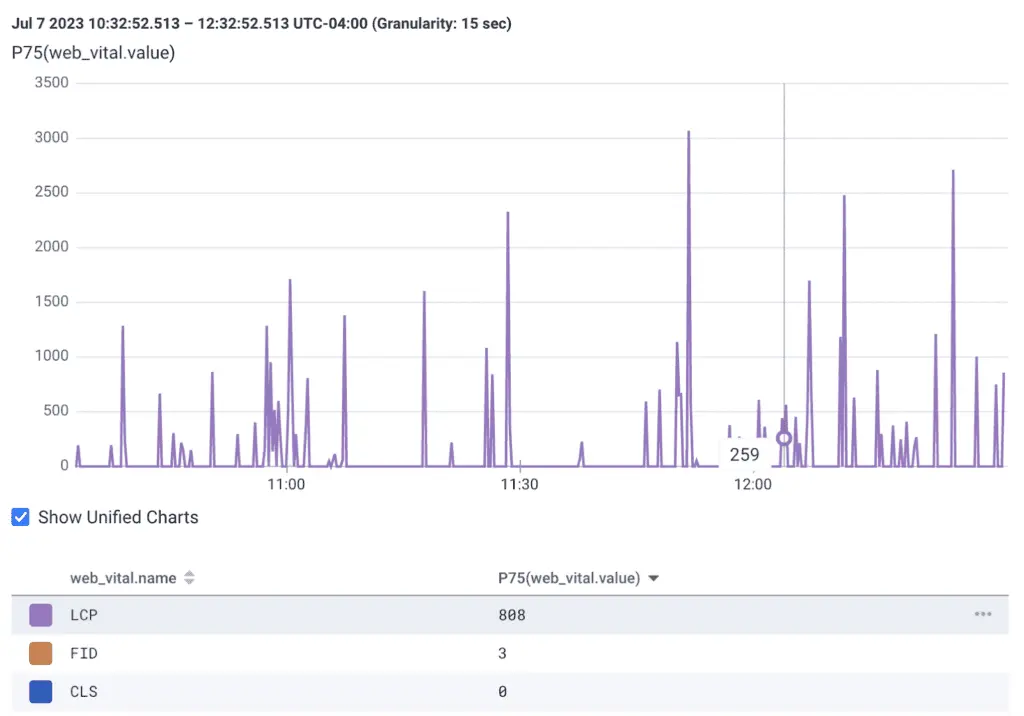
This is a useful query to save and set up a Service Level Objective (SLO) for. The values might not meet the web standards listed, but this is a good baseline to form SLOs around.
We can dig into this data further, let’s focus on the LCP value. Start a new query and enter the following:
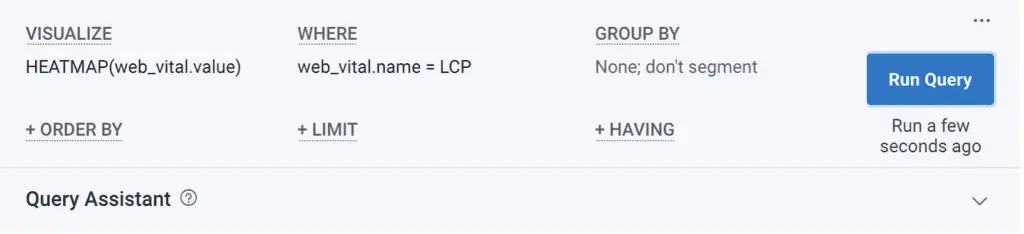
That should give us a heatmap graph that looks like this:
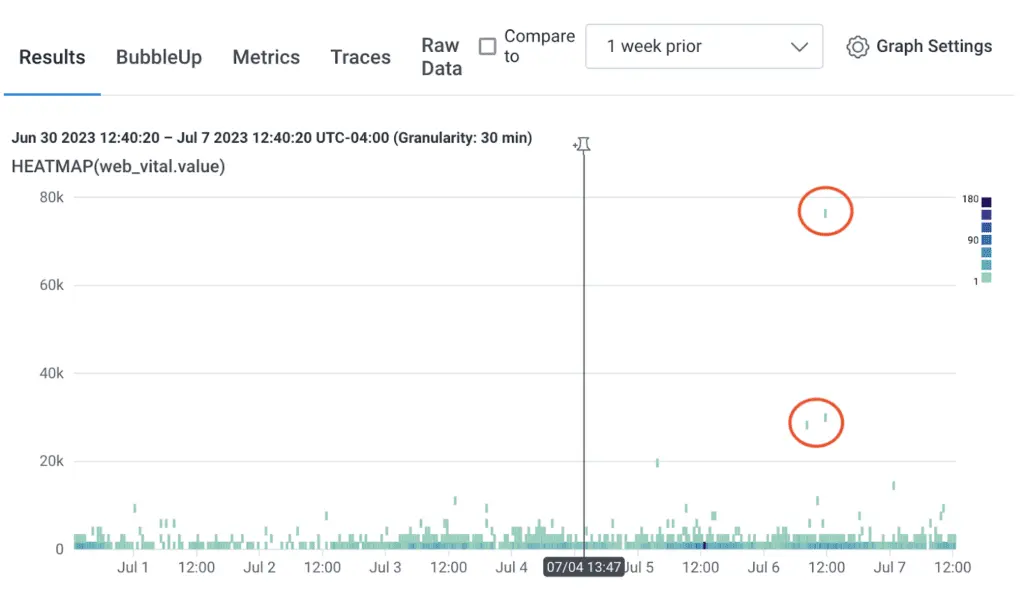
It looks like there are some anomalies where the LCP value is much larger than the baseline. Click on the “BubbleUp” tab and drag your mouse across the anomalies.
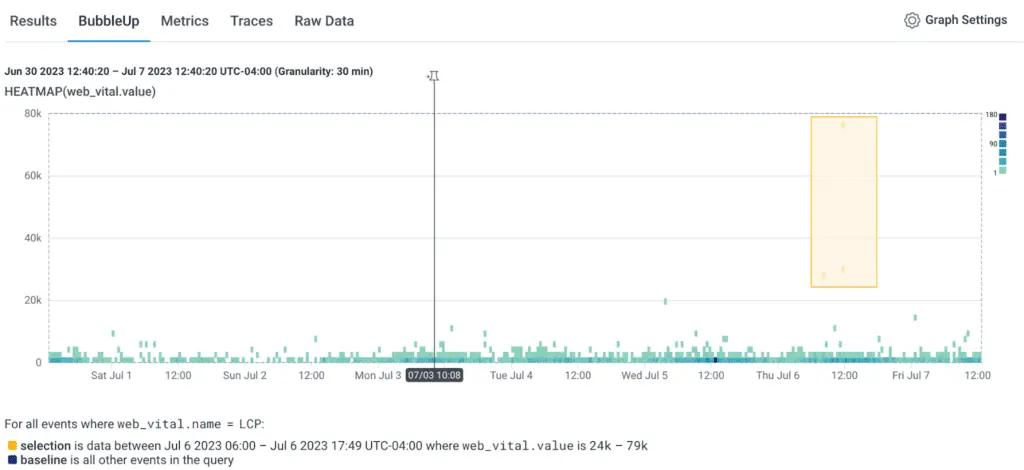
This will highlight the attributes about this selection that are the most different from the baseline value.
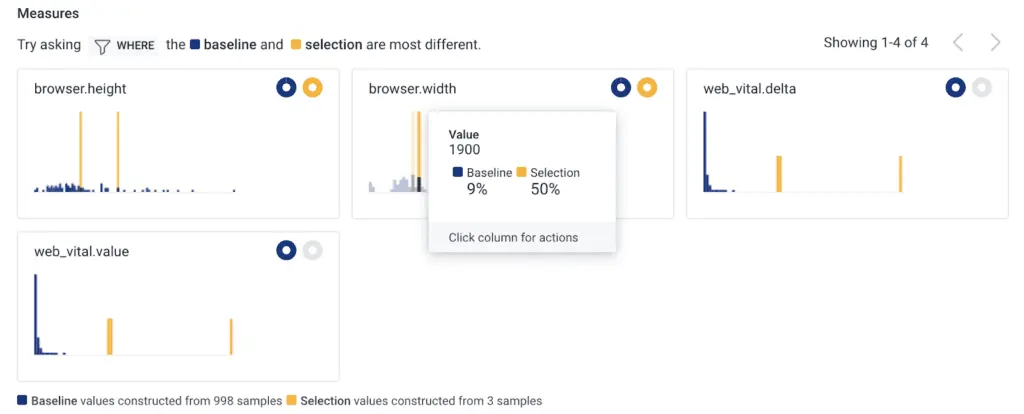
For this web page, the LCP is higher on large screen sizes, which gives us a place to improve the LCP. This query can be repeated for FID and CLS scores.
Adding further attributes to the resource, like browser language, geolocation, and other navigator properties, will also help you spot patterns across these values and can be identified with BubbleUp.
Conclusion
In this post, we learned how to instrument a browser application with OpenTelemetry and send Core Web Vitals data to Honeycomb. We also learned how to query that data to help keep an eye on these important values—and how we can use BubbleUp to dig into where to start improving CWV scores.
If you’d like to learn more about tracking Core Web Vitals, we recently released a guide on how to track them using Honeycomb and Vercel. We recommend starting there.
Want to know more?
Talk to our team to arrange a custom demo or for help finding the right plan.