Find and Fix Bottlenecks in Your Gradle Builds With OpenTelemetry and Honeycomb
Today, I’d like to share with you a new community-contributed integration that helps you optimize and debug your Gradle builds. This new Gradle plugin is available today, is free to use, and you can use it immediately with a free Honeycomb account.

By: Craig Atkinson

Today, I’d like to share with you a new community-contributed integration that helps you optimize and debug your Gradle builds. This new Gradle plugin is available today, is free to use, and you can use it immediately with a free Honeycomb account.
OpenTelemetry Gradle plugin
My new plugin instruments your Gradle builds with OpenTelemetry, a vendor-neutral framework used to generate telemetry for observability. When that telemetry is sent to Honeycomb, you can visualize it in a trace view for each task in your build. That visualization makes it easy to see where bottlenecks may be occuring, or where you have opportunities for improvement. Honeycomb’s analysis capabilities also mean that you can quickly debug why issues in your builds are happening.
Although I work for Honeycomb, my new OpenTelemtry Gradle plugin is a personal project I built because I wanted to be able to visualize all the tasks and tests in my Gradle projects with Honeycomb to find and optimize the slowest parts of my builds.
Trace visualizations for your builds
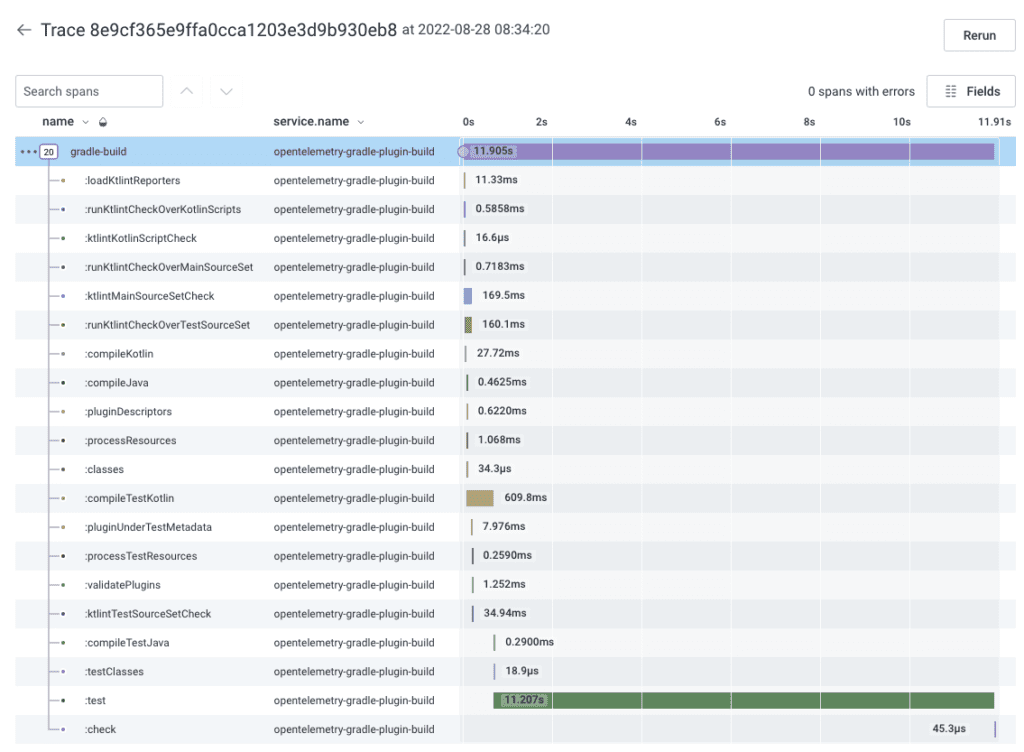
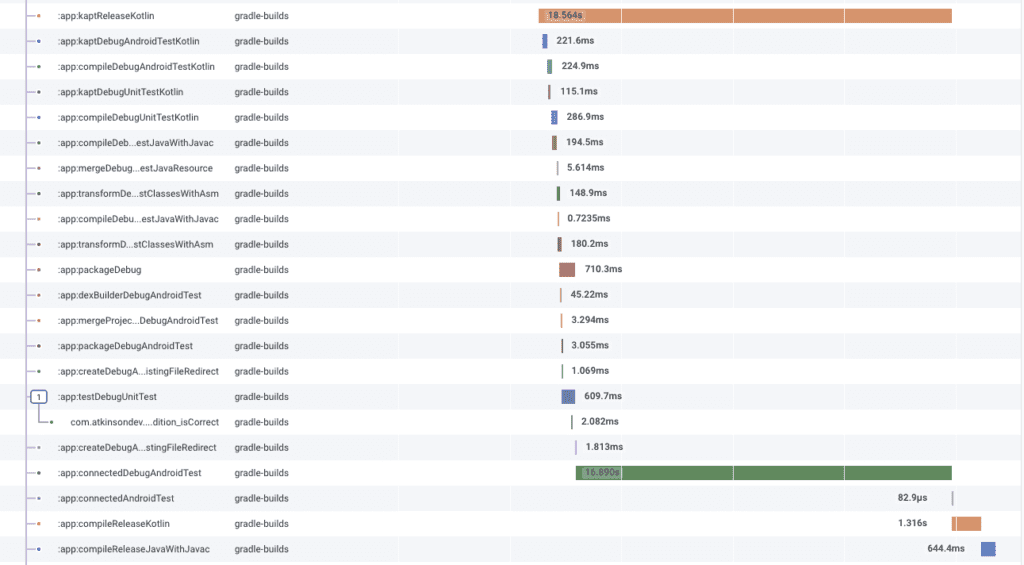
The plugin automatically generates telemetry data about your builds and sends it to Honeycomb. With the Honeycomb UI, you can see details about each of the tasks in your Gradle build execution by visualizing them as a trace. For example, here is the trace view of a build from the plugin itself. You can see things like the compilation tasks, test task, and other tasks reflected in the trace:
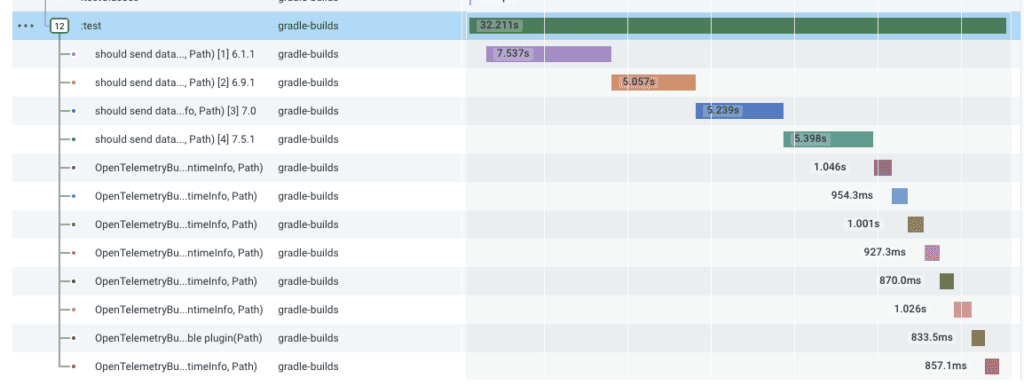
The plugin not only shows what happens in your builds; it can also show all your test cases, so you can see a breakdown of time spent in each test. For example, this trace shows several tests from the plugin’s build:
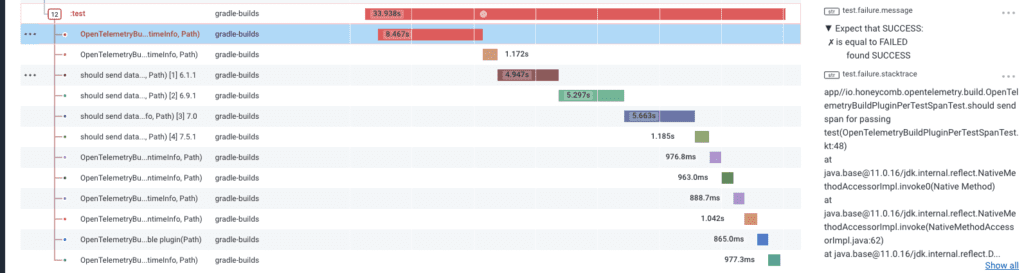
Trace views show you where time was spent during the execution of various tasks, but they can also show you what happens when things go wrong. If a test fails, you can see failure information such as the test failure message and stacktrace directly in the trace view for the build:
Visualizing your builds as traces makes it easy for you to identify where abnormally long operations may be occurring and also helps you spot opportunities for parallelization.
Quickly debug the source of issues in your builds
Visualizing where time is being spent and having access to stacktraces at your fingertips is a good start, but Honeycomb also excels at helping you quickly debug why issues may be occuring in your builds to begin with.
Honeycomb’s BubbleUp feature can show you why tasks behave differently between builds. BubbleUp works by showing you what is statistically different between any two sets of data (for example, data about tests that are succeeding vs. tests that are failing). To use it, you must visualize the performance of your build as a heatmap, then select the data set you’d like to compare against a baseline.
For example, the Honeycomb query below looks at task duration for a project’s test task. You can see several task executions that are much faster than the others.
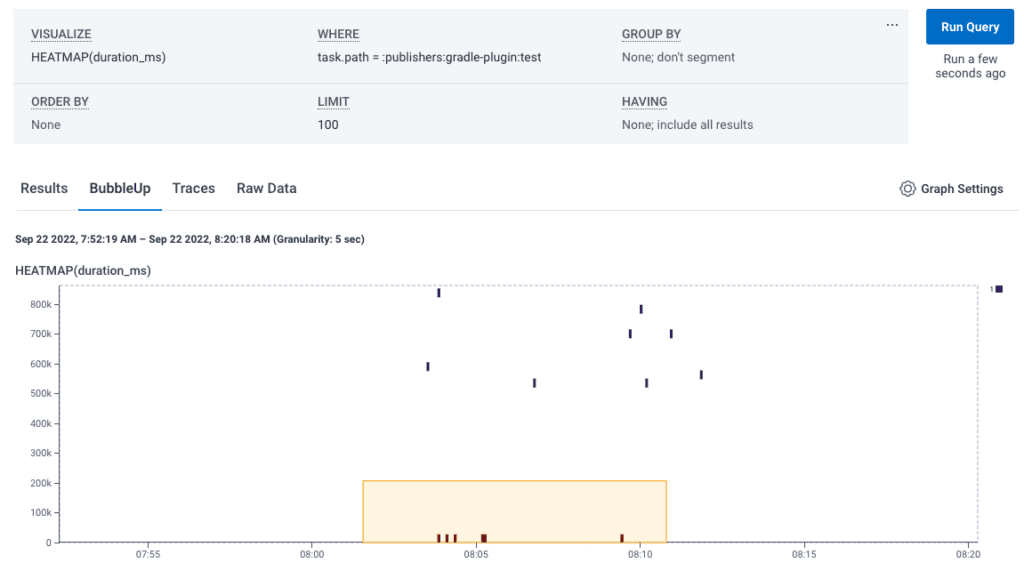
After visualizing the heatmap, clicking on the BubbleUp tab lets you draw a square around any part of the map you’d like to further analyze. Once you select the fast queries at the bottom of the heatmap, BubbleUp automatically calculates how the set of requests you selected (in the box) differ from all the requests that weren’t included in the box (the baseline).
In this example, the BubbleUp analysis shows you that the faster tasks all pulled from cache vs. the slower tasks, which did not.
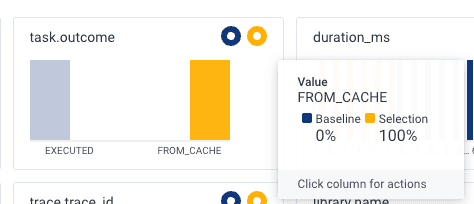
This simple example uses BubbleUp to show the performance improvement of using the Gradle build cache. But when used in your own builds, this same method can quickly show you what’s slowing down your Gradle builds.
Android builds
This plugin also works with Android Gradle builds. For example, here is part of a trace from a small Android app:
Getting started
To start using this plugin, add the following to your plugins block in your Gradle build file:
plugins {
    id "com.atkinsondev.opentelemetry-build" version "1.2.1"
}Version 1.2.1 is the current version (at the time of this writing), and you can find the latest plugin version in the Gradle plugin portal.
Next, add a configuration block to tell the plugin where to send your build information to, and any additional headers you need to send. Honeycomb fully supports OpenTelemetry, so we will set that up as the destination for your telemetry data.
The below configuration will send your build data to Honeycomb:
openTelemetryBuild {
    endpoint = "https://api.honeycomb.io"
    headers = [
            "x-honeycomb-team": "<Honeycomb-API-key>",
            "x-honeycomb-dataset": "<dataset-name>"
    ]
}Replace the placeholders above with your Honeycomb API key and the dataset name you want to use. If you don’t yet have these, sign up for a free Honeycomb account.
- Visit the Honeycomb Sign Up Page and create an account.
- Name your team (any name—like your company name, for example—will do).
- Copy your API key.
You can use any arbitrary name for your dataset. In the example below, we’ll keep it simple and use the name gradle-builds.
To avoid storing your Honeycomb API key in the Gradle build file itself, you can tell Gradle to pull it from an environment variable for CI builds or a Gradle property for local builds with config such as:
openTelemetryBuild {
    endpoint = "https://api.honeycomb.io"
    headers = [
            "x-honeycomb-team": System.getenv("HONEYCOMB_API_KEY") ?: project.findProperty('honeycomb_api_key') ?: null,
            "x-honeycomb-dataset": "gradle-builds"
    ]
}After the build executes, the plugin will print out the trace ID for this build execution:
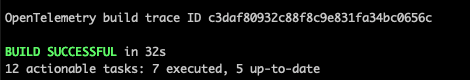
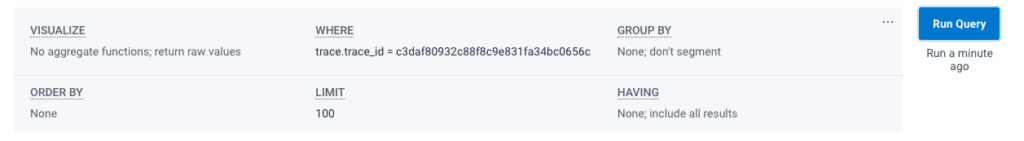
You can use this trace ID to easily find the exact trace for your build execution in Honeycomb by searching in Honeycomb for your build execution’s specific trace ID:
Try it today
This new OpenTelemetry Gradle plugin is available in the Gradle plugin portal. All the Honeycomb features shown above are available in Honeycomb’s free plan and above. My hope is that you find this plugin useful.Please feel free to reach out to me in Pollinators or give me feedback on the plugin’s Github repo.
Thanks!
Craig
Want to know more?
Talk to our team to arrange a custom demo or for help finding the right plan.