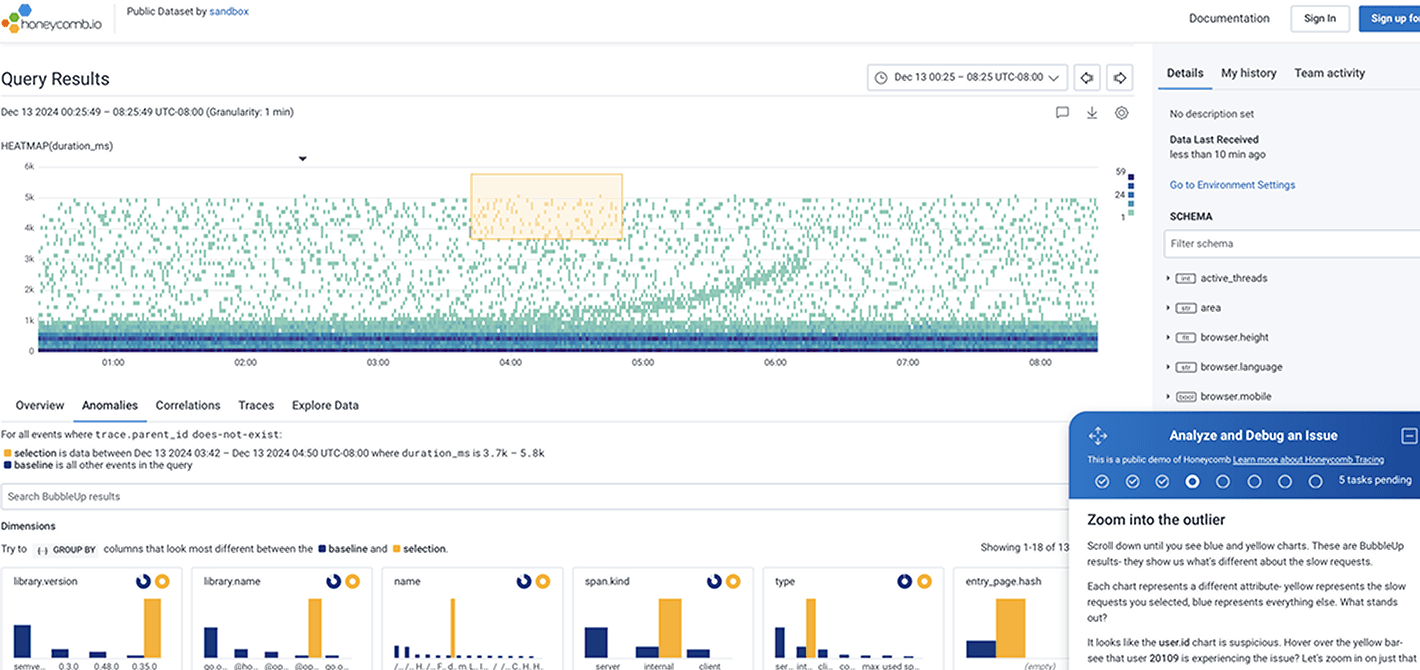
Level up with BubbleUp
Surface outliers in any data and delve into metrics, traces, and logs to get to the bottom of any issues.
Why you’ll love Honeycomb
Pinpoint with precision
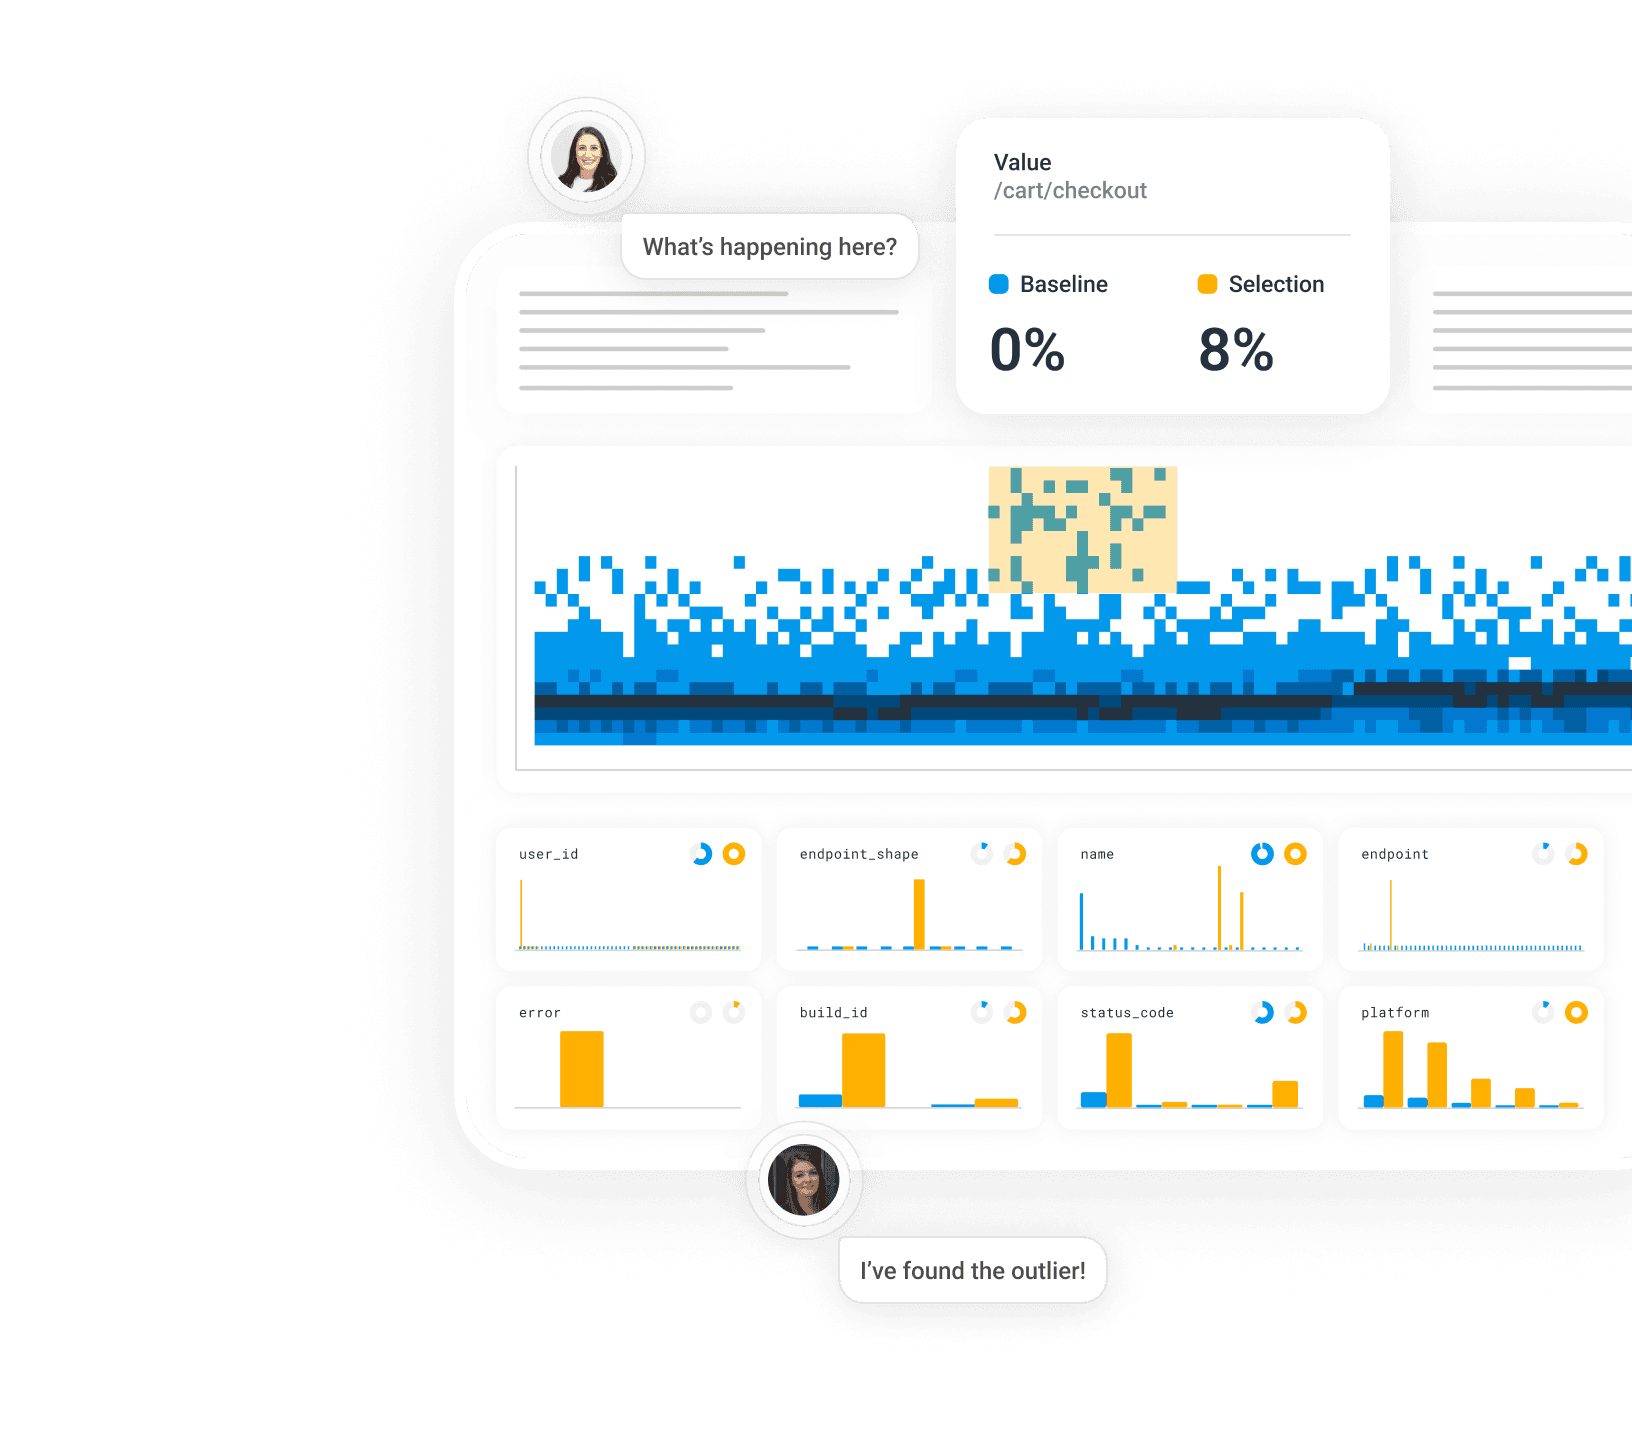
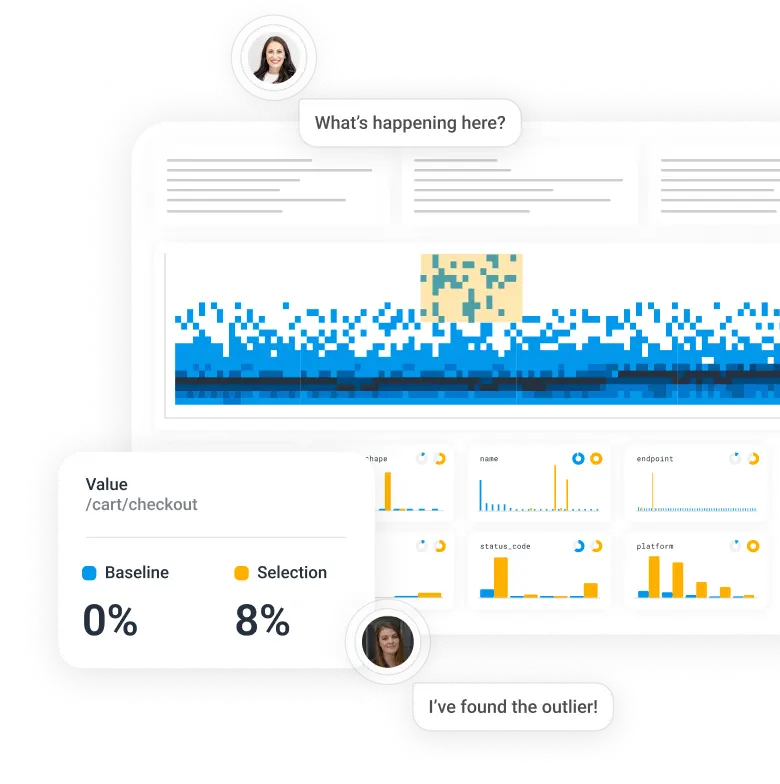
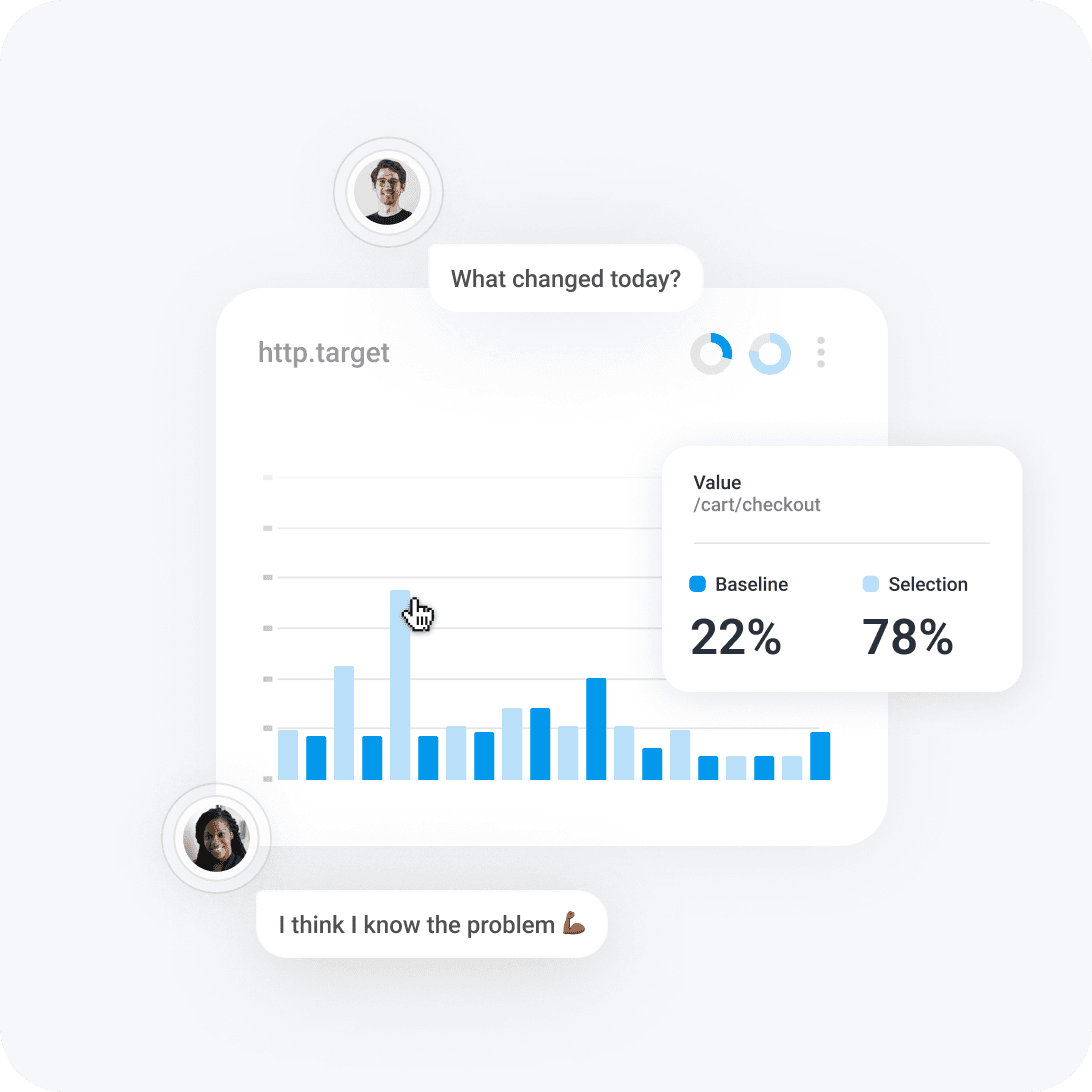
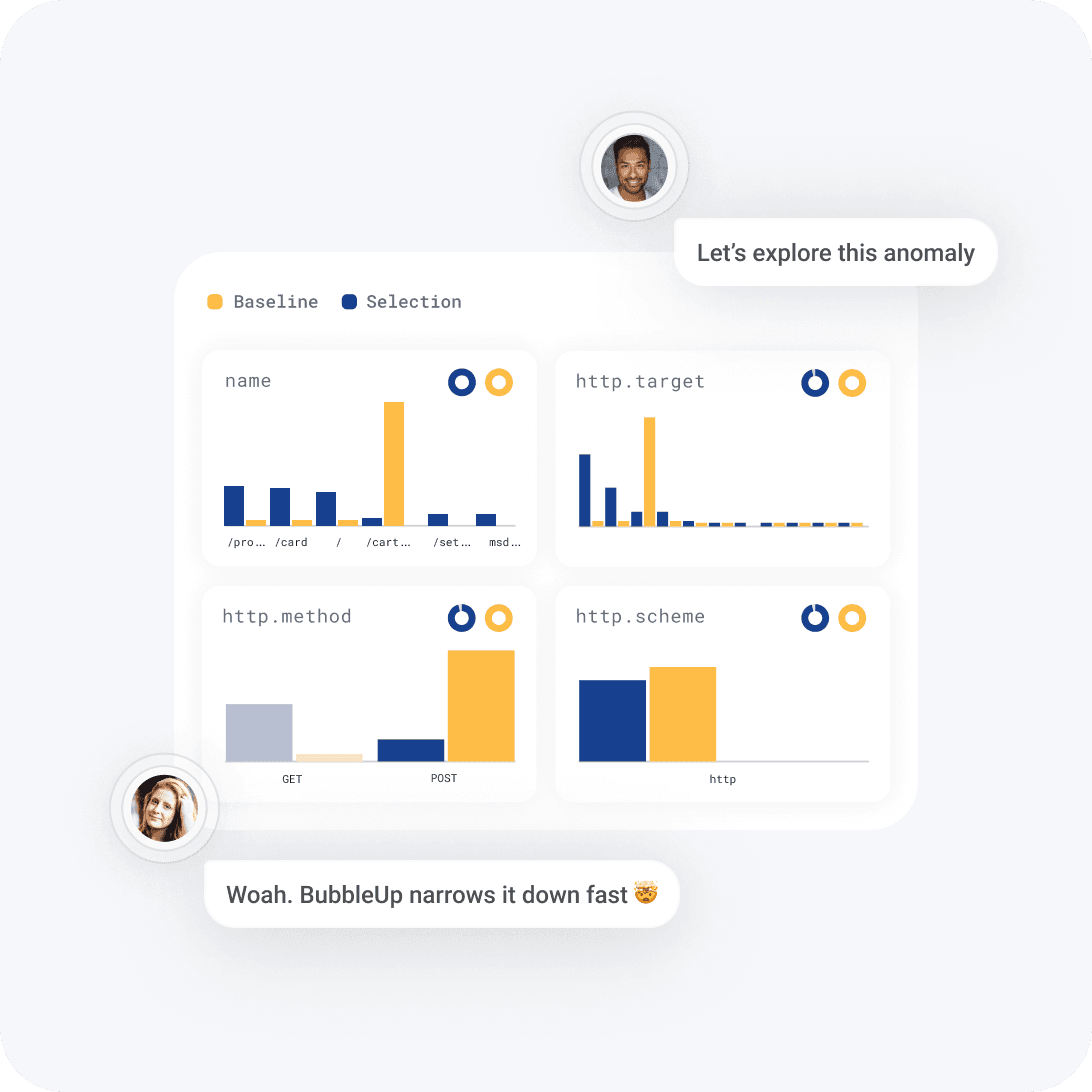
Highlight anomalies across thousands of events. Narrow problems down to their specific host, service, pod, database, or region—starting from nearly any query.
Understand root causes
Answer the most important question of all—why? Surface interesting and useful insights that help you identify who’s impacted by an issue and what caused it.
Democratize debugging
Intuitive yet powerful, BubbleUp is an easy-to-grasp visualization tool. Any team member can quickly identify outliers for further investigation.
See how it works
Watch a demo or try it for yourself in our sandbox—no registration required.
The features at your fingertips
Automatically identify outliers
Machine analysis highlights hidden relationships across hundreds of dimensions. Select a range of telemetry that stands out to understand what’s different compared to the relevant baseline.
Find hidden patterns with auto-correlation
Use BubbleUp to analyze any query result in an instant to help you triage, identify, and resolve issues before they impact customers.
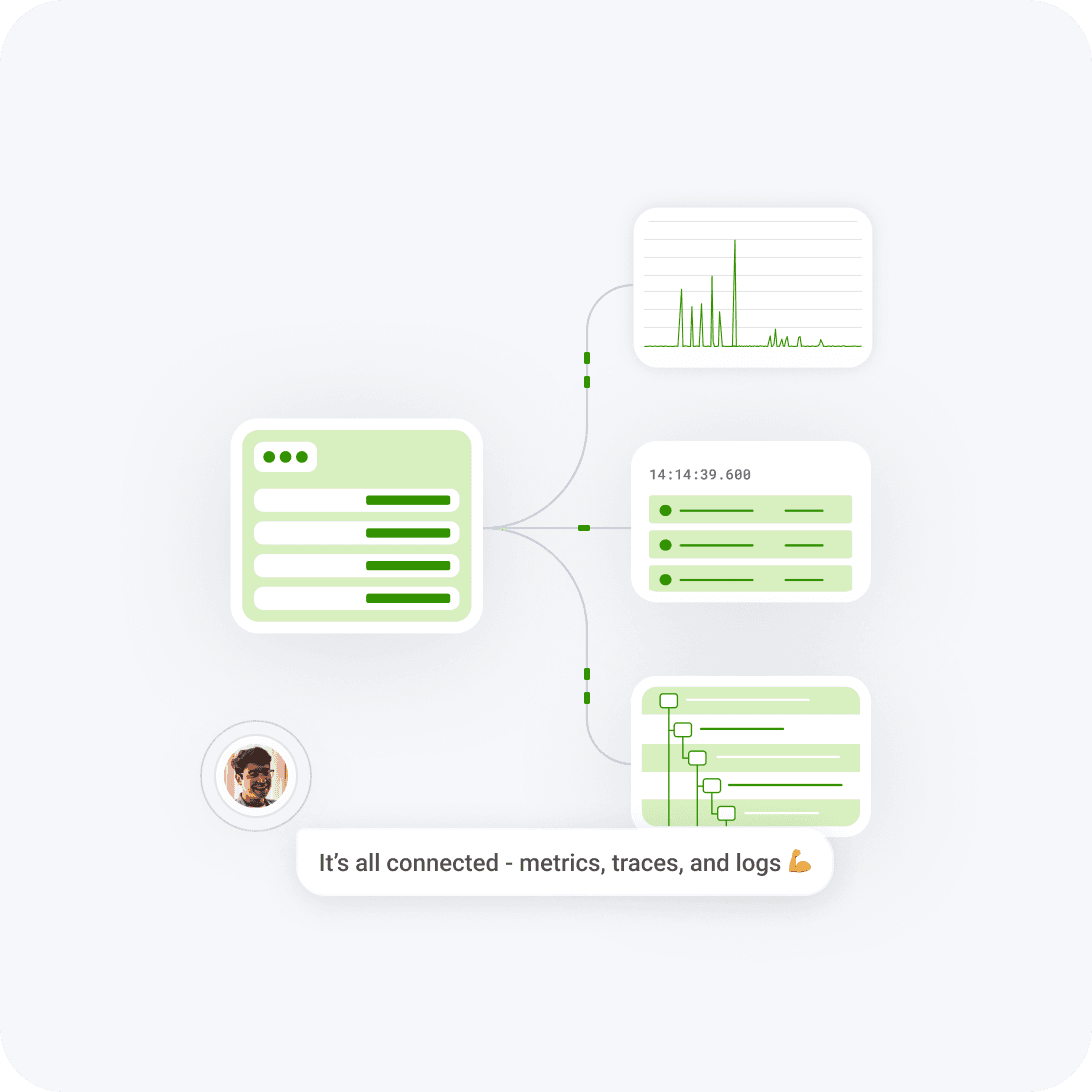
Unified telemetry
Discover correlations across metrics, logs, and traces without having to switch between tools. Follow the trail, wherever it takes you.
Honeycomb has been invaluable in helping us build a cutting-edge platform to drive our institute’s high-impact mission forward. And powerful features, like BubbleUp and native support for OpenTelemetry, have been gamechangers in modernizing our observability practices.

Simon Davy
Senior Research Software Engineer, Bennett Institute for Applied Data Science, University of Oxford
Related features
Spans with lots of useful fields + Honeycomb’s unparalleled speed = incredibly powerful experiences built on your data.
Give it a try in our sandbox
Identify an issue, assess how widespread it is, and pinpoint where to fix it with BubbleUp in our Sandbox.


Want to know more?
Talk to our team to arrange a custom demo or for help finding the right plan.