HoneyByte: Incremental Instrumentation Beyond the Beeline
“It turns out,” said Liz, “it was not a giant pile of work to start adding those rich instrumentation spans as you need them.” Liz Fong-Jones was telling dev.to’s Molly Struve about an error…

By: Shelby Spees
“It turns out,” said Liz, “it was not a giant pile of work to start adding those rich instrumentation spans as you need them.”
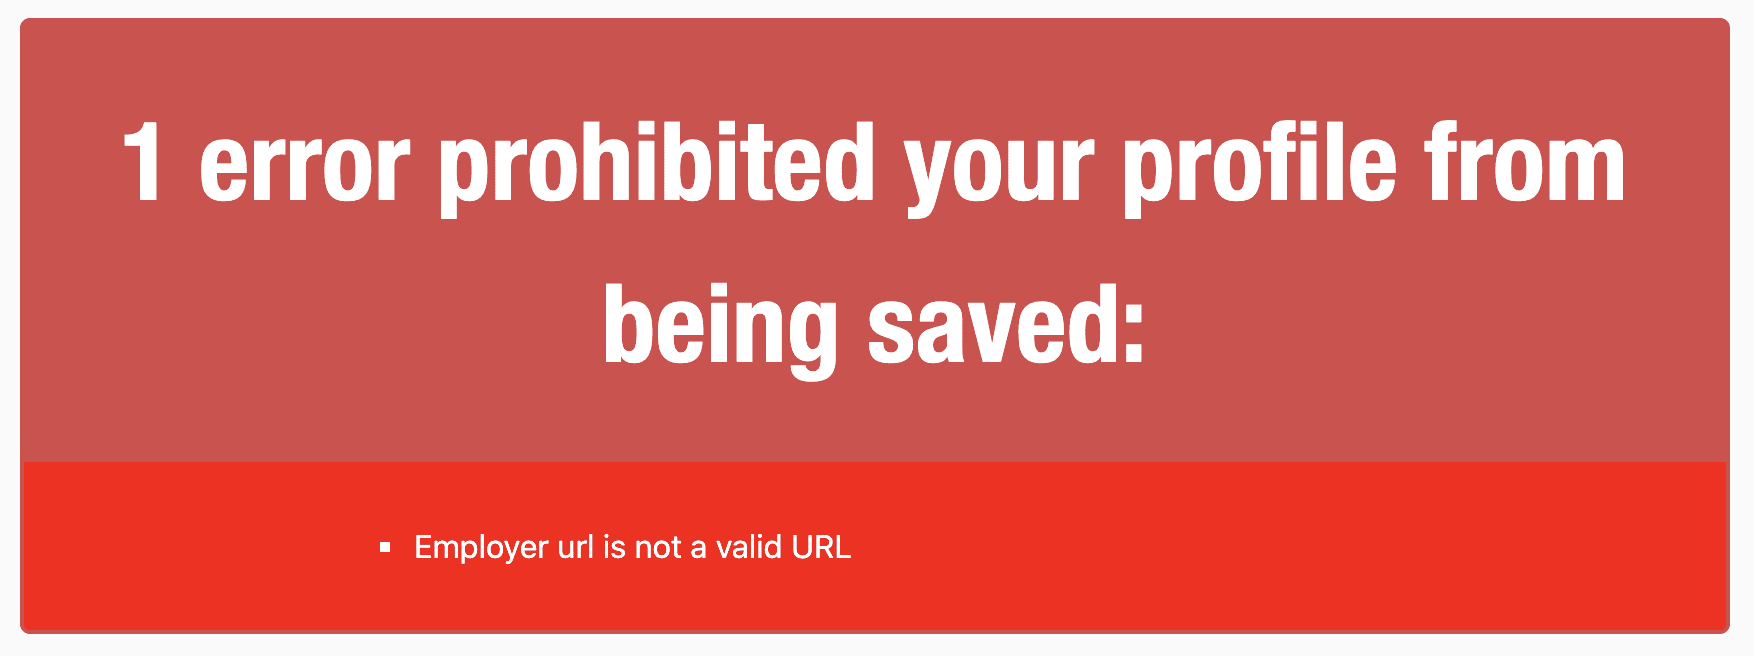
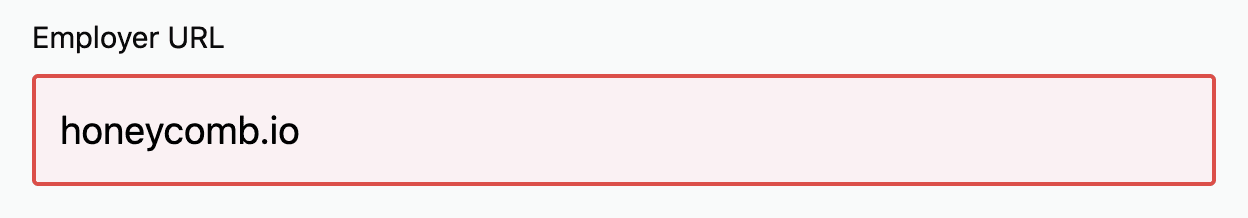
Liz Fong-Jones was telling dev.to’s Molly Struve about an error she encountered while trying to update her dev.to profile. When she entered honeycomb.io into the Employer URL field, the app responded with an angry red box:
dev.to’s URL validator is quite picky—it rejects anything not prepended with http or https. Most users won’t think to include that, however. Liz certainly didn’t.
Faced with this error message, Liz thought, “Gee, thanks. That’s really not helpful.” Then she removed her frustrated user hat and exchanged it for her engineer hat. “I was really really curious. How often is this happening?”
In a previous HoneyByte, we showed how Molly Struve integrated the Ruby Beeline with dev.to’s Rails codebase in one step.
Leaning on the Beeline integration, which already wraps the app’s requests in spans, Liz opened a pull request on GitHub with two changes to the update method of the users_controller.
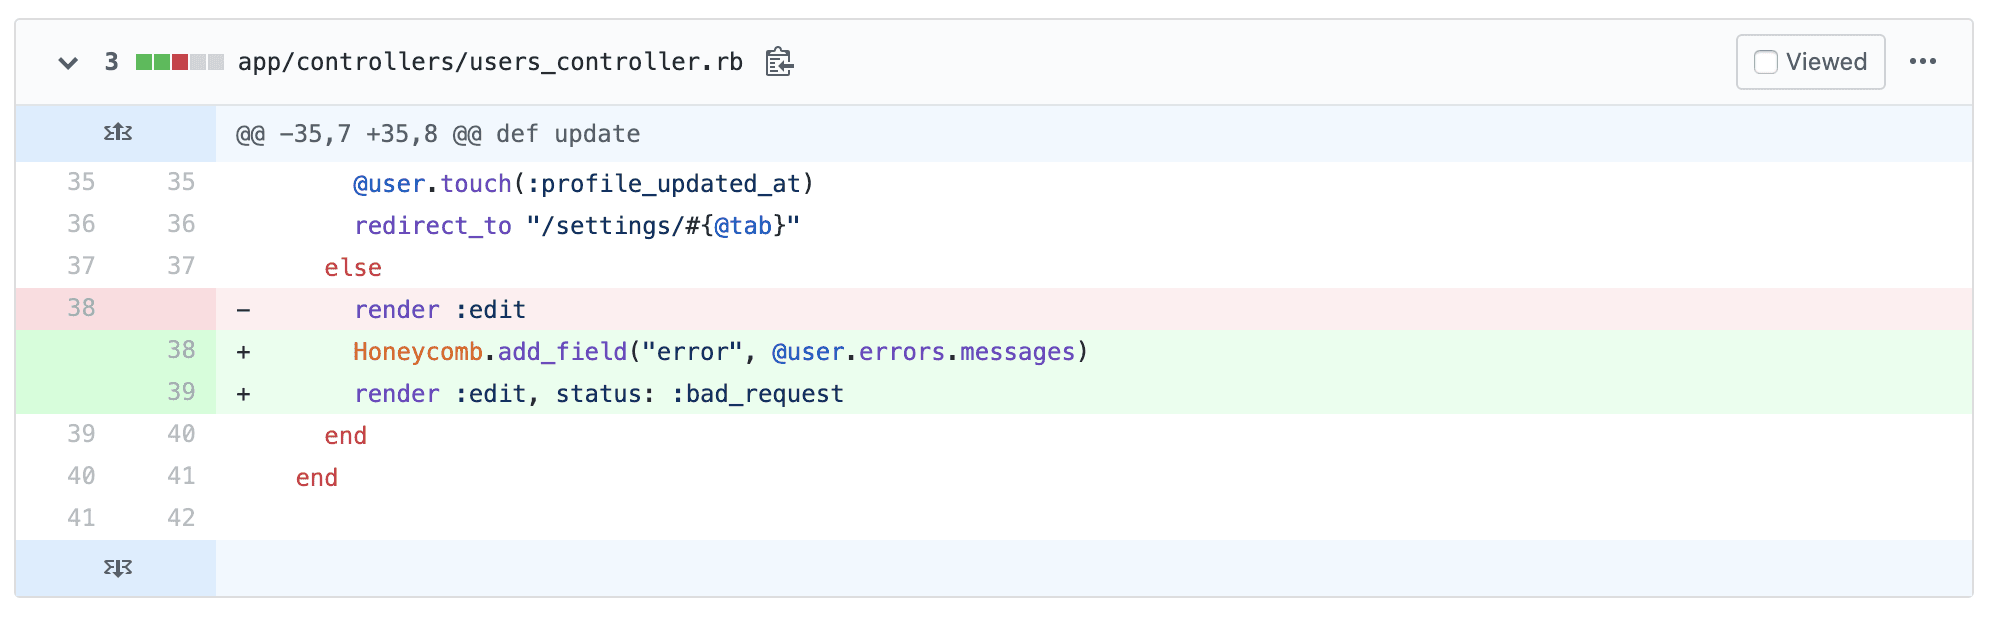
First, she added an error field so that the user-facing error message gets added to the current span’s context:
Honeycomb.add_field("error", @user.errors.messages)Then she made sure the update method returned a 400 BAD REQUEST for any invalid user input, which is the reason for ending up in that else clause:
render :edit, status: :bad_requestOnce her PR got merged, Liz reproduced the error by making the same edit to her dev.to profile Employer URL, returning the same error message. Then she went into Honeycomb to validate that the new contexts fields got sent along with her request:

Great, the PR was a success!
Catch All the Errors!
It turns out, Liz’s pull request didn’t just add instrumentation for the Employer URL field. Now dev.to is sending new context for any update request where a user encounters an error.
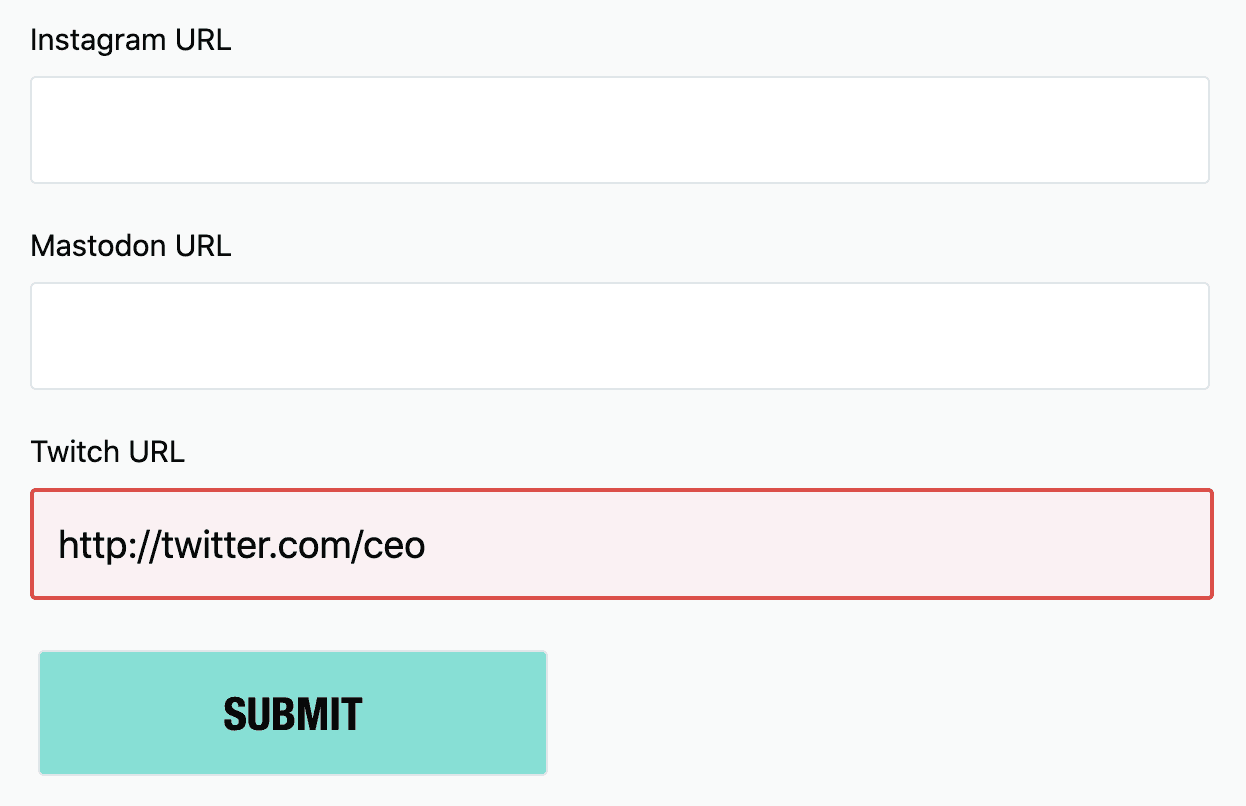
Liz wanted to see what other errors might be interesting. Since she streams on Twitch, she queried for all instances of invalid Twitch URL input. What she found was surprising.
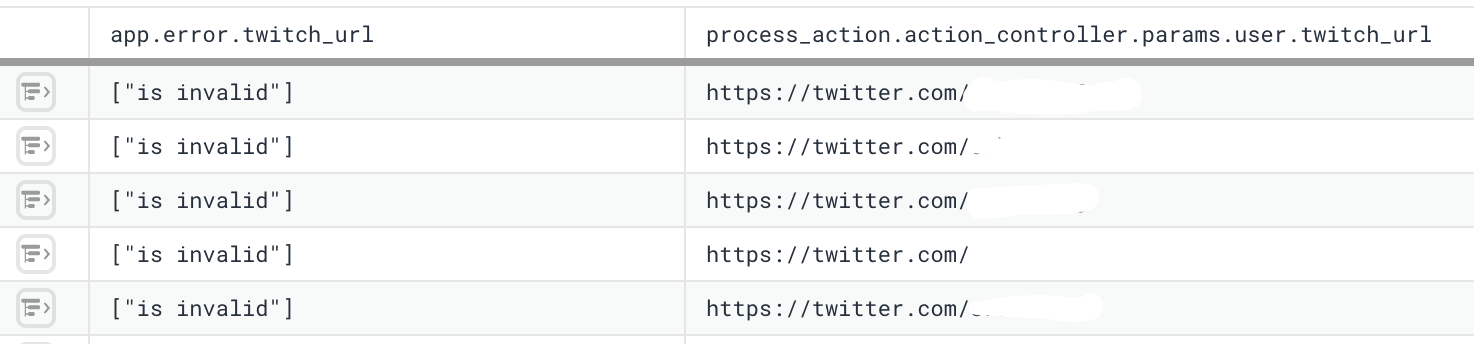
dev.to users were entering their Twitter URLs into the Twitch URL field! After seeing the data, the user flow jumps out: People quickly scrolling down to fill out profile fields could easily mix Twitch with Twitter.
“When I was solving the ‘I can’t update my employer URL,'” said Liz, “I did not anticipate being able to debug Twitch URLs and any other field that gets added in the future to the users page. But now that’s been done with two lines of code.”
There are numerous design solutions for this bit of friction, but it’s likely that it never would have been discovered without Liz’s change.
Compare with Traditional Metrics
Let’s imagine investigating this trend using time series metrics.
For those who have tried to instrument your return status codes like what Liz did, you probably saw a number of 400 errors in production and scratched your head, unable to connect the errors to the code that sent them. Invalid user input doesn’t throw an exception, so it won’t be caught by error monitoring tools. You’d never learn about users confusing the Twitch URL field with Twitter URL.
Let’s say your CEO found the Twitch/Twitter issue while trying to edit their own dev.to profile and specifically asked you to find out how frequently it occurs.
In order to track the Twitch URL issue, you need to count that error message in isolation. It’s relatively manageable to add statsd metrics for the dozen or so input fields on a dev.to profile, but you may decide to only count the twitch_url if that’s all you’re being asked about.
if @user.errors.include? :twitch_url
  $statsd.increment("error.twitch_url")
endWithout your CEO’s specific question, you have to decide in advance to send error messages in the first place. You might count every kind of error in your model:
@user.errors.keys.each do |key|
  $statsd.increment("error.#{key}")
endIn Rails we can take for granted that the error keys are limited by the columns in the User model, but in a different context it can be risky to generate metric names dynamically. If you have unpredictable error names and create statsd counters on the fly, you’ll end up with an unbounded explosion of metrics, each with only a few occurrences. In the mean time, you’re being charged for each one. That cost adds up quickly, which results in teams that are averse to sending data.
On top of that, adding counters for errors only gets you so far. Unless you’re also tracking the parameter that was considered invalid, there’s no context that’ll tell you that users are mixing up the Twitch URL input field with Twitter.
If, for some reason, you actually thought to send the invalid parameter as its own metric (unbounded high cardinality be damned), you still have to do the work of matching the bad input to the 400 errors! It’s painful to query for this in time-series graph visualizations. You’re squinting at disparate graphs, each with a single occurrence of the thing you care about. At the end of the day, you’re just seeing aggregate counts and trying to reverse-engineer the user flow.
The Twitch/Twitter URL issue will likely remain invisible, even with the granular metrics you’ve added. Understandably, most teams won’t bother.
Compare this with Liz’s instrumentation. By adding a single field, you get rich data for a variety of contexts. No counters necessary. You gain observability into friction in your user experience that doesn’t get surfaced in bug reports. This opens the door for granular A/B testing, feature flagging, and usability research.
Your Turn!
You probably already have a commonly-tread path in your codebase that’s instrumented with Honeycomb, especially if you’re using one of the Beelines. Look for somewhere in your business logic where you return an error that isn’t an exception. For example:
- bad user input
- permissions error
- network error
What context are you currently sending to Honeycomb? Are there more fields you can add? Don’t be afraid to send wide events with many context fields. Honeycomb is designed to handle it!
Having trouble getting your data in? Seeing missing span in your trace output and you can’t figure out why? Connect with us at support@highfidelity.io, or via Support → Talk to us within Honeycomb or shoot me an email: shelby@honeycomb.io
Want to know more?
Talk to our team to arrange a custom demo or for help finding the right plan.