Honeycomb Sandbox: Test Drive Honeycomb Without Signup or Setup
Honeycomb Play is an interactive sandbox that lets users explore Honeycomb’s data-enriched UI through a guided scenario. The hands-on experience takes a deep dive into how Honeycomb enables you to identify issues, assess their impact, and diagnose their causes for remediation.

By: Nick Rycar
Honeycomb Sandbox is an interactive sandbox that lets users explore Honeycomb’s data-enriched UI through a guided scenario. The hands-on experience takes a deep dive into how Honeycomb enables you to identify issues, assess their impact, and diagnose their causes for remediation. There is no requirement to sign up—simply dive in and get started right away!
Let’s play
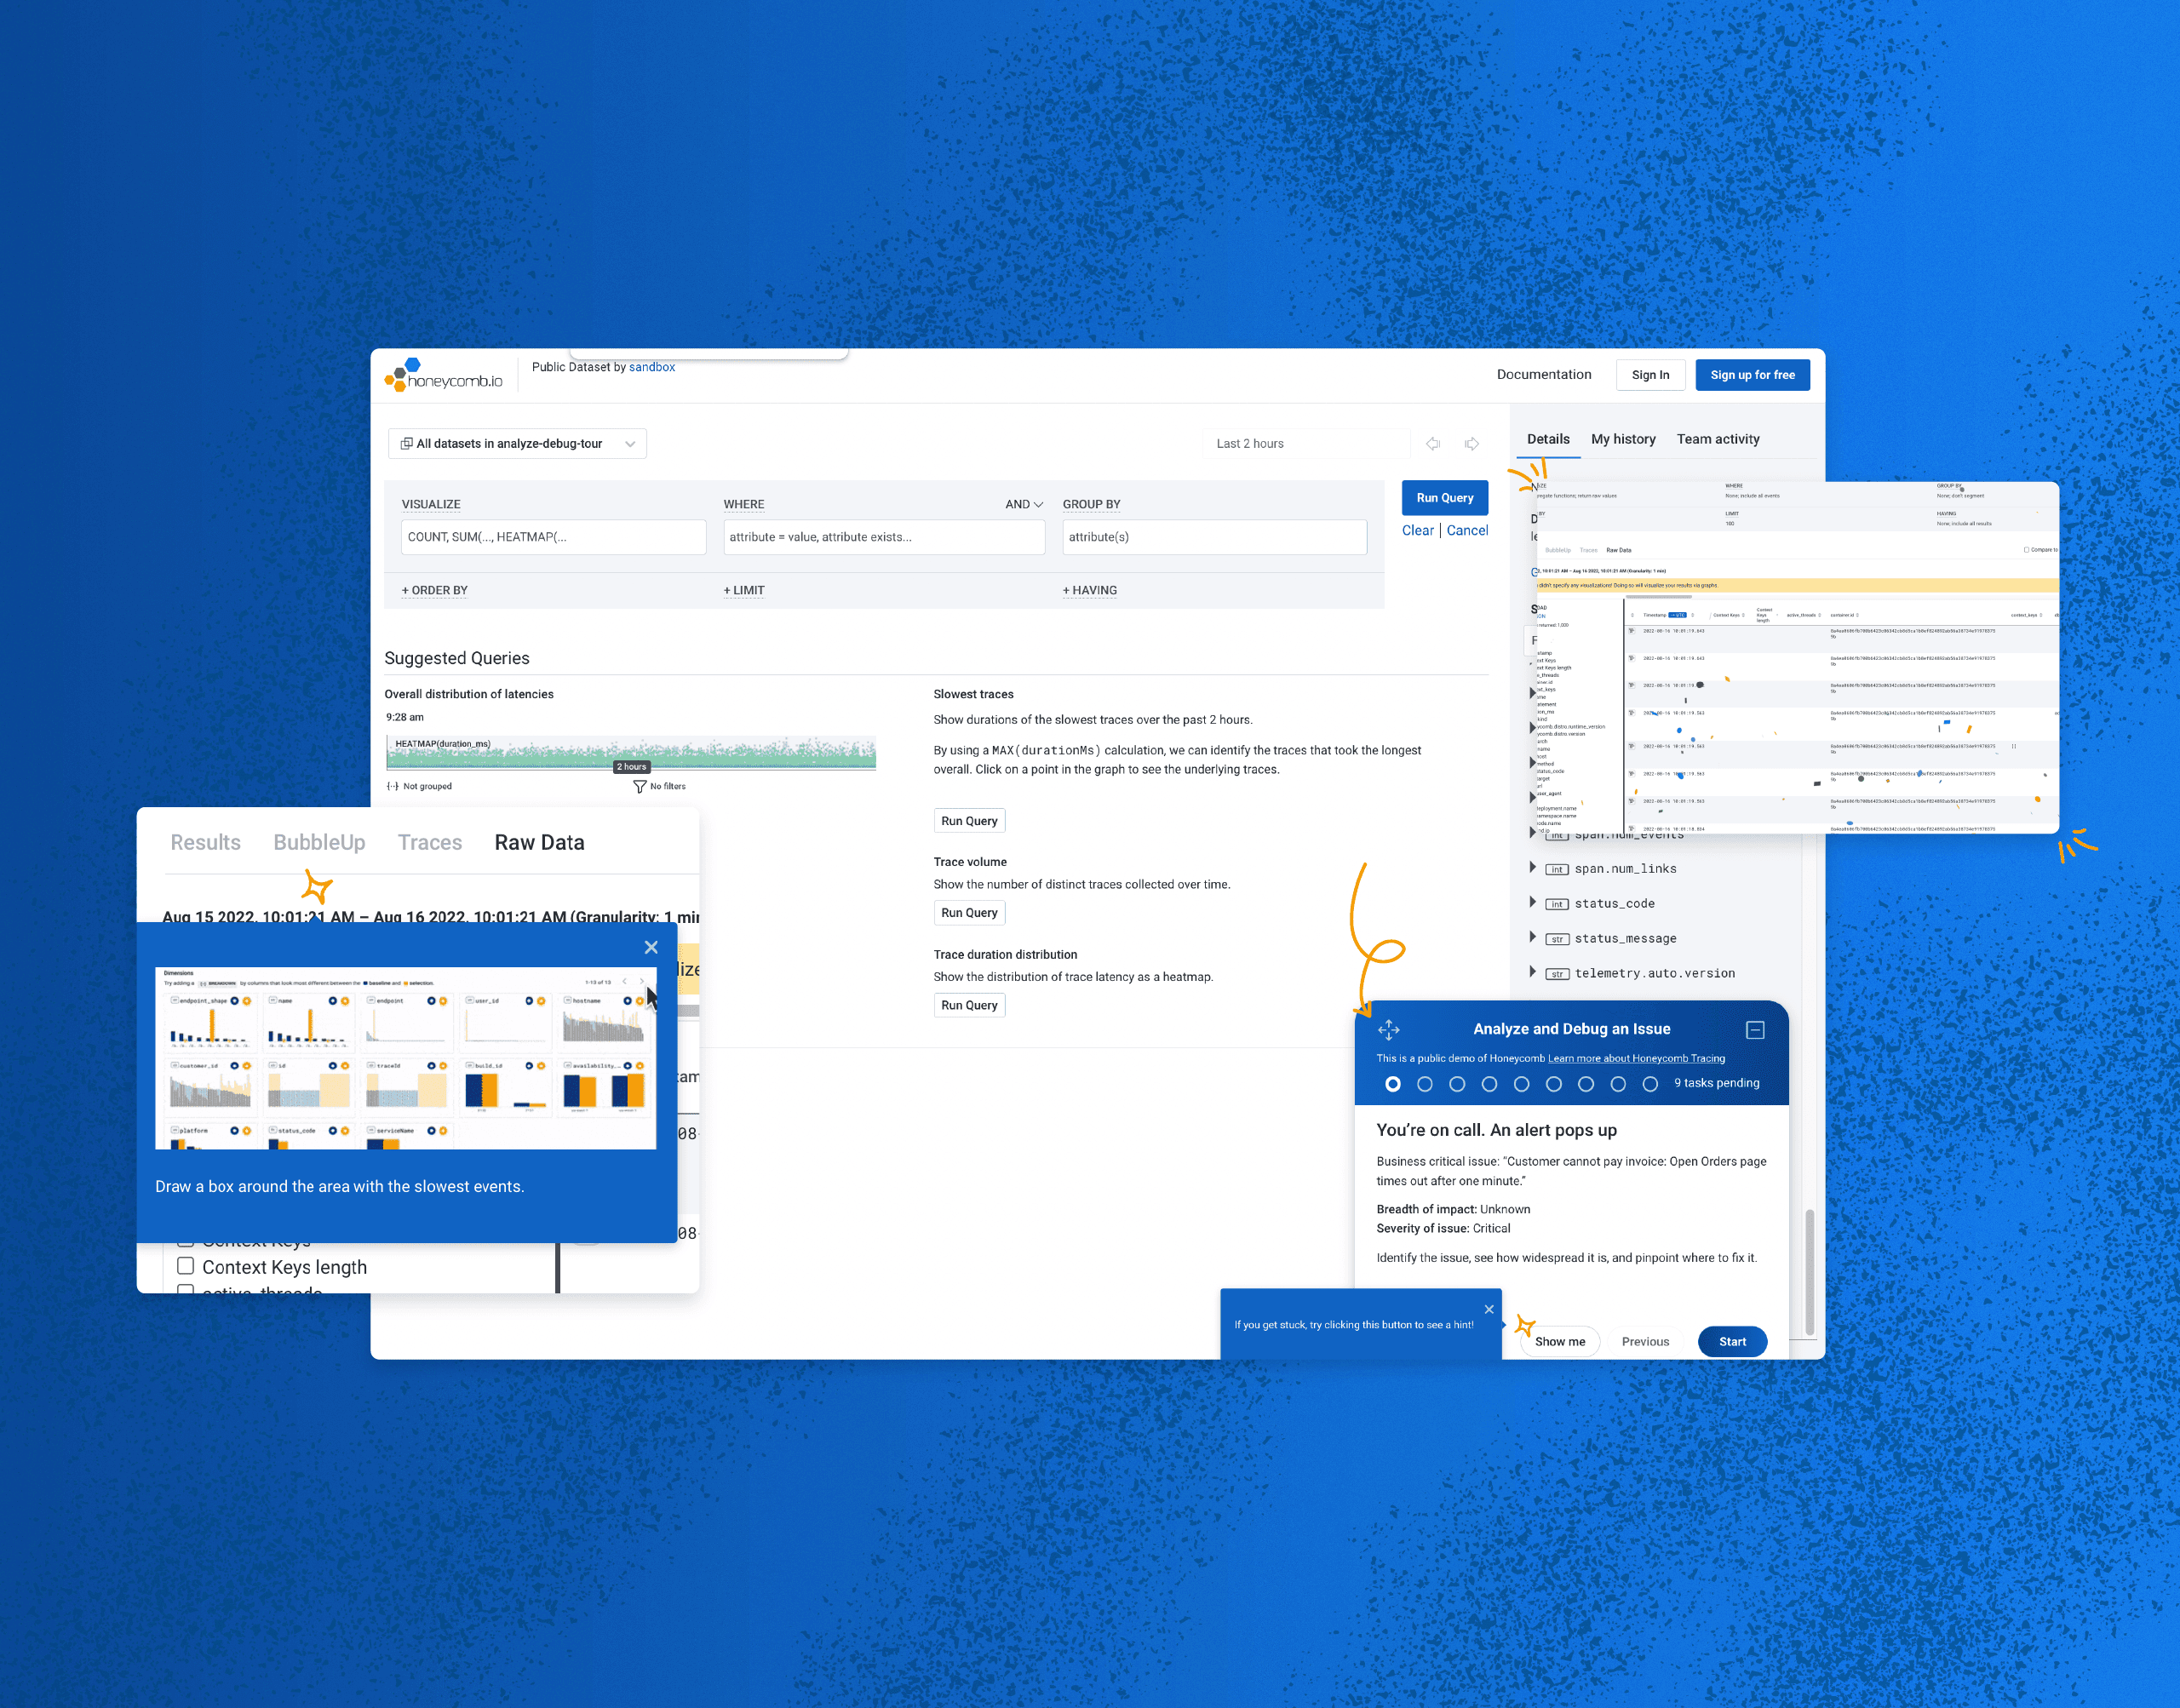
As soon as you launch Sandbox, you’ll be presented with a common use case: your orders page is timing out and customers cannot pay their invoices. The self-guided walkthrough will show you step by step how Honeycomb enables you to investigate the issue, analyze your data, and debug. Click start in the lower right hand navigation box to begin.
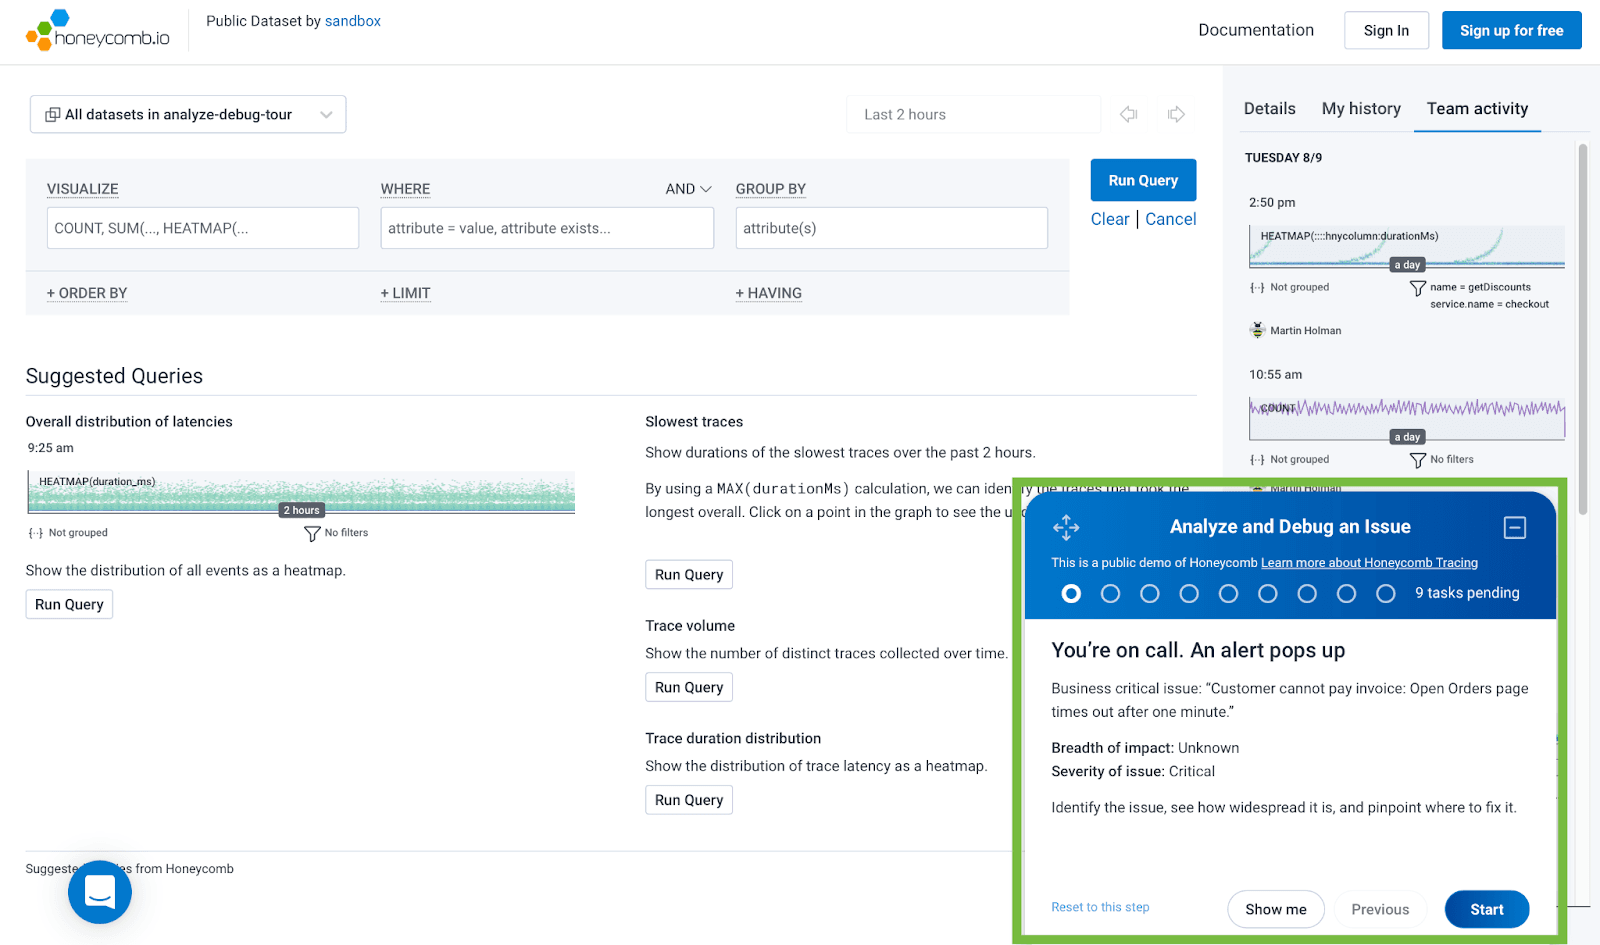
If the navigation box gets in your way, you can move it by simply dragging the arrows in the upper left corner or minimizing it using the icon in the upper right.
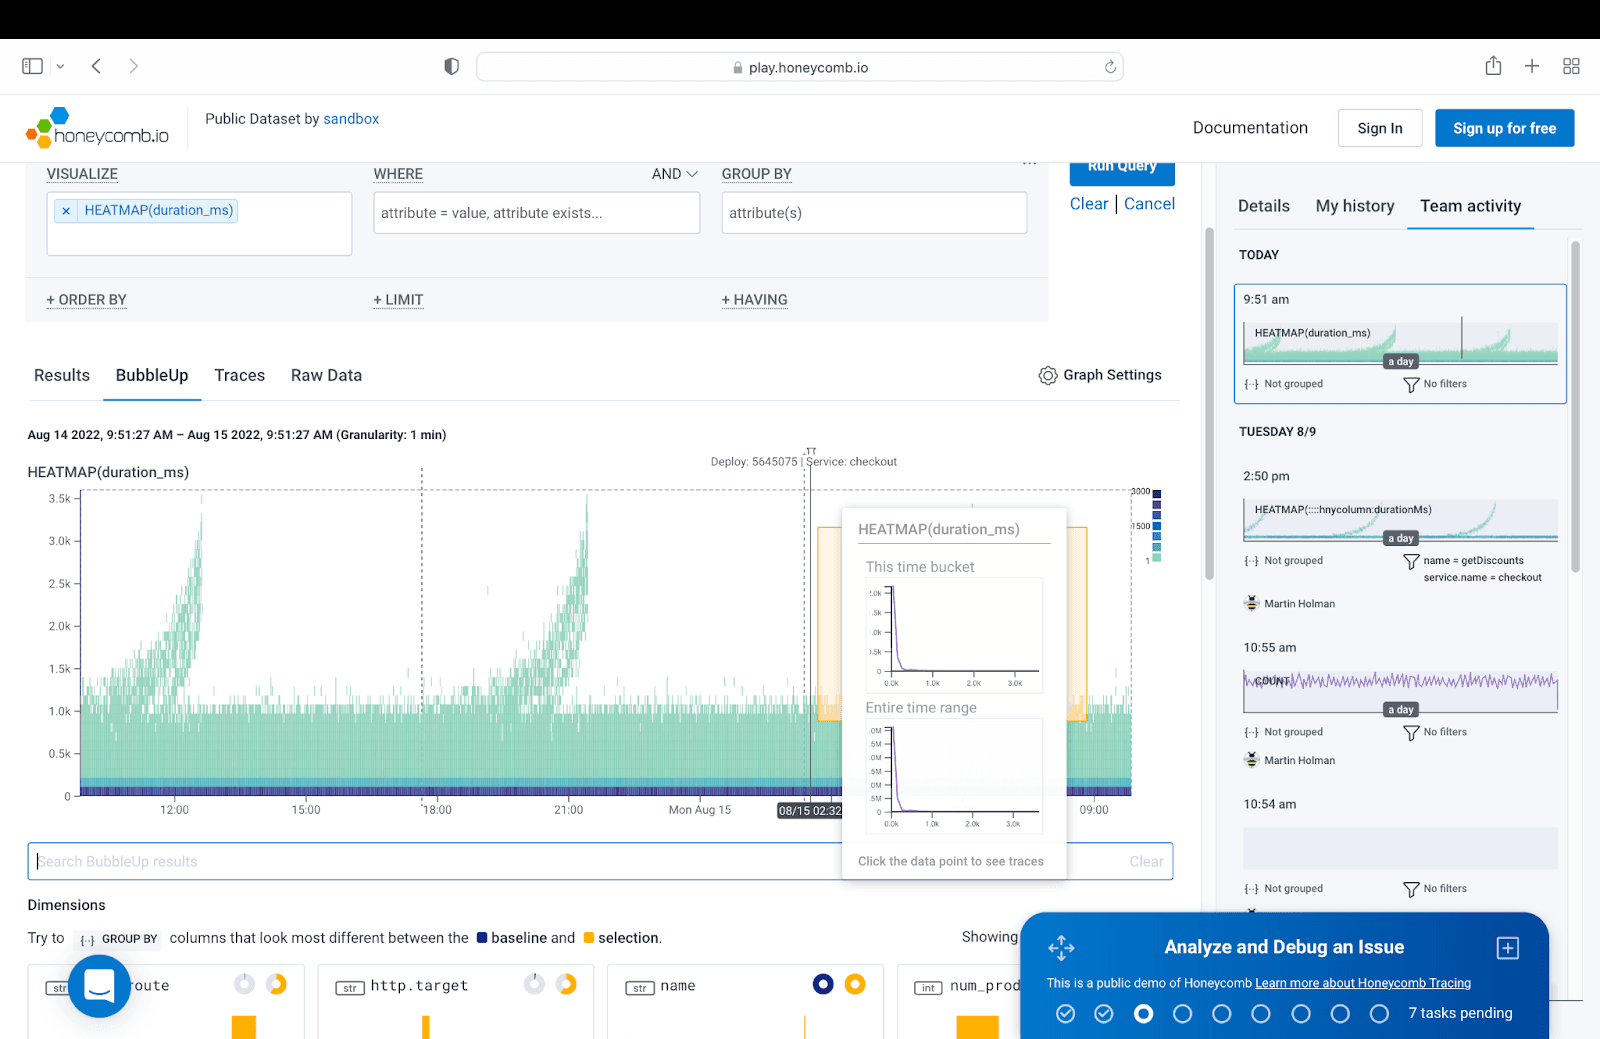
Using heatmaps
As you progress through the scenario, you will learn how to analyze a heatmap. Honeycomb loves heatmaps, and there’s a good reason for this. Heatmaps present you with a visualization of your data so you can quickly identify issues for investigation rather than having to grep, or search through huge amounts of information—a process that can often be lengthy and resource-intensive. When your customers can’t process orders, like in this scenario, every second counts.
Learn the BubbleUp workflow
Once you have identified an area for analysis, you’ll investigate using the BubbleUp workflow. BubbleUp is one of Honeycomb’s most powerful features and can be thoroughly explored in Sandbox.
So far, in our scenario, we’ve asked a relatively straightforward question: “Which are my slowest events?” Next, we start to ask more complex and nuanced questions of our environments— specifically, “What’s different?”
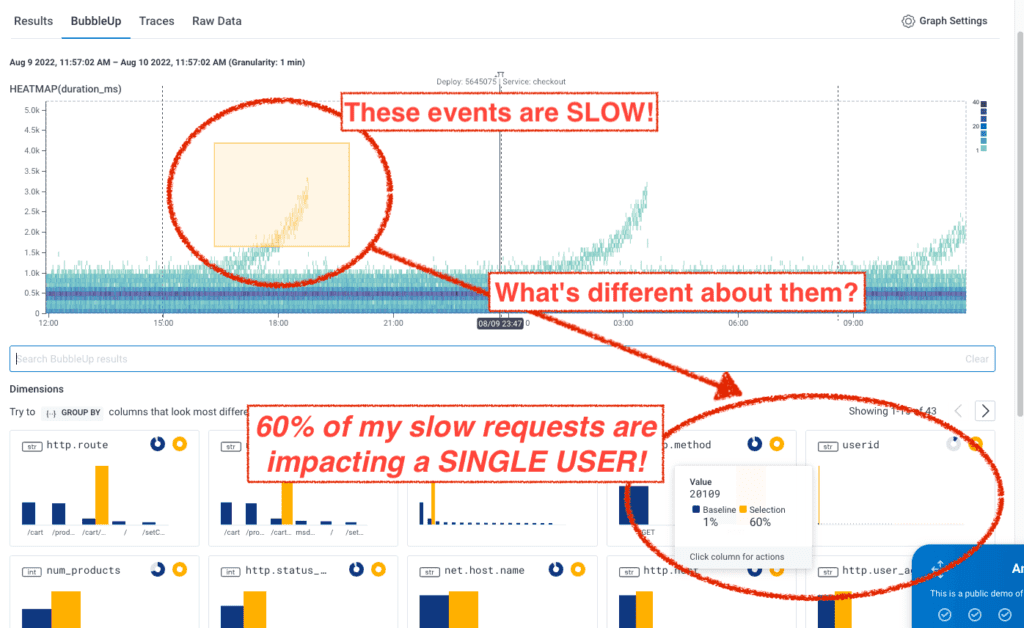
BubbleUp provides a way to rapidly uncover anomalies and find answers quickly—to questions you didn’t even know you were going to ask. There is a lot you can do with BubbleUp. For a more detailed overview, you can watch this video.
Using traces
Once you have identified your outlier using BubbleUp, you’ll use traces to explore even deeper. The Traces feature is a waterfall display depicting the end-to-end journey of the request. You can see that in this case, getDiscounts is very slow.
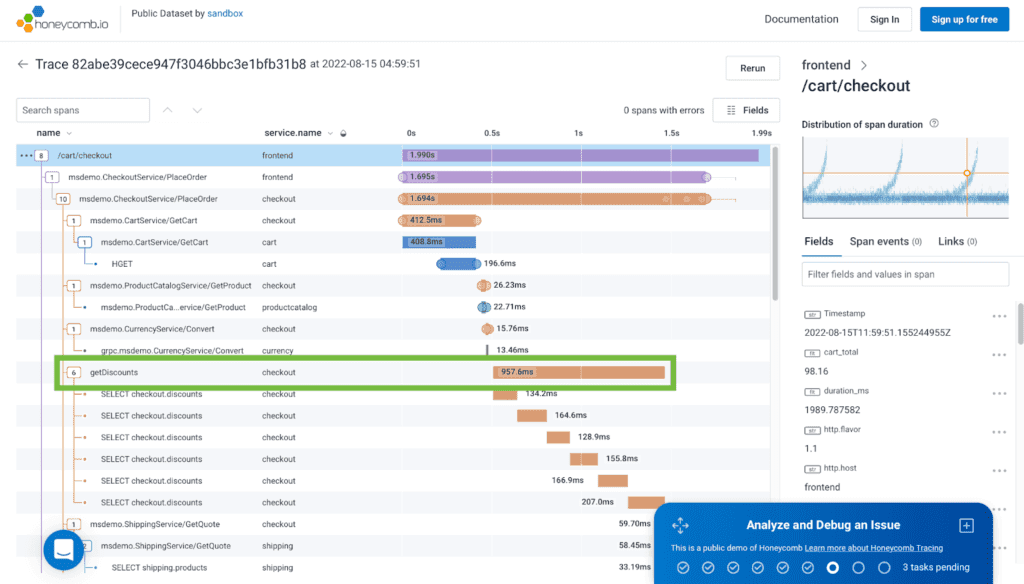
Again, all of this data is presented in a visual format, providing an overview snapshot of the areas of your environment that you want to zoom in on.
To find the source of the issue, you can drill down even further into getDiscounts and view a more granular heatmap displaying exactly when the issue occurred.
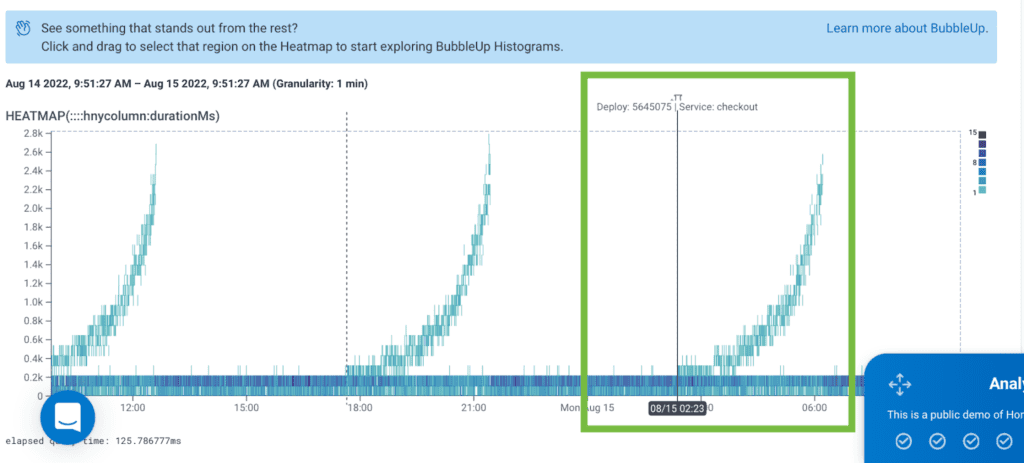
In this case, you’ll see that the problem began following a deployment. The heatmap even displays the date and time of the deployment so you know exactly when the issue began and where to revert back to.
Tips and tricks
Honeycomb Sandbox also lets you explore beyond the step-by-step walkthrough and play with additional features, such as individual and team activity histories, and view a detailed list of the granular raw data Honeycomb parses.
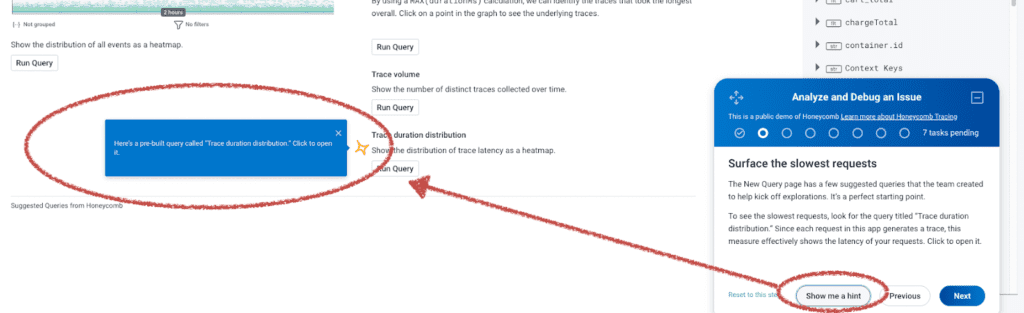
Additionally, if you’re not sure what to do next to progress the scenario, the “show me a hint” button is there to help. When pressed, it will pop up a tooltip near the relevant part of the screen for the step you’re currently on to give you a nudge in the right direction.
Try it for yourself
The features explored in Honeycomb Sandbox are just a sample of everything that you can do, but if you’re new to Honeycomb, or even new to the concept of observability in general, it’s a great place to start exploring what you can do with your data. Come try out Sandbox today.
Want to know more?
Talk to our team to arrange a custom demo or for help finding the right plan.