Play with live scenarios
Explore public, no-strings-attached versions of Honeycomb and see the power of observability in less than 15 minutes.
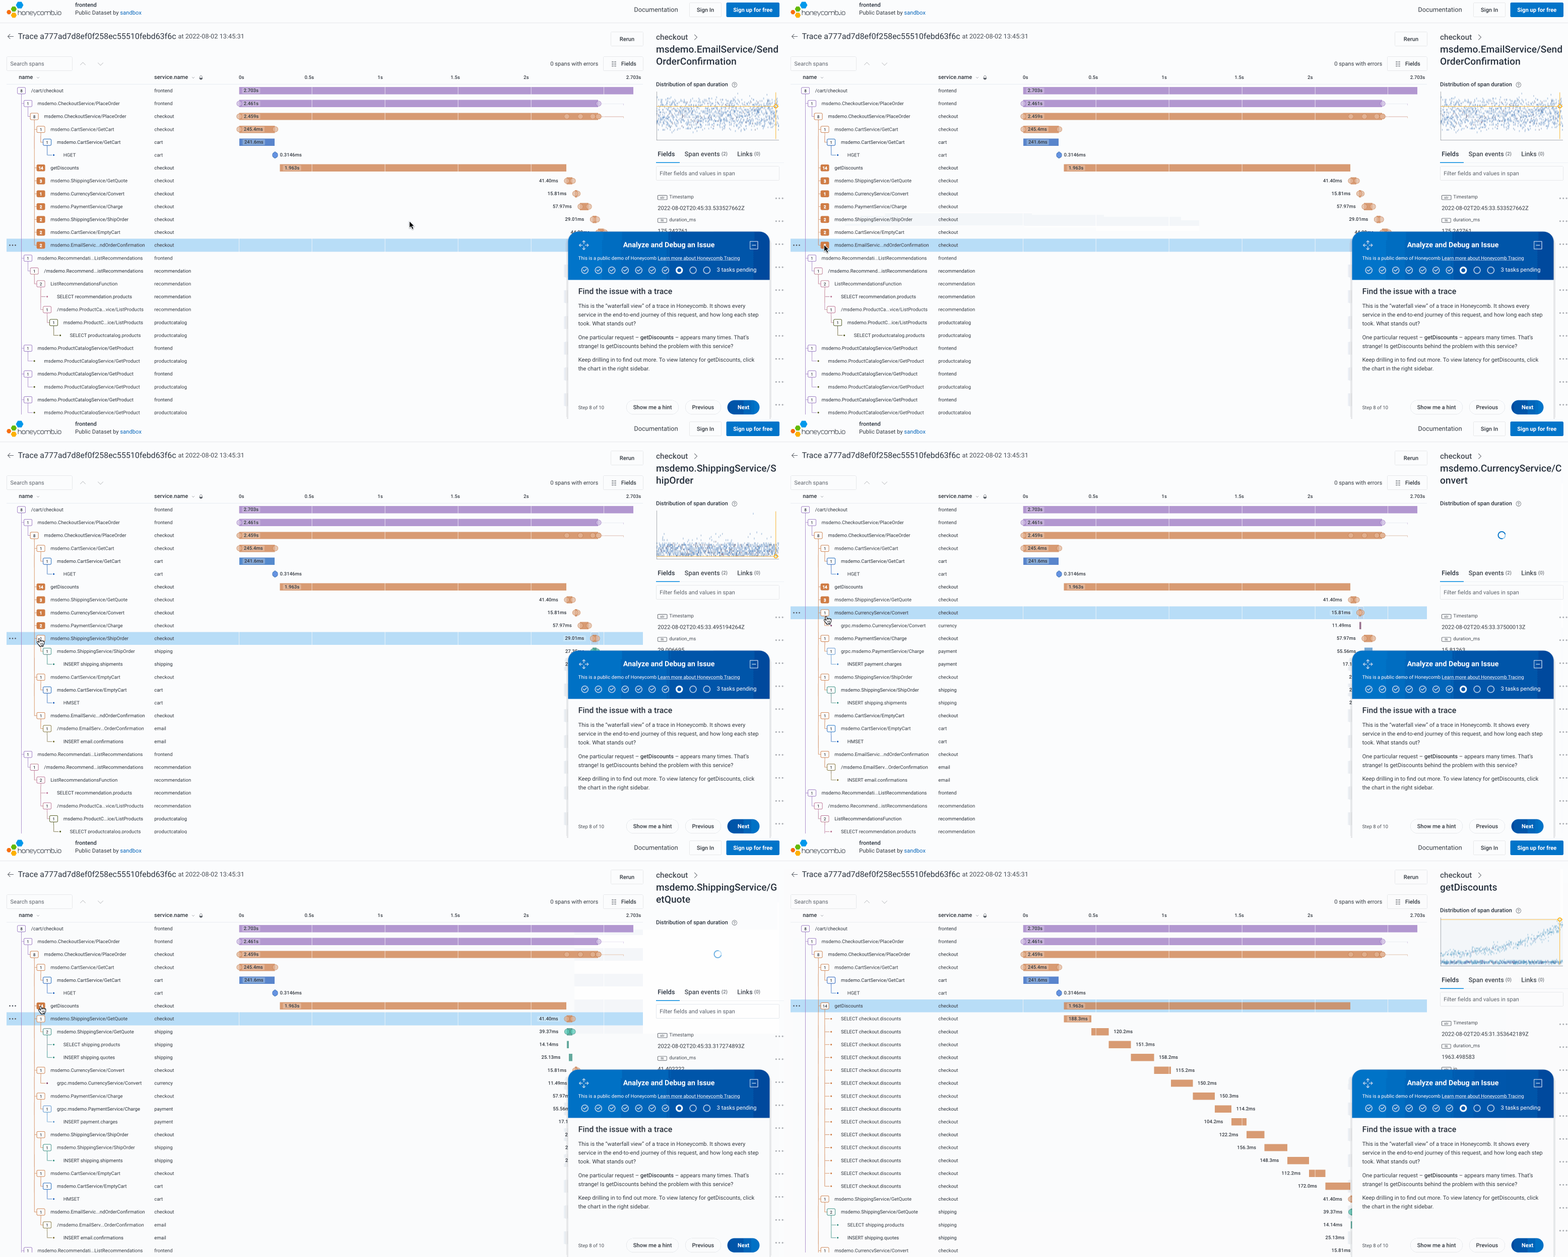
Play with Tracing and BubbleUp
Honeycomb Tracing shows the time and resources taken to service any request, making it easy to diagnose bottlenecks, optimize performance, and understand how your system processes requests. BubbleUp makes it easy to figure out why some events are running more slowly than others.
In this scenario, we’ll walk you through using these tools to diagnose reported API slowness from a handful of users. In 10 steps (~15 minutes), you’ll go from an alert to finding the problem and identifying the users who are experiencing it.
Play with Live Data
Explore a public, no-strings-attached version of Honeycomb and see what it’s like to work with real-world Fastly data.
Honeycomb has partnered with the fine folks behind RubyGems to offer a public dataset containing data collected via our Fastly integration. Click through to explore rubygems.org traffic today and see how powerful Honeycomb can be when sent events rich with context relevant to your business.
Play with Events
In May 2018, Honeycomb experienced a product outage which we documented in our post-mortem on our blog. We uploaded the (anonymized) production data from that outage into a sandbox environment of Honeycomb.
In this scenario we’ll walk you through using observability to diagnose this specific outage. In 16 steps (~15 minutes) you’ll go from “being paged” to breaking down the issue by high-cardinality events as you debug the outage.
Other ways to play with Events:
Begin your own journey – Start your free trial of Honeycomb Learn what it took to capture these events in our Gatekeeper service: Gatekeeper Tour Guide