Honeycomb SLO Now Generally Available: Success, Defined.
Honeycomb now offers SLOs, aka Service Level Objectives. This is the second in a set of of essays on creating SLOs from first principles. Previously, in this series, we created a derived column to…

By: Danyel Fisher

Honeycomb now offers SLOs, aka Service Level Objectives. This is the second in a set of of essays on creating SLOs from first principles.
Previously, in this series, we created a derived column to show how a back-end service was doing. That column categorized every incoming event as passing, failing, or irrelevant. We then counted up the column over time to see how many events passed and failed. But we had a problem: we were doing far too much math ourselves.
To address that problem, Honeycomb has now released SLO Support!Unsurprisingly, it is based on precisely the principles we discussed above.
To recall, the derived column looked something like this:
IF(
AND(
EQUALS($request.endpoint, "batch"),
EQUALS($request.method, "POST")
),
AND(
EQUALS($response.status_code, 200),
LT($duration_ms, 100)
)
)
which meant, “we only count requests that hit the batch endpoint, and use the POST method. If they do, then we will say the SLI has succeeded if we processed it in under 100 ms, and returned a 200; otherwise, we’ll call it a failure.” We counted the percentage of total requests as our SLI success rate. For example, we might say that over the last thirty days, we managed a 99.4% SLI success rate.
Formalizing this structure
- We’ll pick an SLI. An SLI (Service Level Indicator) consists of the ability to sort all the events in my dataset into three groups: those that are irrelevant, those that pass, and those that fail.
- Now, we’ll pick a target level for this SLI. “Of the relevant events, we want 99.95% of them to pass.”
- Last, we’ll pick a duration for them: “Over each 30 days, we expect our SLI to be at 99.95% passing.”
The nice thing about this is that we can quantify how our SLI is doing. We can look at a dataset, and see what percentage of events have succeeded.
This is a really useful way to think about systems that are constantly in minor states of error. Ordinary noise happens; this can lead to transient failures or occasional alerts. We can use this structure to ask how much these minor running errors are costing us.
(When there’s a catastrophic failure, frankly, SLOs are less surprising: every light on every console is blinking red and the phone is buzzing. We’ll use SLOs in those cases to estimate “how bad was this incident.”)
Understanding your Error Budget
Let’s make the assumption that we expect to see 100,000 relevant events in a given thirty day period. Let’s further say that, say, 700 of them have failed over the last 27 days. Over the next three days, we can afford for another 300 events to fail and still maintain a 99.9% SLO.
This gets to the concept of an error budget. In Honeycomb’s implementation, error budgets are continuously rolling: at any moment, old errors are slowly scrolling away into the past, no longer counting against your budget.
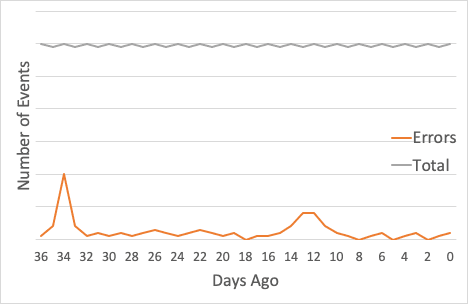
In our example, we’ll assume that the world looks something like this: The greyline at the top is the total number of events a system has sent. It’s staying pretty constant. The orange line shows errors.
For this chart, the Y scale on the errors is exaggerated: after all, if you’re running at 99.9%, that means that there’s 1/1000 the number of errors as successes. (The orange line would be very small!)
33 days ago, there was an incident which caused the number of errors to spike. Fortunately, we got that under control pretty quickly. Two weeks ago, there was a slower-burning incident, which took a little longer to straighten out.
Checking the Burn Down graph
It would be great to track when we spent our error budget. Was the painful part of our last month those big spikes? Or was it the fact that we’ve had a small, continuous background burn the other time? How much were those background events costing us?
The burn down graph shows the last month, and how much budget was burned every day. If we had looked at the graph last week, we’d have seen that your last 30 days had been burnt, pretty hard, by that first incident, and then again by the second. The rest of the time has been a slow, continuous burn: nothing too bad. That helps us make decisions: are we just barely making budget every month? Is the loss due to incidents, or is it because we are slowly burning away over time?
Both of those can be totally fine! For some systems, it’s perfectly reasonable to have a slow, gentle burn of occasional errors. For others, we want to keep our powder dry to compensate for more-severe outages!
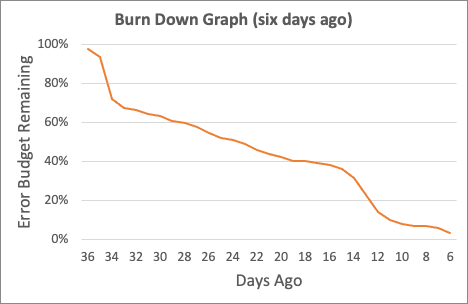
The graph from six days ago was looking dismal. That first incident had burned 40% of budget in a single incident; the usual pace of “a few percent a day” meant that the budget was nearly exhausted.
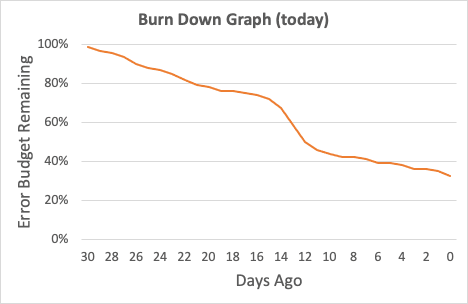
But if we look at the burn down graph today, things are looking better! The first incident is off the books, and now we’re only making up for the errors of D2. Someday, that too will be forgotten.
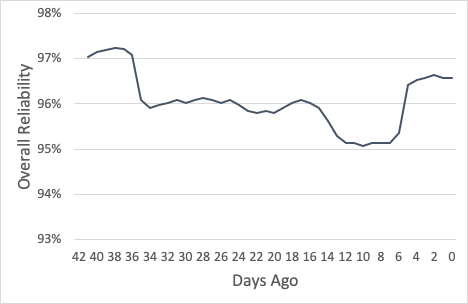
We should also take a look at how we compare to the goal. For every day, we can compute the percentage of events that has passed the SLI. As you can see, we’re usually above 95% for most 30 day periods. At the trough of the first incident, things were pretty bad — and we lost ground, again, with the second one — but now we’re maintaining a comfortably higher level.
Now, all these illustrations have shown moments when our problems were comfortably in the past. While that’s a great place to have our problems, we wouldn’t be using Honeycomb if all our problems were solved. That’s why there are two other important SLO aspects to think about:
SLO Burn Alerts
When the error rate is gradually increasing, it would be great to know when we’ll run out of budget. Honeycomb creates Burn Alerts to show when our SLO will run out of budget. The green line shows the gradually shrinking budget, but on a slightly adjusted window.
Then, Honeycomb predicts forward. The orange line looks at how our last hour has been, and then interpolates forward to the next four hours. In this image, the four hour estimate is going to dip below zero — and so the system warns the user.

This can let us know how long until we use up our error budget. It acts as a forewarning against slow failures.
It’s really useful to have a couple of different time ranges. A 24 hour alert can mean “you’ve got a slow degradation in your service; you might want to fix it. — but worry about it in the morning.” A four hour alert means “it’s time to get cracking” (at Honeycomb, we tend to send 24 hour alerts to Slack channels, but 4 hour alerts to PagerDuty).
Find out why it’s going wrong
This wouldn’t be Honeycomb if we didn’t provide you tools to dive into an issue. The SLO Page shows a Heatmap and a BubbleUp of the last 24 hours, so you can figure out what’s changed and how you want to take it on.
Here’s a great example: the SLO page for a Honeycomb tool that’s looking at rendering speed. (Yep, we’ve even set an SLO on end user experience!) This is a pretty loose SLO — really, we’re keeping it around to alarm us if our pages suddenly get really bad — but we can see that we’re doing OK against our goals.

The bottom half of the page shows where the problems are coming from. The BubbleUp heatmap shows the last day of events: higher up are yellow, meaning these events fail the SLI; lower down are blue, meaning they are compliant with the SLI. We can see that mostly this is happening when events are particularly slow.
We can also look in there and see that it’s one particular page that seems to be having the worst experience, and one particular user email that’s running slow. That’s a pretty cool insight — it tells us where to look, and how we might want to handle it. It also gives us a sense for what repro cases to look for, and figure out what strange thing this user is doing.
Now, define your own SLOs
Honeycomb SLOs are now released and are available to Enterprise/yearly contract customers. We’d love to learn more about how you think about SLOs, and what you use them for. New to Honeycomb? Try them out in our Free Trial!
Want to know more?
Talk to our team to arrange a custom demo or for help finding the right plan.