Honeycomb + Tracetest: Observability-Driven Development
Our friends at Tracetest recently released an integration with Honeycomb that allows you to build end-to-end and integration tests, powered by your existing distributed traces. You only need to point Tracetest to your existing trace data source—in this case, Honeycomb. This guest blog post from Adnan Rahić walks you through how the integration works.

By: Adnan Rahić

Our friends at Tracetest recently released an integration with Honeycomb that allows you to build end-to-end and integration tests, powered by your existing distributed traces. You only need to point Tracetest to your existing trace data source—in this case, Honeycomb.
This guest post from Adnan Rahić walks you through how the integration works.
What is Tracetest?
Tracetest is a tool for trace-based testing. It makes it possible to:
- Define tests and assertions against every single microservice that a trace goes through.
- Build tests based on your already instrumented system.
- Define multiple transaction triggers, such as a GET against an API endpoint, a GRPC request, a Kafka message queue, etc.
- Define assertions against both the response and trace data, ensuring both your response and the underlying processes worked as intended.
- Save and run the tests manually or via CI build jobs with the Tracetest CLI.
Tracetest + Honeycomb integration
Tracetest now integrates with Honeycomb, providing powerful observability capabilities. You can leverage your Honeycomb distributed traces to run trace-based tests with Tracetest.
If you already have OpenTelemetry instrumentation configured in your code and are using an OpenTelemetry Collector with Honeycomb, adding Tracetest to your infrastructure can enable you to write detailed trace-based tests.
When running integration tests, you have no way of knowing precisely at which point an HTTP transaction goes wrong in a network of microservices. With tracing enabled, Tracetest can run tests with assertions against existing trace data throughout every service in the entire transaction. You can utilize these tests as part of your CI/CD process to ensure system functionality and to catch regressions.
You can enhance your testing process by using Tracetest to create tests and Honeycomb to analyze those test results over time. With Honeycomb, you can track test runs and correlate corresponding services over time, giving you insights into system performance and highlighting the impact of changes on performance.
The recommended approach with Tracetest is to identify issues by exploring trace data within Honeycomb. The issues identified can be good candidates for new tests or assertions within Tracetest. This type of feedback loop can create a cycle of continuous improvement.
Try Tracetest with Honeycomb
First, you need to have a Honeycomb account. Create your free account. Next, you need to have your distributed application instrumented with OpenTelemetry and configured to send trace data to Honeycomb. Check out the official docs for more on getting started with Honeycomb and OpenTelemetry. Once you have your system sending trace data to Honeycomb, you are ready to set up Tracetest.
Install Tracetest
Tracetest is open source and easy to install. Start by installing the Tracetest CLI:
brew install kubeshop/tracetest/tracetest
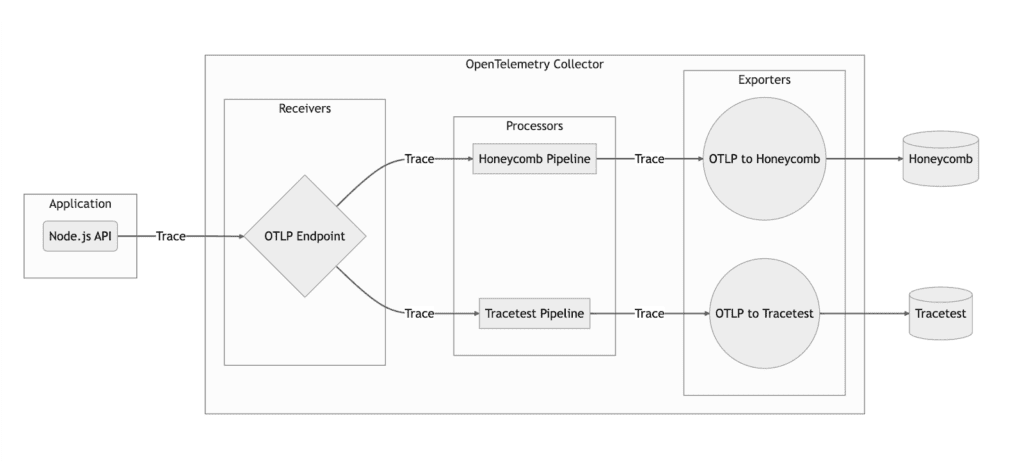
From here, follow the official documentation to install the Tracetest server. Once the server is installed, open Tracetest Web UI in the browser and follow the instructions for connecting the OpenTelemetry Collector for Tracetest and Honeycomb.
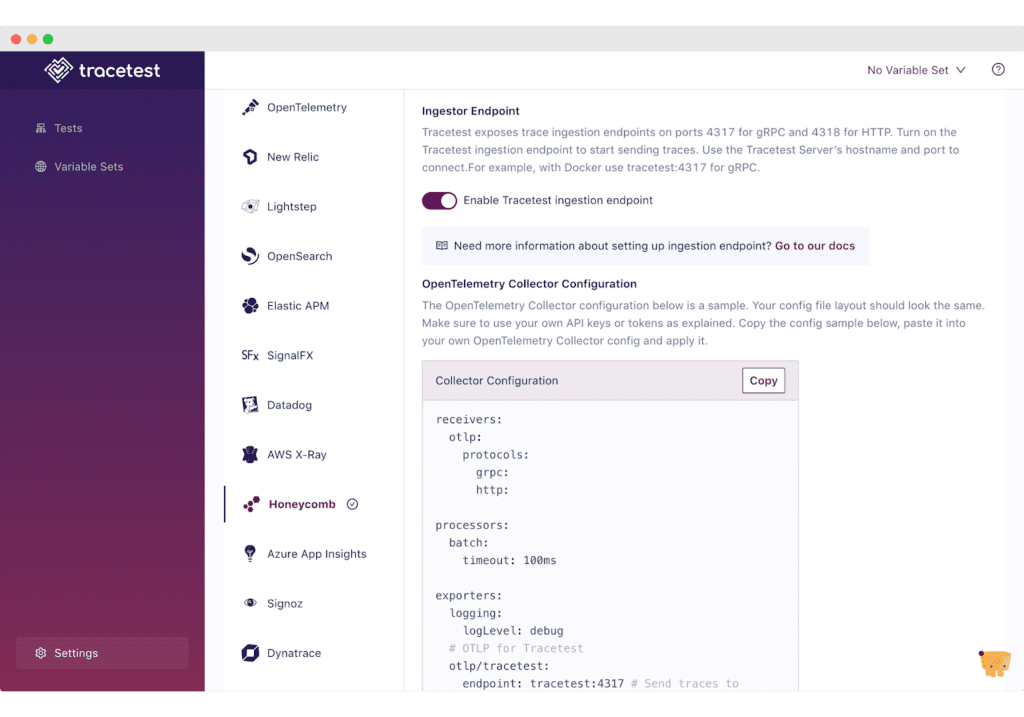
The Collector is the recommended way to send OpenTelemetry data to multiple observability backends. It is a highly configurable binary that allows you to ingest, process, and export OpenTelemetry data.
Enabling the Tracetest/Honeycomb integration is as simple as selecting Honeycomb as your trace data store and adding dedicated pipelines that send traces to both Tracetest and Honeycomb in your OpenTelemetry Collector configuration.
Copy this OpenTelemetry Collector configuration and paste it into your configuration file.
receivers:
  otlp:
    protocols:
      grpc:
      http:

processors:
  batch:
    timeout: 100ms

exporters:
  logging:
    loglevel: debug
  # OTLP for Tracetest
  otlp/tracetest:
    endpoint: tracetest:4317 # Send traces to Tracetest.
    tls:
      insecure: true
  # OTLP for Honeycomb
  otlp/honeycomb:
    endpoint: "api.honeycomb.io:443" # Send traces to Honeycomb.
    headers:
      "x-honeycomb-team": "YOUR_API_KEY"

service:
  pipelines:
    traces/tracetest:
      receivers: [otlp]
      processors: [batch]
      exporters: [otlp/tracetest]
    traces/honeycomb:
      receivers: [otlp]
      processors: [batch]
exporters: [logging, otlp/honeycomb]Next, edit the config to include your Honeycomb API key.
If you weren’t already using an OpenTelemetry Collector to send data to Honeycomb, please see the official docs for more info.
Create a trace-based test in Tracetest
For this example, we’ll use the official example app for Tracetest and Honeycomb. To quickly access the example, you can run the following:
git clone https://github.com/kubeshop/tracetest.git
cd tracetest/examples/tracetest-honeycomb/
docker compose up --buildMake sure to add your API key as shown in the section above.
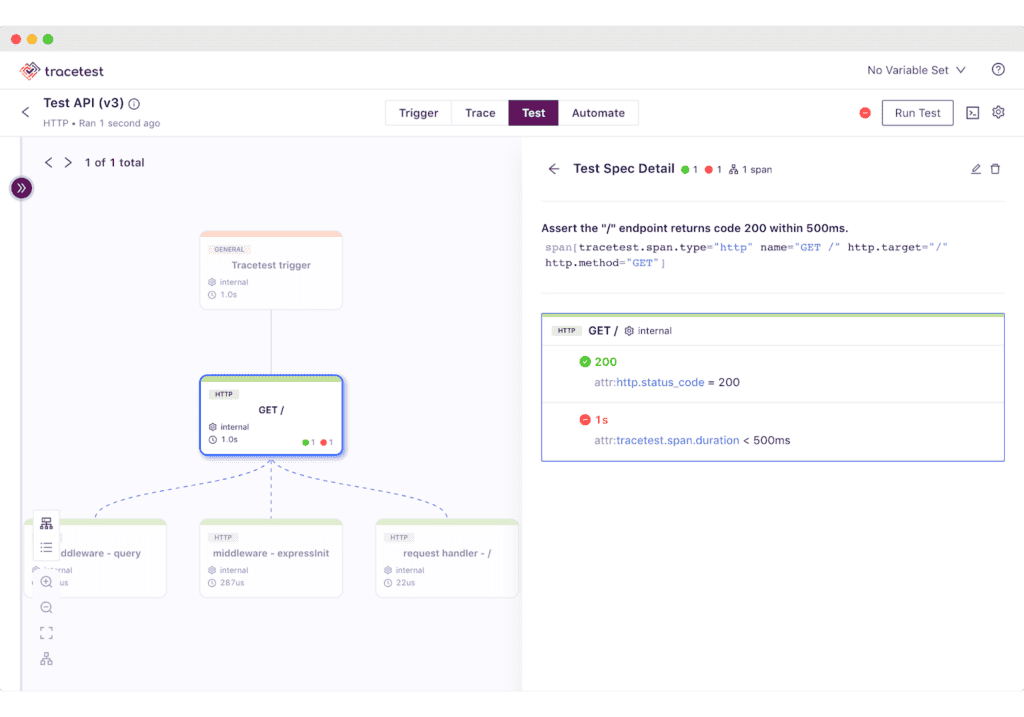
To create a test in Tracetest, start by clicking Create > Create New Test > HTTP Request > Next >Add a name for your test > Next > The URL field should be http://app:8080 > Create and Run.
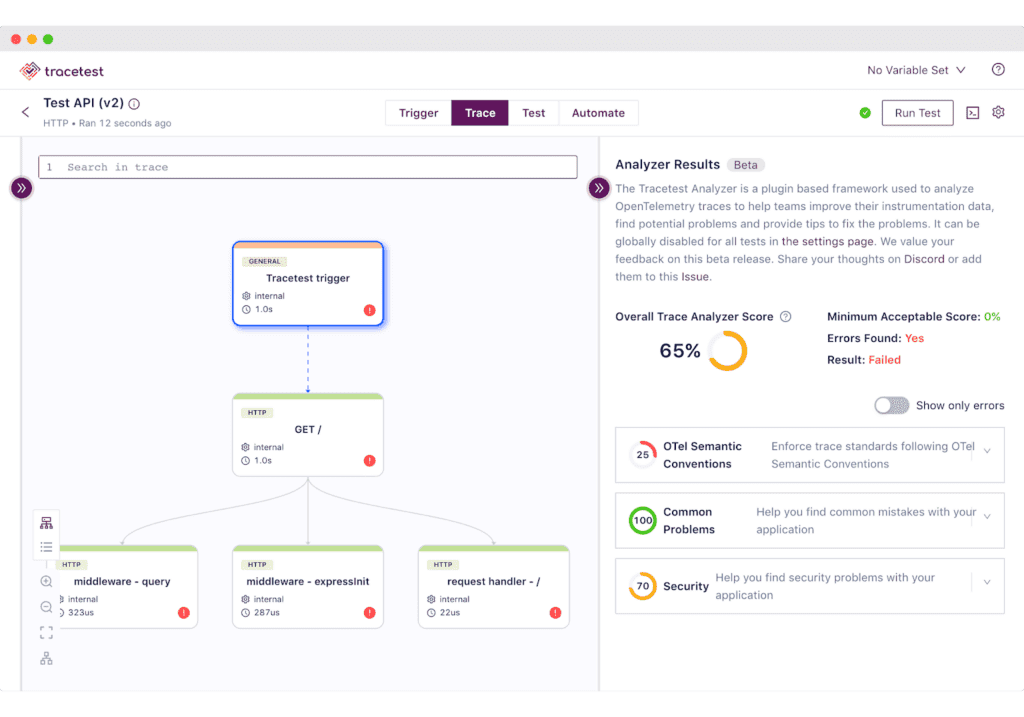
This will trigger the test and display a distributed trace in the Trace tab. You’ll also see the results of the Trace Analyzer. They show rules and conventions to adhere to while writing code instrumentation.
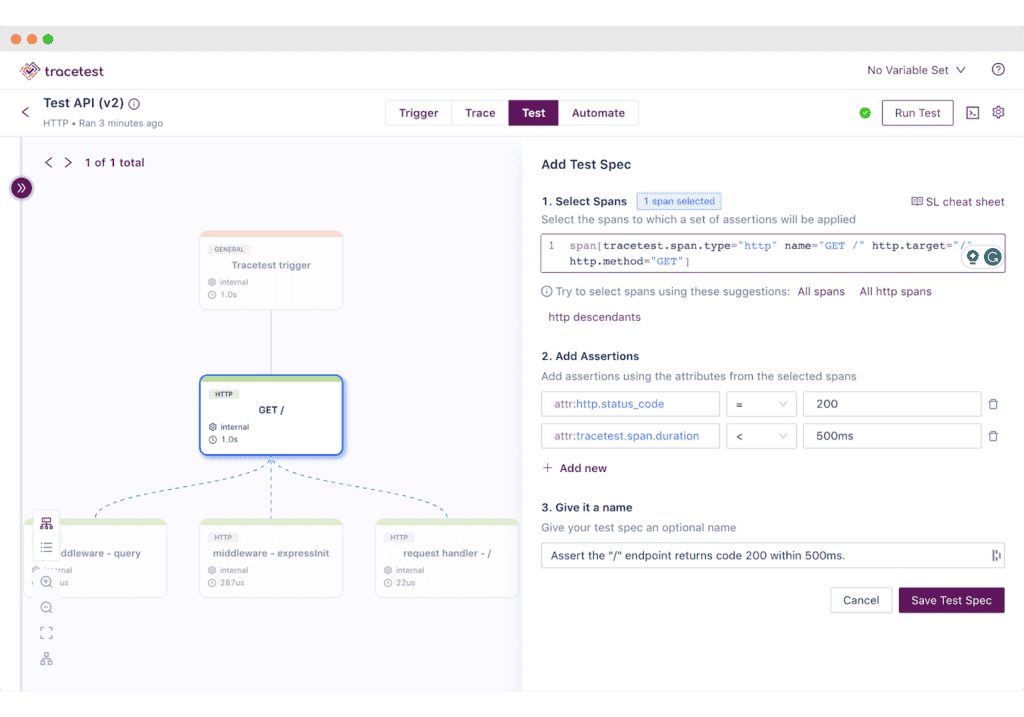
Proceed to add a test spec to assert all database queries return within 500 ms. Click the Test tab and proceed to click the Add Test Spec button.
In the span selector, make sure to add this selector:
span[tracetest.span.type="http" name="GET /" http.target="/" http.method="GET"]It will select the span for the root endpoint of the API.
In the assertion field, add:
attr:http.status_code = 200
attr:tracetest.span.duration < 500msSave the test spec and publish the test.
The http span is returning in more than 500ms and will be labeled in red (as shown above in Figure 2). This is an example of a trace-based test that can assert against every single part of an HTTP transaction, including external API calls.
However, Tracetest cannot give you a historical overview of all test runs. Let’s show how Honeycomb makes it possible.
Monitor trace-based tests over time with Honeycomb
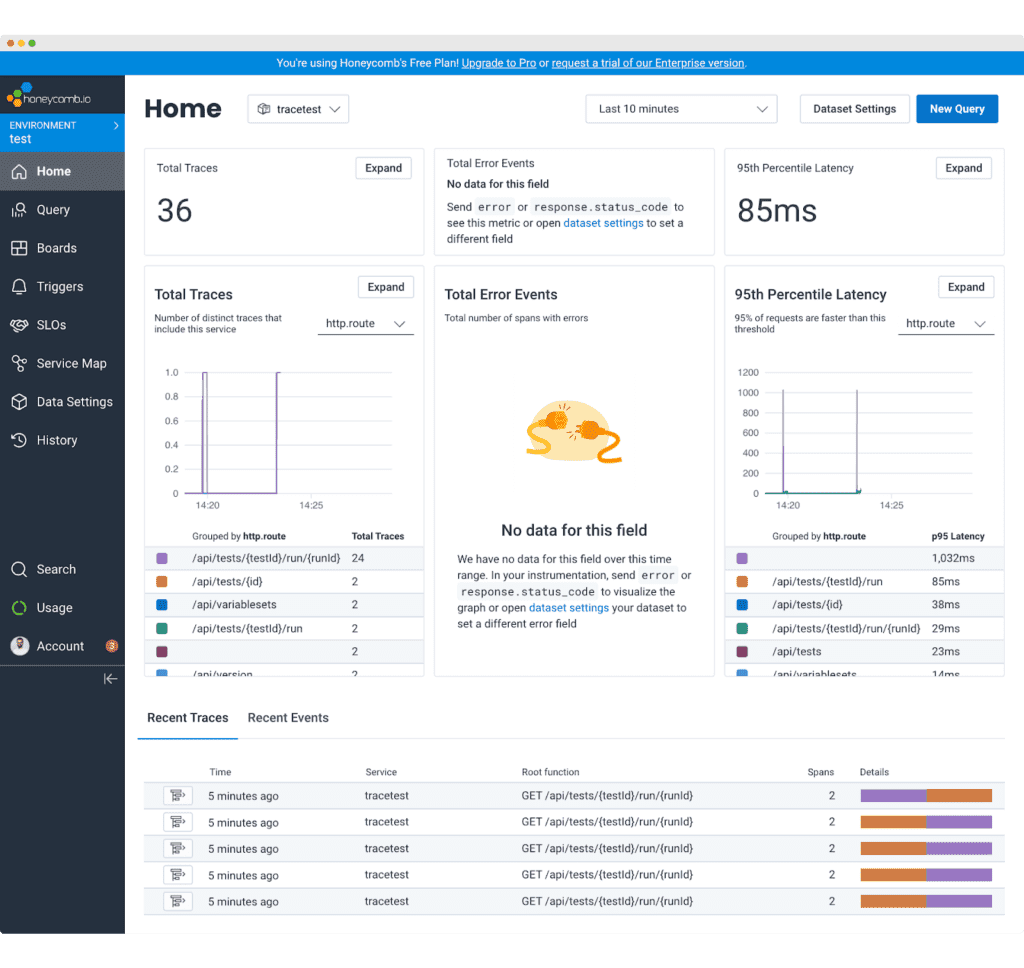
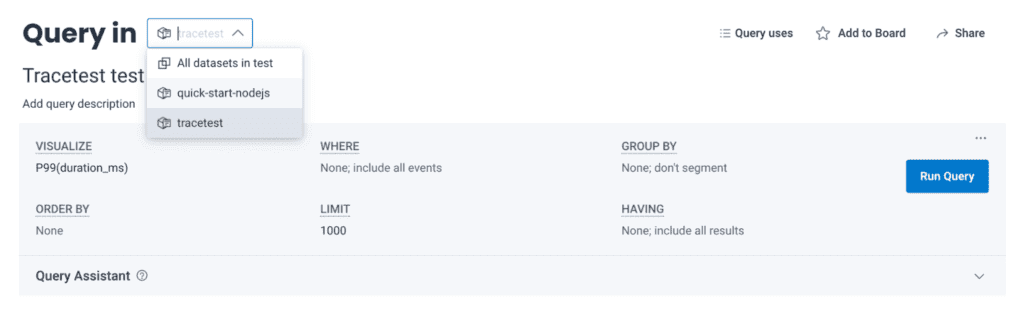
Because you are using two pipelines in the OpenTelemetry Collector, all distributed traces generated will be stored in Honeycomb. Additionally, if you configure the Tracetest server with Internal Telemetry, you will see the traces the Tracetest server generates in Honeycomb as well. Using the above example, traces from the sample Node.js API will be stored in the quick-start-nodejs dataset, while the traces from Tracetest will be stored in the tracetest dataset.
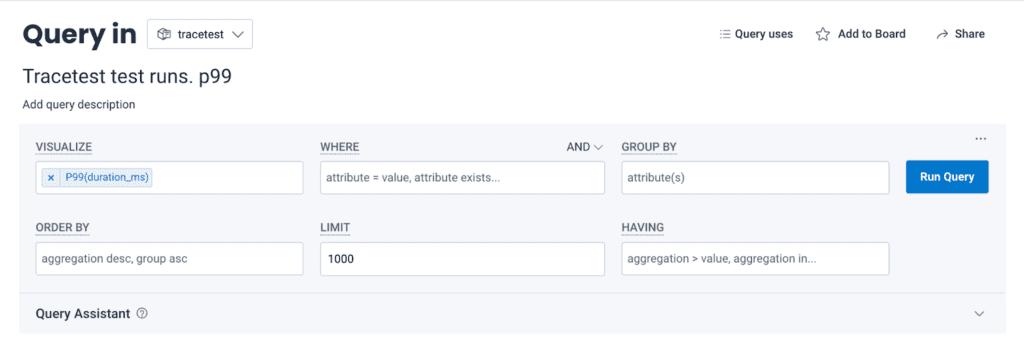
Data in the tracetest dataset will give you insight into every test run. Start by running this query in the tracetest dataset to track P99 for the response time of a Tracetest test run.
Then, you can create a board to show performance over time, like comparing in 30-minute or 2-hour intervals side by side.
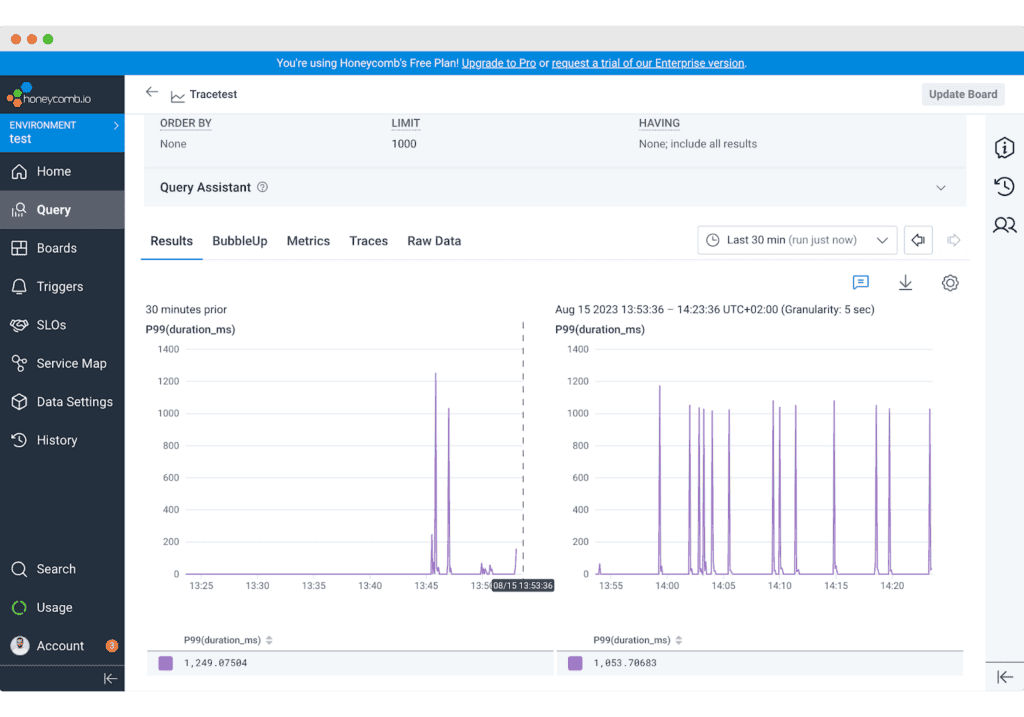
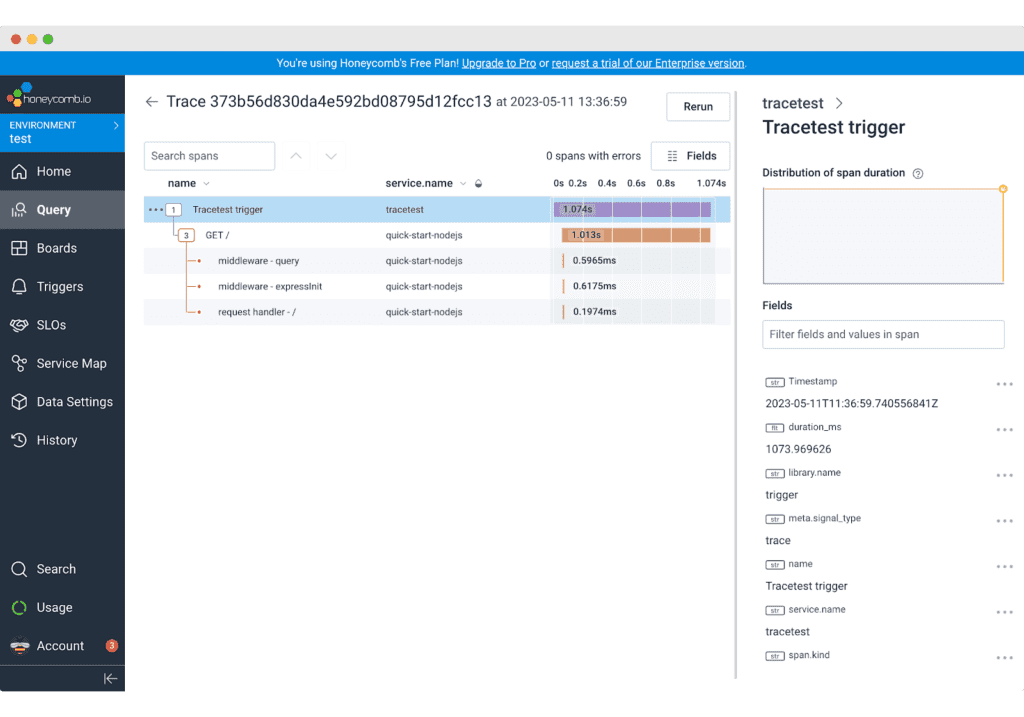
From here, you can drill down into the specific trace to troubleshoot. Open the Traces tab and select a slow trace. For example, choose a trace that exceeds your p99. Once open, the trace waterfall within Honeycomb can help you pinpoint exactly which span is causing an issue (as shown in Figure 4, above).
By changing the dataset to quick-start-nodejs, you can get the same insight into all requests hitting the sample app, not just the tests triggered by Tracetest.
What’s next?
Tracetest and Honeycomb both provide detailed distributed trace data, allowing you to gain insight into the behavior of your application at a granular level. Tracetest allows you to create assertions against this data to write bulletproof tests. Honeycomb provides observability and granular insight over time, where you can monitor your distributed applications and track Tracetest test run behavior over time as well as live user behavior in production.
Would you like to learn more about Tracetest and what it brings to the table? Check the docs and try it out by downloading it today.
Want to know more?
Talk to our team to arrange a custom demo or for help finding the right plan.