Error Analysis in Honeycomb for Frontend Observability Now in Public Beta
Traditional error tracking surfaces what broke. Honeycomb shows you why, and how to fix it. With Error Analysis in Honeycomb for Frontend Observability, now in public beta, teams get a streamlined way to investigate and prioritize client-side errors without writing a single query.

By: Elsie Phillips

It’s 2025, The Frontend Deserves Observability Too
Watch now
You just shipped your latest frontend release. It passed QA, CI ran, and it looked great in pre-production. But now it’s live and users are hitting an unexpected error: TypeError: undefined is not a function in Chrome.
Your error tracking tool flags the exception. You get a stack trace, some breadcrumbs, maybe a session replay. But when you need to understand why it happened, how it relates to performance, what triggered it upstream, or which users it’s impacting in production, it’s back to jumping between tools and stitching together context.
Traditional error tracking surfaces what broke. Honeycomb shows you why, and how to fix it.
With Error Analysis in Honeycomb for Frontend Observability, now in public beta, teams get a streamlined way to investigate and prioritize client-side errors without writing a single query.
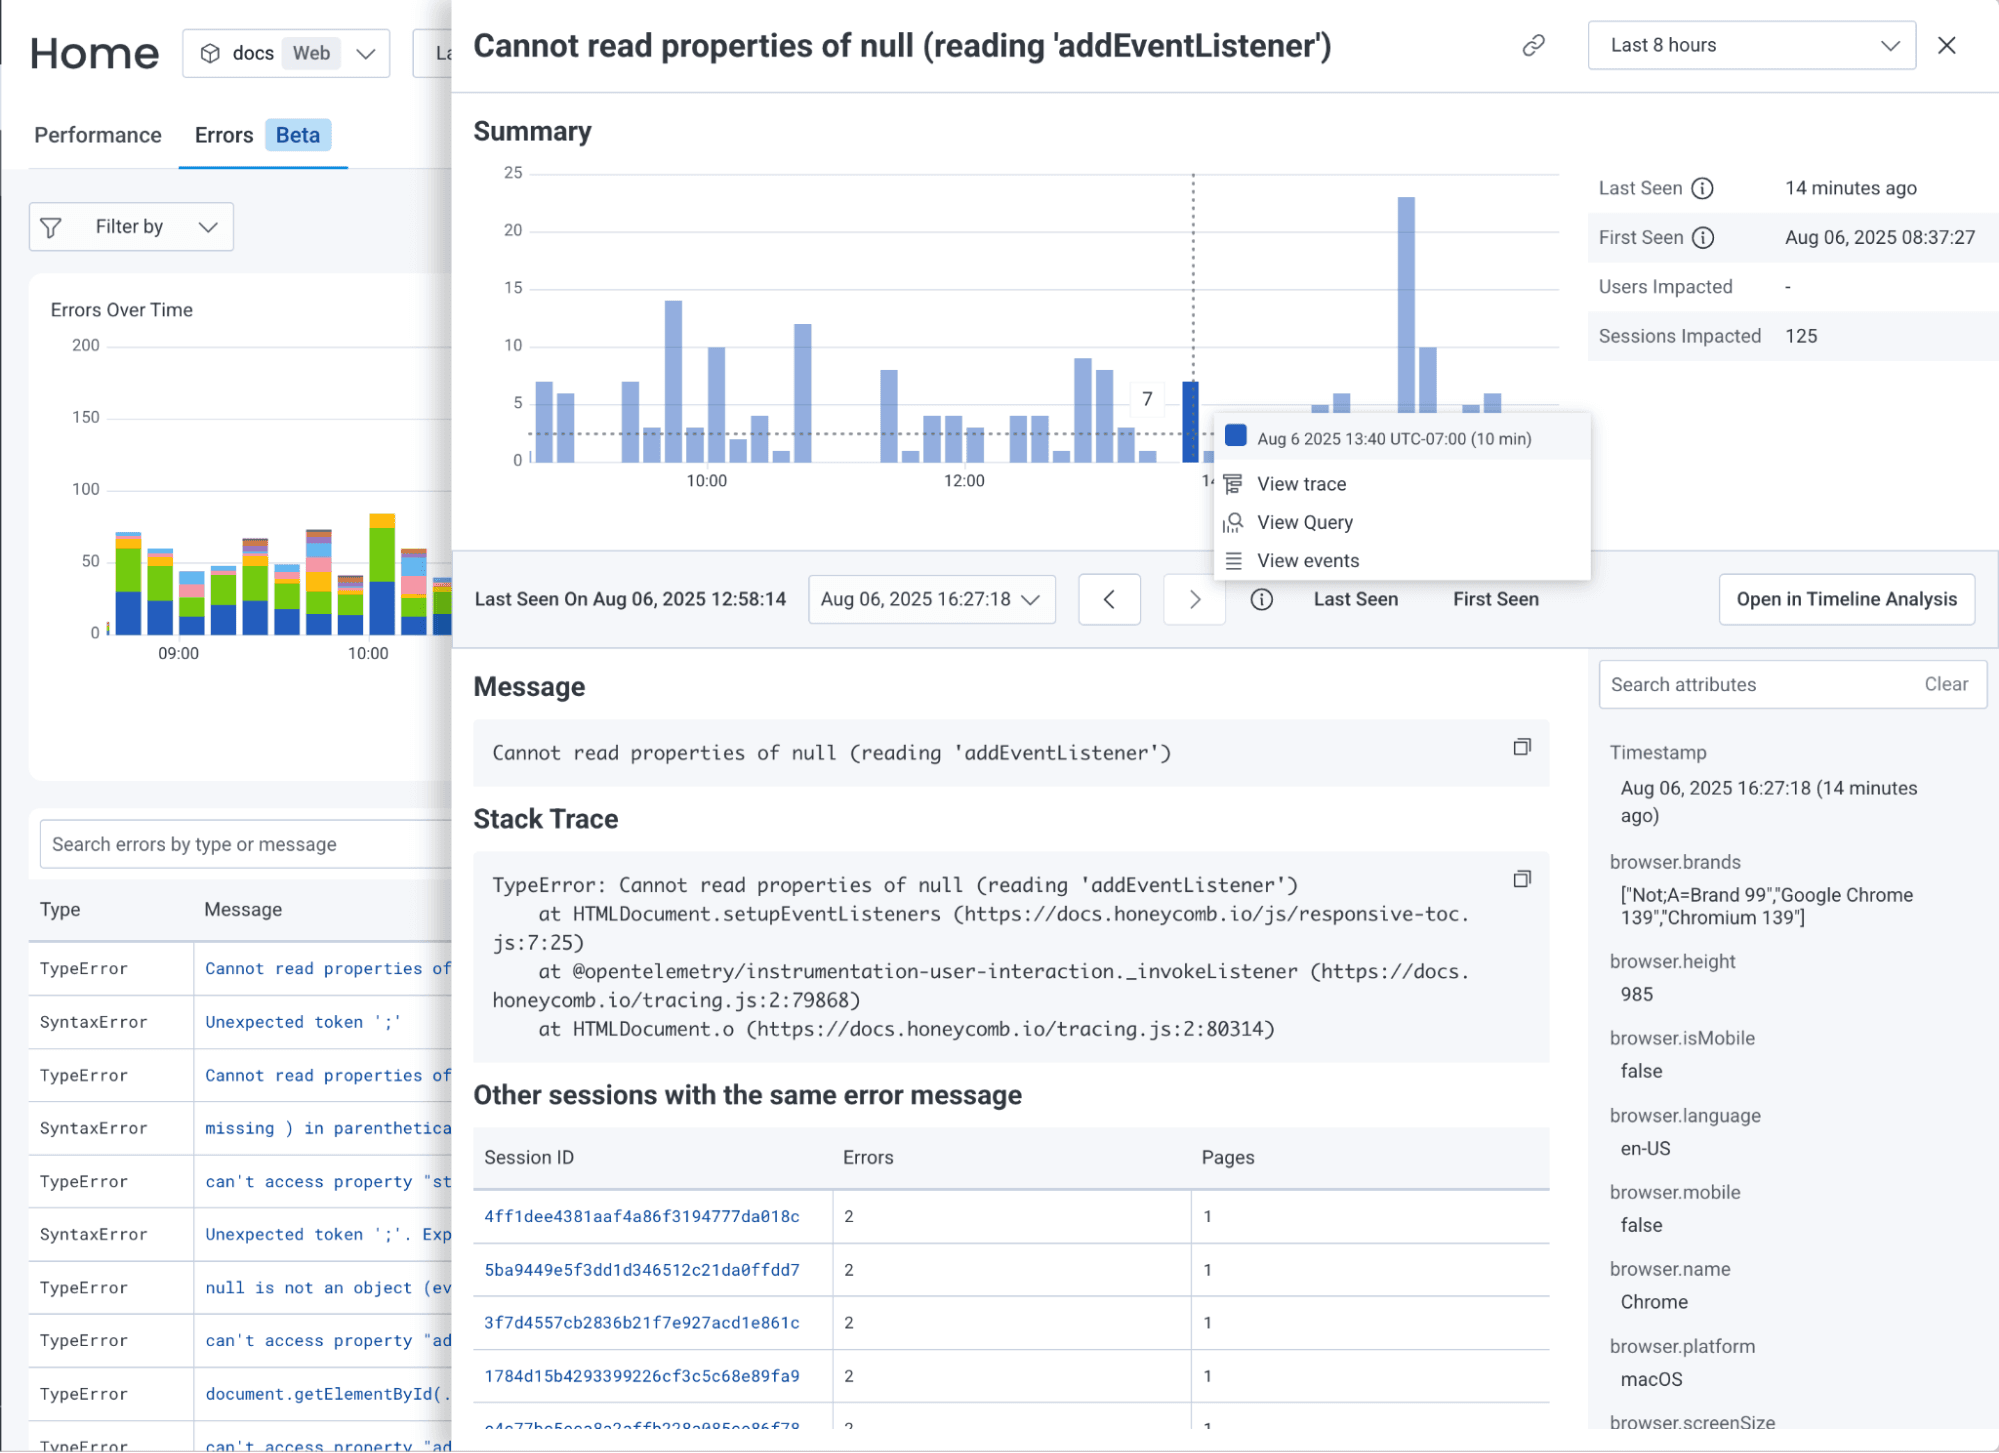
Trace-first workflow
Instead of one view for errors, another for traces, and another for sessions, Honeycomb ties everything together in a trace-first workflow:
- Instantly explore errors across your web and mobile apps
- Click into an error group to view stack traces and session-level impact
- Pivot directly into related traces to uncover deeper performance or dependency issues
- Filter by release, platform, or environment
Honeycomb helps teams go from symptom to root cause faster, without gaps in visibility, for one shared view across frontend and backend teams.
What’s in the beta
Here’s what you can expect in the public beta of Error Analysis.
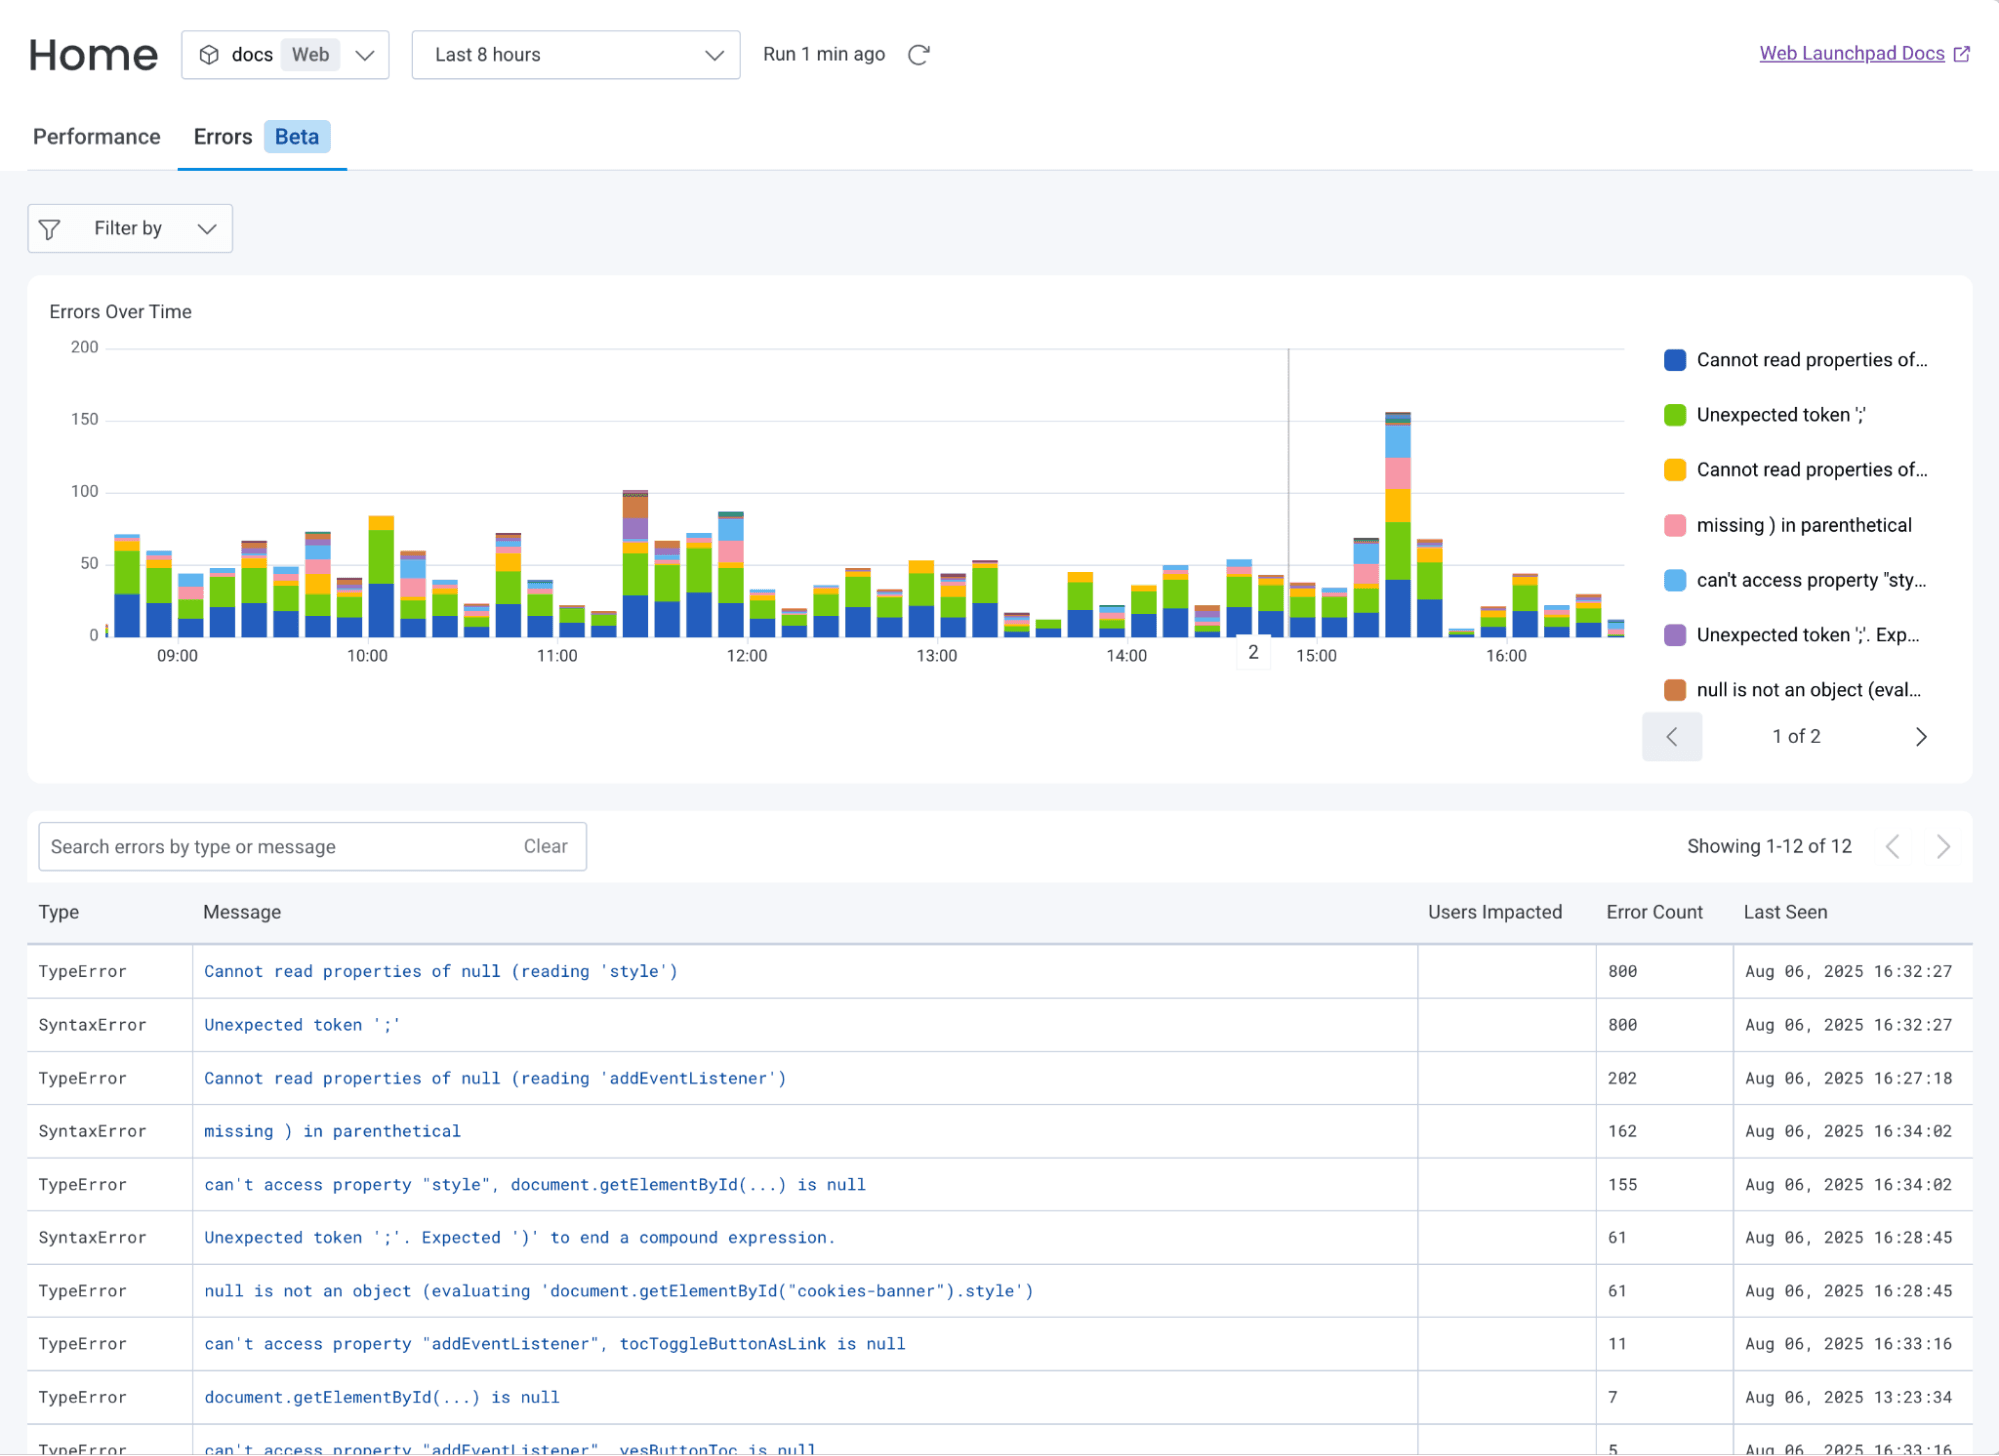
Error discovery
View all your application errors in a no-query interface, designed for speed and clarity:
- Quickly filter and search to find the errors that matter by message, type, count, and last-seen timestamp
- Customize filters to suit your team’s workflows or environments
- Aggregate visualizations that summarize error patterns and trends across the application, giving teams a high-level view of system health
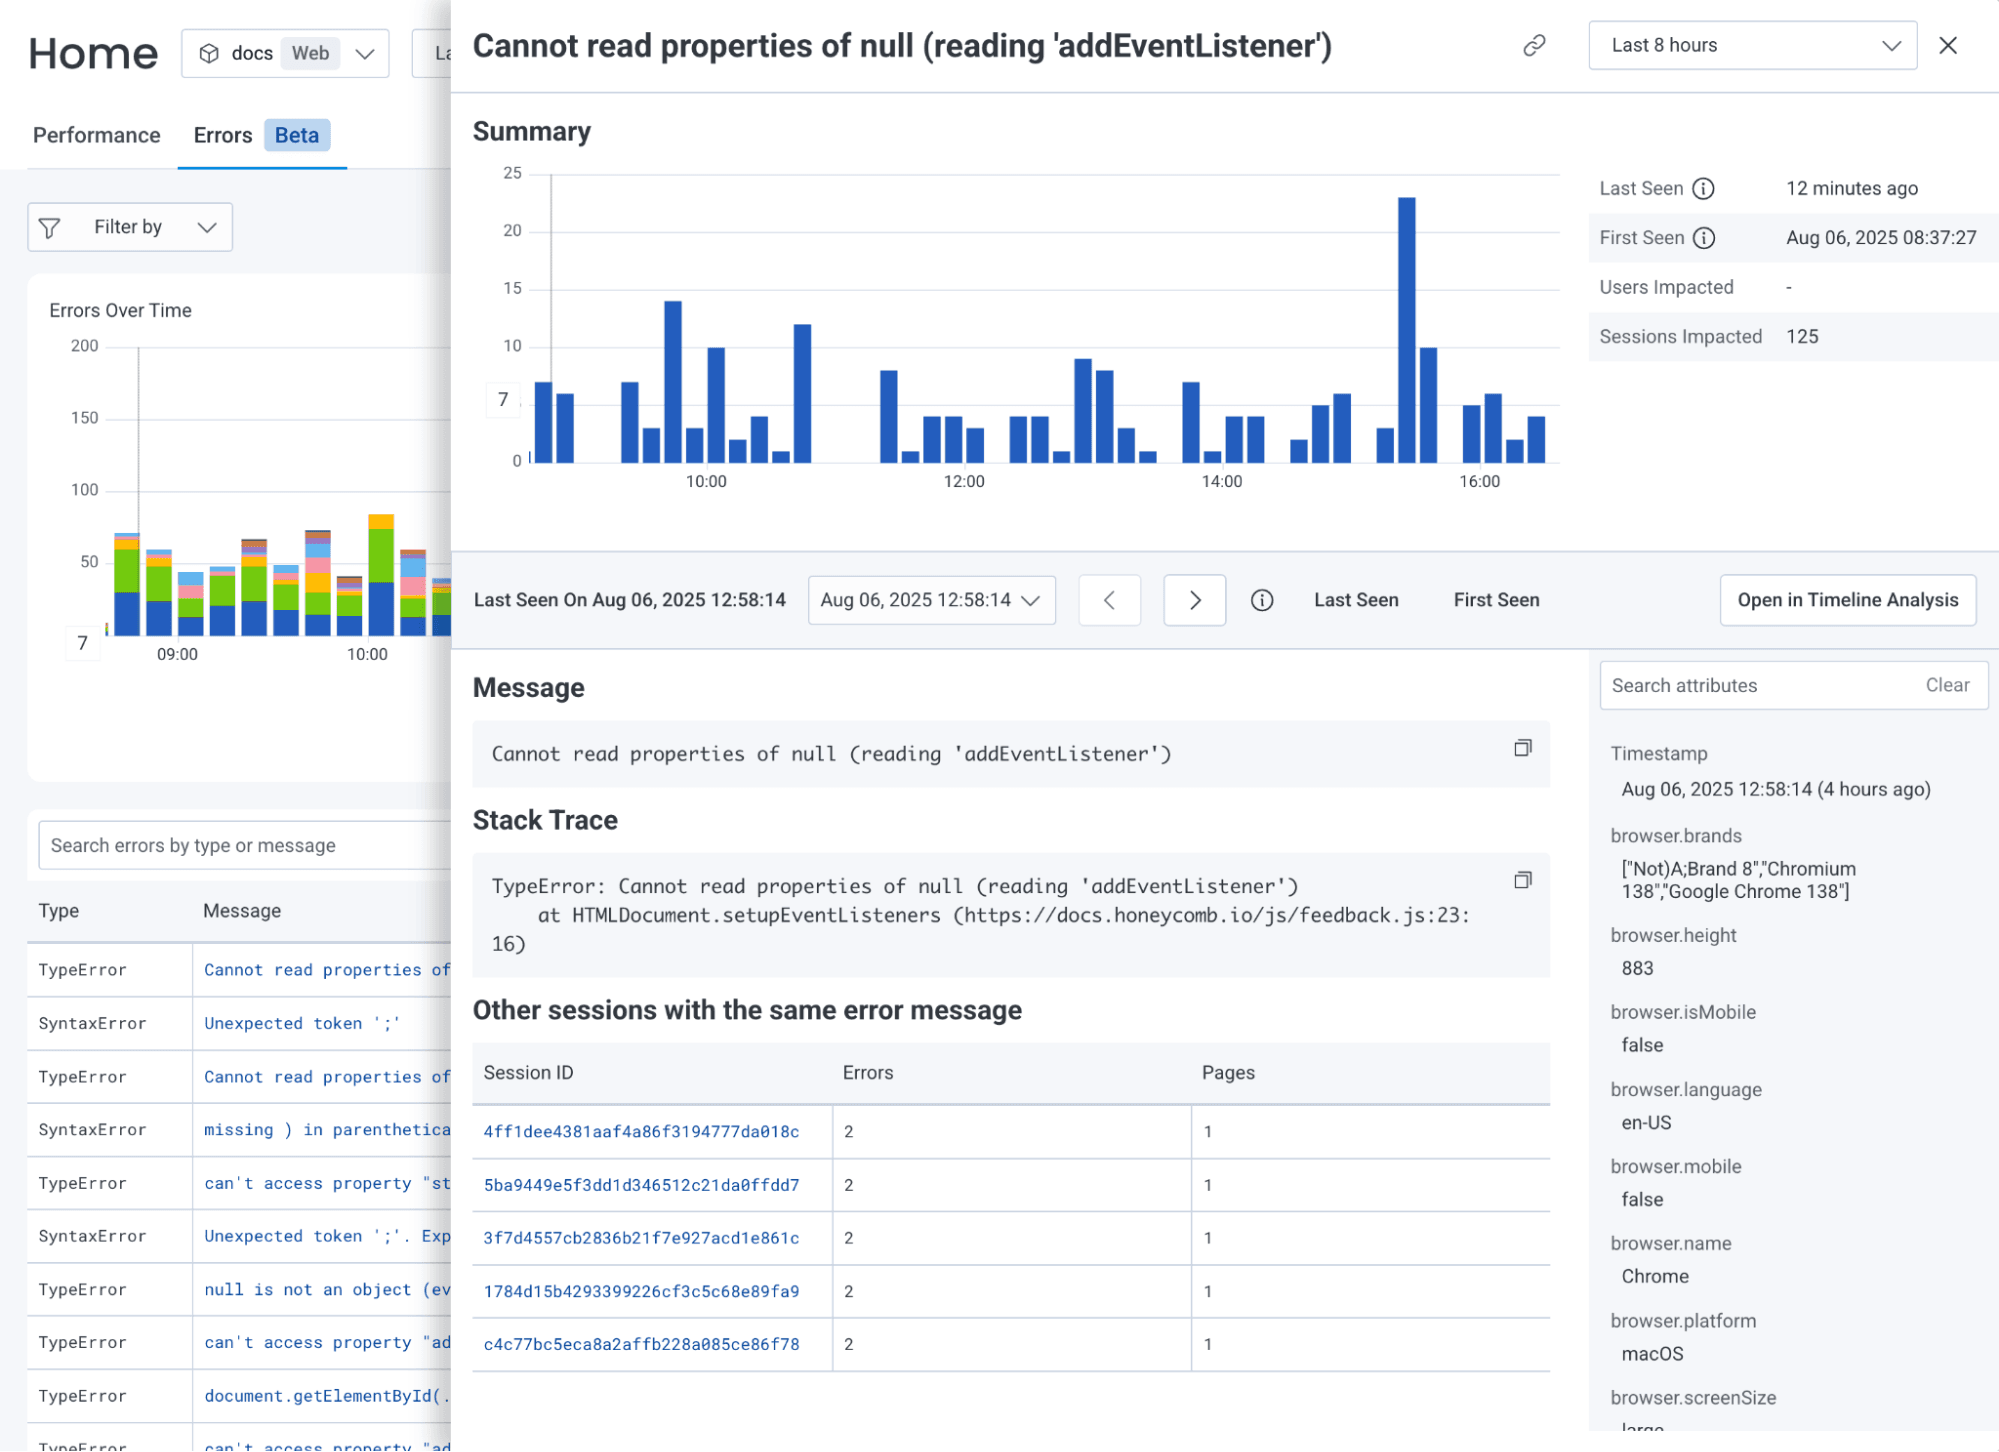
Deep dive without the digging
Click into any error group to:
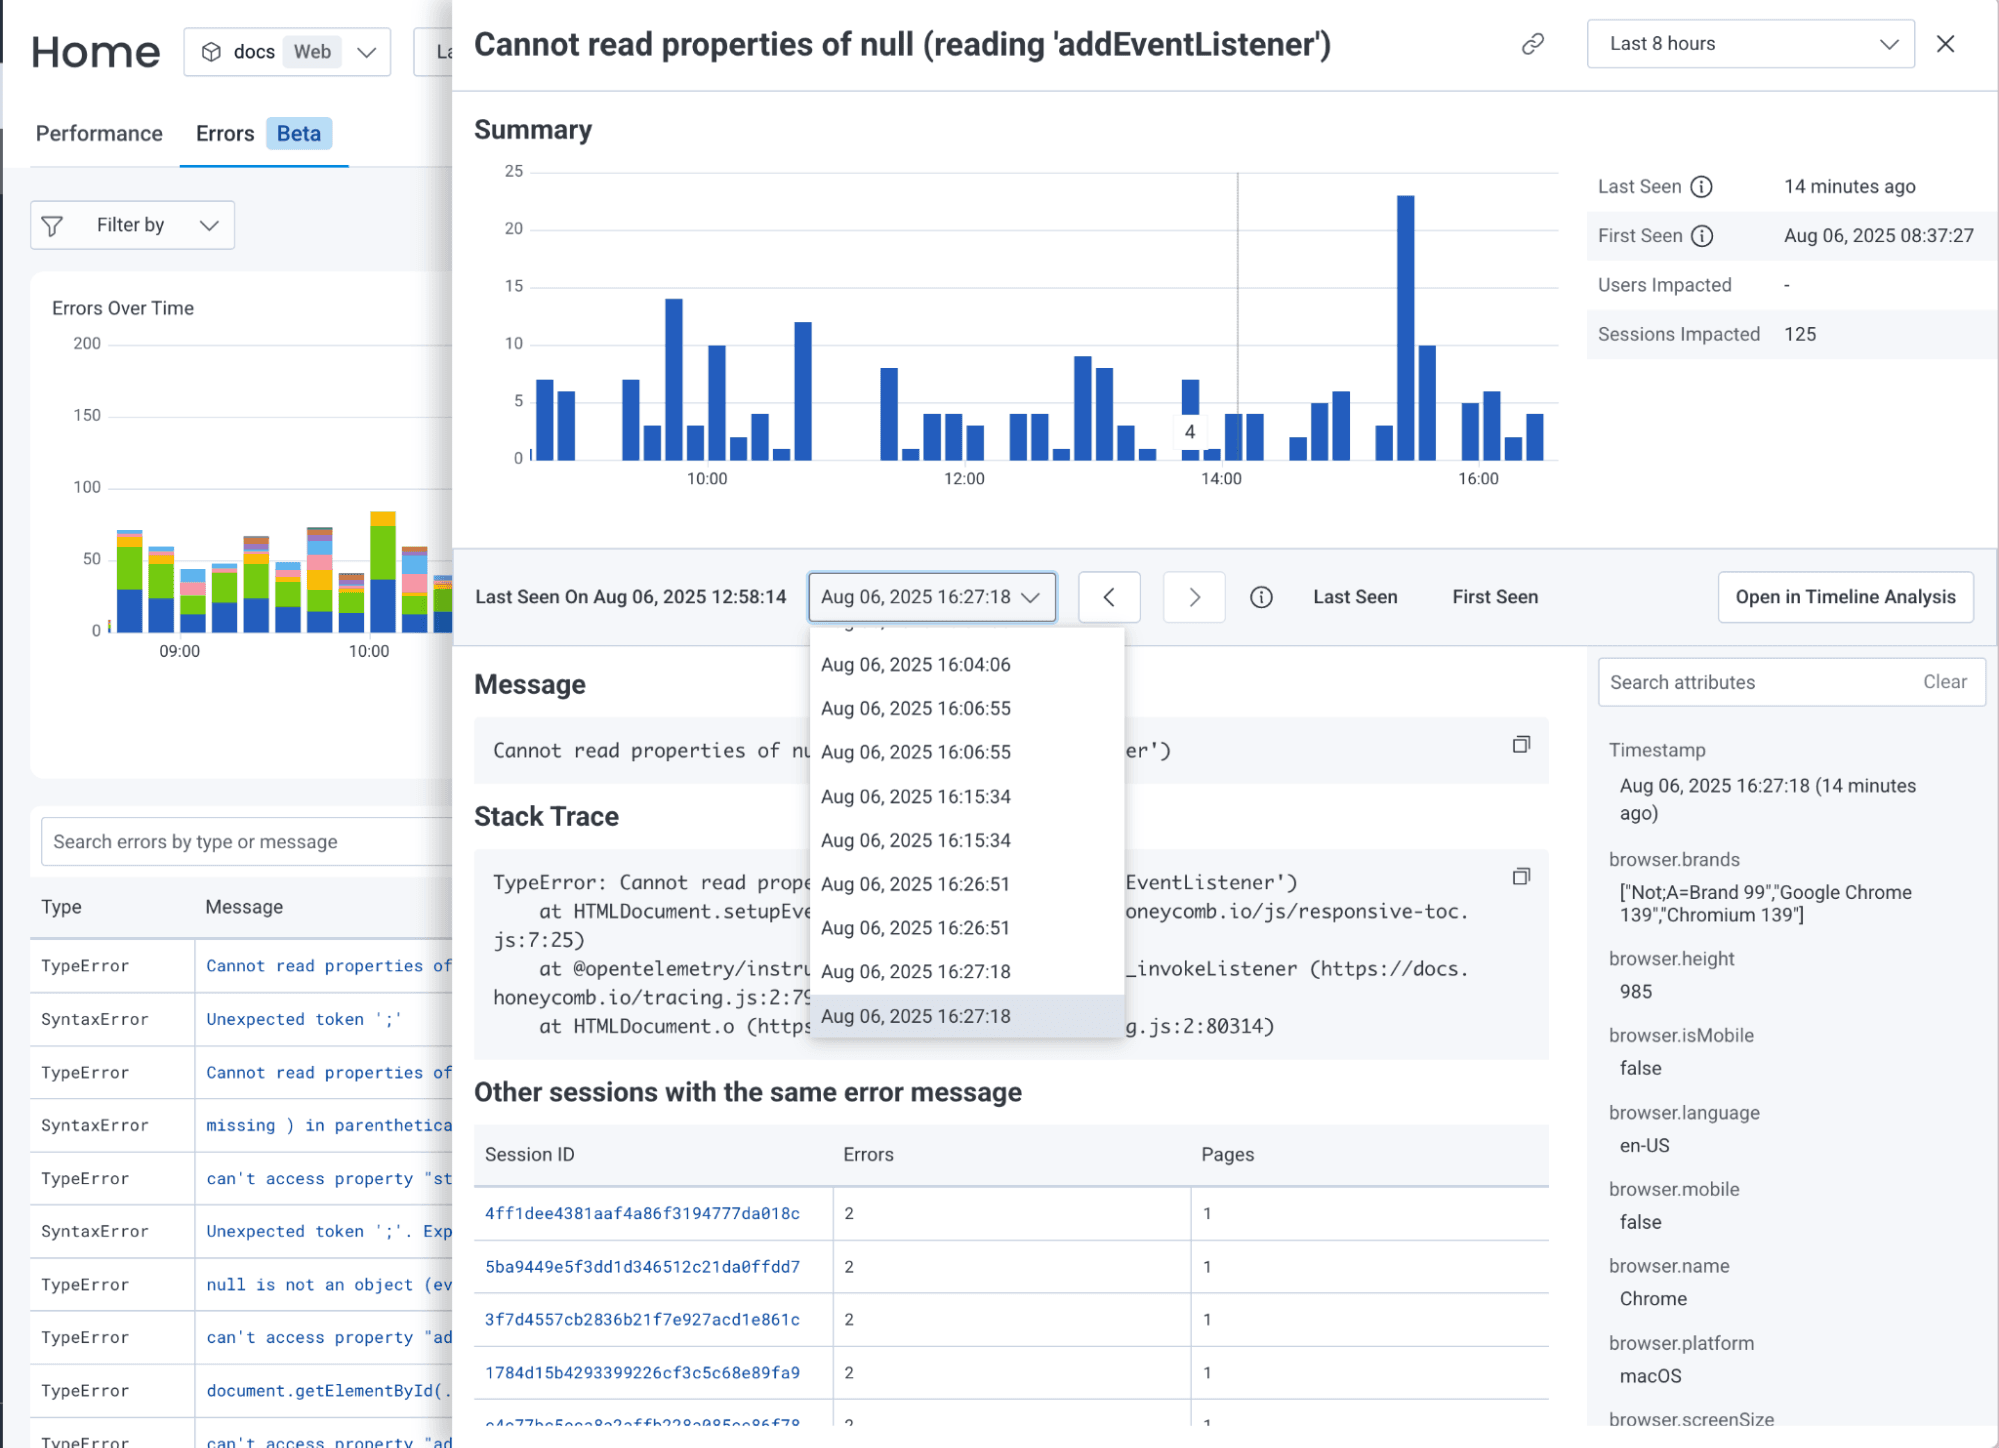
- Examine detailed stack traces and uncover root causes
- View related traces to uncover performance or contextual insights
- Understand user-level impact with full session context and comparisons
Going beyond HTTP status codes
With OpenTelemetry, developers can customize errors reported to Honeycomb by:
- Capturing unique business-level conditions that send meaningful errors to Honeycomb with more details and useful attributes
- Using an OpenTelemetry Collector, or a sampling tool such as Refinery, to filter or sample error conditions where needed
Fixing what matters: a quick example
Let’s take the example from the intro paragraph. You notice a sudden spike in a grouped error labeled TypeError: undefined is not a function.
With the new Error Analysis in Honeycomb for Frontend Observability, you can:
- Filter by the latest release and platform
- Spot that it’s only happening on iOS 17.3
- Drill into the stack trace and see it’s tied to a new animation utility
- Jump into the related trace to understand how the animation function is impacting frame rate and session flow
Within minutes, you’ve pinpointed the issue, filed a fix, and prevented a flood of user tickets.
Try it today
Error Analysis is available now in public beta for all Honeycomb for Frontend Observability customers. Just head to the Errors tab inside your Frontend Observability view and start exploring. Check the docs for configuration tips and best practices.
Not a Honeycomb for Frontend Observability customer, but want to try the new errors capabilities? Get in touch with our team.