How Honeycomb Monitors Kubernetes
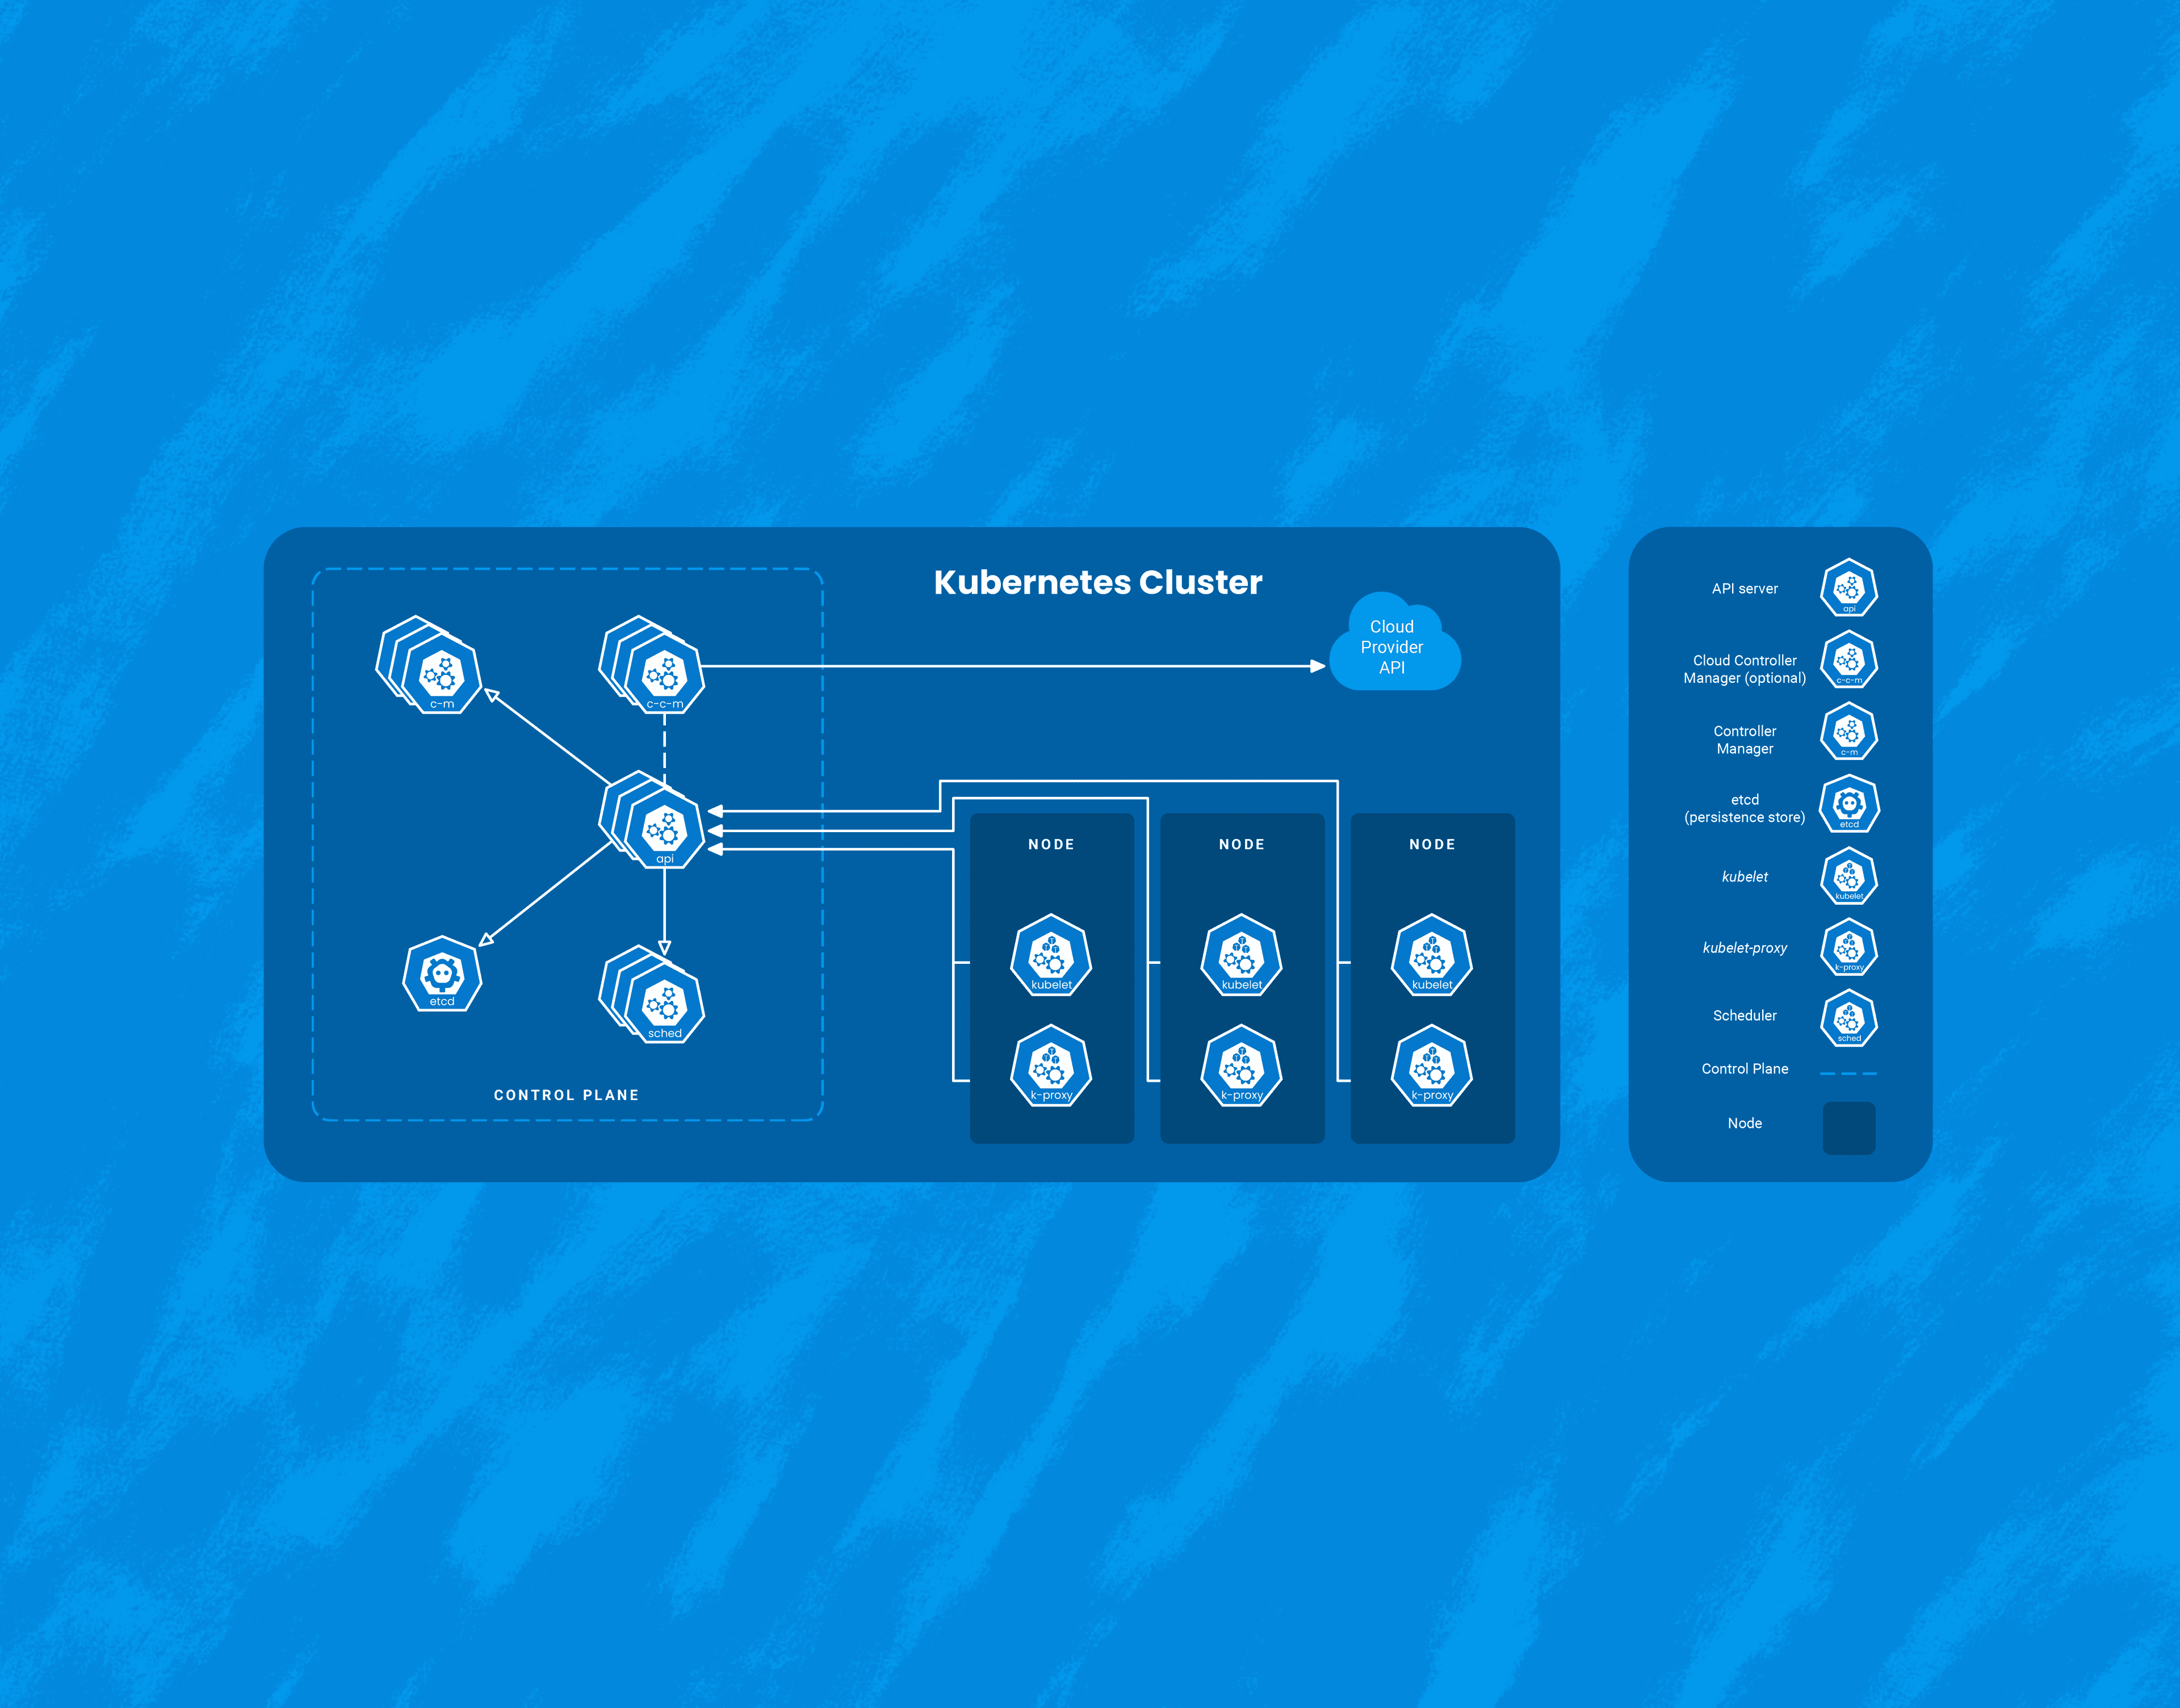
While Kubernetes comes with a number of benefits, it’s yet another piece of infrastructure that needs to be managed. Here, I’ll talk about three interesting ways that Honeycomb uses Honeycomb to get insight into our Kubernetes clusters. It’s worth calling out that we at Honeycomb use Amazon EKS to manage the control plane of our cluster, so this document will focus on monitoring Kubernetes as a consumer of a managed service.

By: Nathan Lincoln
While Kubernetes comes with a number of benefits, it’s yet another piece of infrastructure that needs to be managed. Here, I’ll talk about three interesting ways that Honeycomb uses Honeycomb to get insight into our Kubernetes clusters. It’s worth calling out that we at Honeycomb use Amazon EKS to manage the control plane of our cluster, so this document will focus on monitoring Kubernetes as a consumer of a managed service.
Detect crashlooping pods
When I joined Honeycomb, I was amazed to see that we had a reliable trigger for when pods were crashlooping, which is when a pod appears to start but immediately crashes. This is an incredibly difficult thing to detect when you’re using metrics-based approaches to monitor Kubernetes, because crashlooping is not actually a state in Kubernetes. Instead, it’s an event that Kubernetes fires when it detects that it has restarted a pod too many times in a given period.
With metrics-based approaches, you’re stuck trying to fine-tune a monitor that looks at the rate that pods restart. Since “pod name” can quickly become a high-cardinality metric, you end up looking at the aggregated rate that any pods crash, which gets noisy fast—if it’s even available at all.
Another metrics-based approach I’ve seen is to monitor the difference between the “available” and “desired” count for a given deployment. This problem here is that pods can be unavailable all the time—namely, when you deploy. This approach suffers from the same problems as before: it’s hard to fine-tune this metric to fit your needs.
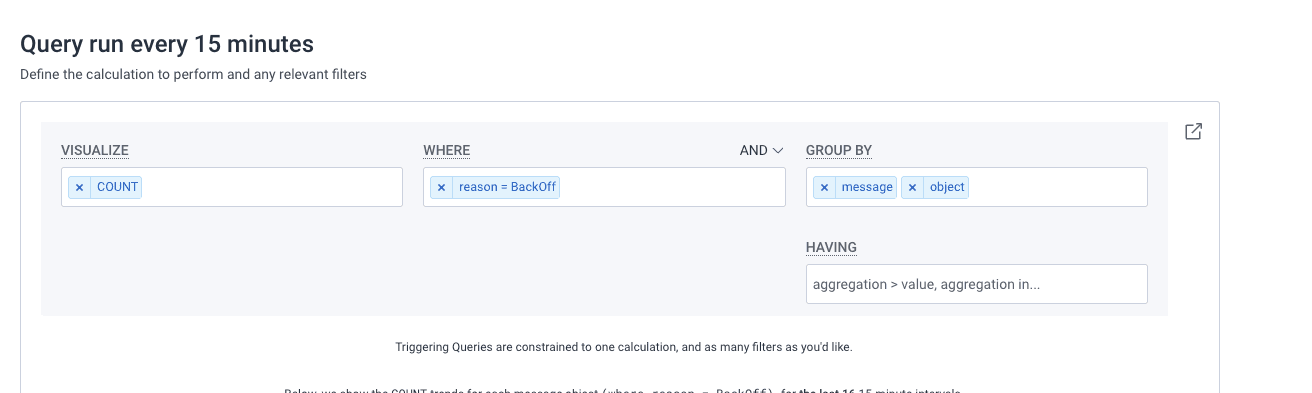
This is frustrating. Kubernetes knows when a pod is crashlooping. How can we get it to surface that to Honeycomb? Enter kspan, which takes the events that your Kubernetes cluster emits and translates them to OpenTelemetry traces. Forward those to Honeycomb, filter by reason = Backoff, group by object, and suddenly you have a query that will reliably trigger on crashlooping pods, and also tell you exactly which pod is crashlooping!
Monitor for older instance generations
We like to run on the cutting edge of AWS instance types at Honeycomb. We were early adopters of the AWS Graviton architecture, and when AWS rolled out the new Graviton3 processor architecture with their 7th generation instance types, we switched to that as well. In doing so, we found that we could run our ingest service much hotter. Instead of targeting 70% CPU utilization, we could target 90% and have similar customer-facing latency and throughput. We adjusted the settings on our Horizontal Pod Autoscaler (HPA) to account for this.
However, AWS resources are not infinite: we became aware that we might not be able to run on the 7th generation instances at all times. Therefore, we configured our autoscaler to fall back to 6th generation instances if that ever came to pass. However, if that happened, it could cause an incident, as our ingest service would be configured to run too hot for the older instance type.
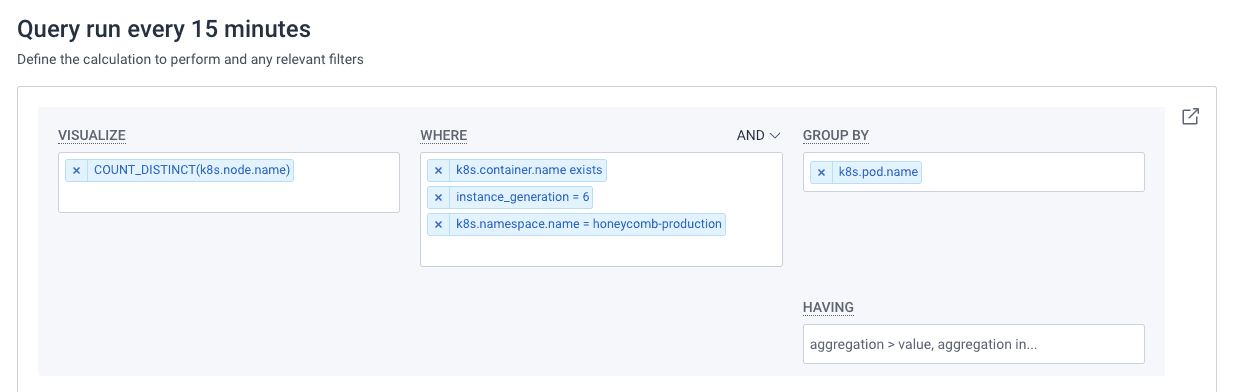
To detect this, we use the honeycomb-kubernetes-agent, which includes the instance type of the node in the telemetry it sends. With this, we can not only detect when this is happening, but have the alert include the exact pod that is running on the 6th generation instance, allowing us to instantly understand the impact of the problem. If we see a significant portion of the fleet running on 6th generation, it would prompt us to adjust the CPU utilization target of our HPA back down to 70% to proactively prevent an incident.
Explore FireHydrant’s Kubernetes Migration
Cool shit the OpenTelemetry Collector gives you
Speaking of autoscaling, how do we monitor the number of pods that our HPA wants to run? This is one of those things that the OpenTelemetry Collector makes easy: using the kubernetes cluster receiver, we receive metrics for how many pods the HPA wants. We can even create a trigger that fires when the desired count matches the maximum amount.
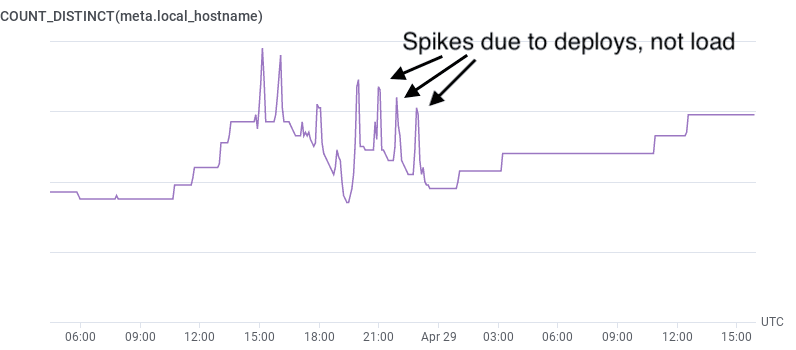
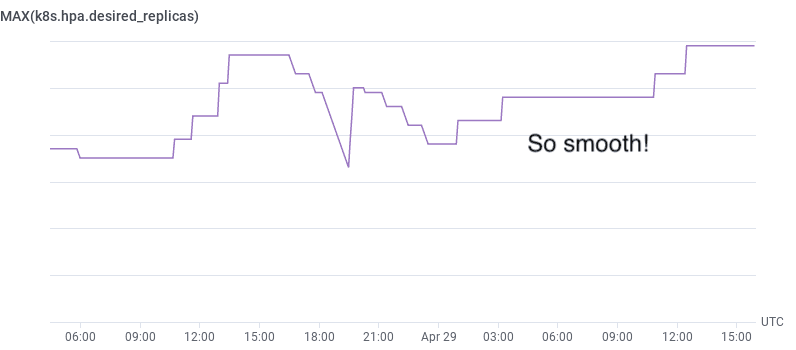
It’s worth asking: why not use COUNT_DISTINCT(pod_name)? Unfortunately, that’ll “spike” when you’re deploying, as each pod spins down and its replacement spins up. Getting the metric straight from the source makes the numbers much more reliable.
We also use the OpenTelemetry Collector to monitor some services that only expose prometheus metrics, such as the aws-node-termination-handler. It’s a relatively simple process to configure the collector to scrape those metrics, using the Prometheus receiver.
Conclusion
The unique capabilities of honeycomb make it a great fit to monitor Kubernetes. Since our product was built from the ground up to support events, it can alert you based on the actual events that Kubernetes emits. For cases where metrics make the best fit, our high-cardinality metrics support allows you to monitor at the pod level.
Want to learn more about Kubernetes? See how we helped FireHydrant seamlessly migrate to Kubernetes.
Want to know more?
Talk to our team to arrange a custom demo or for help finding the right plan.