How Honeycomb Uses Honeycomb, Part 3: End-to-End Failures
At Honeycomb, one of our foremost concerns (in our product as well as our customers’) is reliability. To that end, we have end-to-end (e2e) checks that run each minute, write a single data point…

By: Christine Yen
At Honeycomb, one of our foremost concerns (in our product as well as our customers’) is reliability. To that end, we have end-to-end (e2e) checks that run each minute, write a single data point to Honeycomb, then expect that specific data point to be available for reads within a certain time threshold. If this fails, the check will retry up to 30 times before giving up.
Monday morning, we were notified of some intermittent, then persistent, errors in these automated checks.
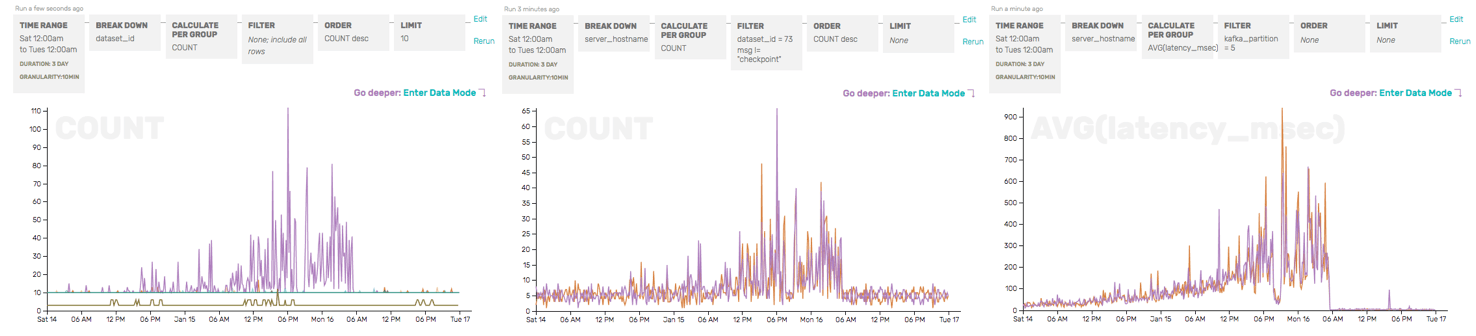
We quickly verified that only one of the e2e checks was failing by checking the COUNT (as a sanity check, and to show where failures were occurring) and the AVG write/read durations (just to get a head start on identifying the root cause of the e2e failures), broken down by partition and success:
The COUNT here shows that, overall, there are only a few failures (dark maroon) for e2ep5—but those correspond with a giant increase in AVG(read_duration)… and that read_durations are elevated even for successful e2e checks for p5 (the green line).
So we’ve confirmed that only partition 5 seems to be having trouble—and that, from a client’s perspective, the write to our API server looks perfectly normal. It’s the read (which relies on the write successfully passing through Honeycomb and being made available for reads) that seems to be the problem here.
While debugging this, we ran into an issue that plagues many an incident-response team: lots of our query results were showing turbulence around the time in question, but which came first? What was the cause?
Graphs from three different datasets, looking at the problematic time period from three different perspectives, all of which told us something was wrong but not quite why.
As we sifted through our data, graphing interesting metrics and breaking them apart by attributes we hoped might be interesting, we eventually placed cum_write_time and latency_api_msec next to each other—two timers that represent two slightly different things (the cumulative time spent just writing to disk for a set of payloads, and the time since API server handoff to Kafka for the last payload). We also isolated the partition we knew was problematic:
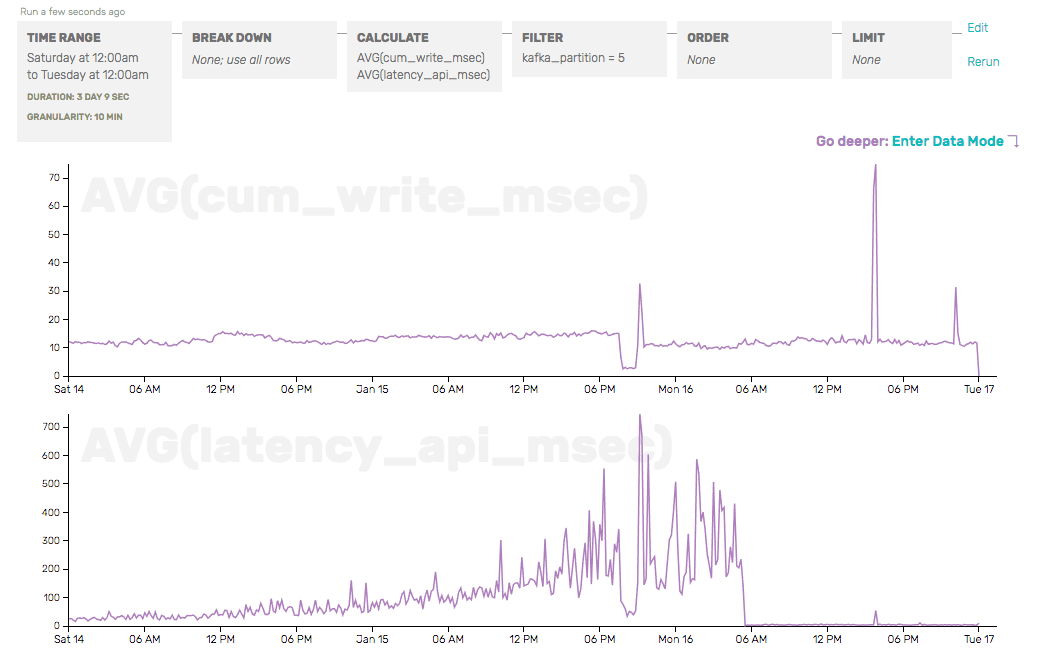
This is enough to tell us that the problem isn’t in our API server writing to Kafka (the e2e check’s write duration would reflect that) or our storage server writing to disk (the cum_write_time would reflect that), but instead in between—and we should take a hard look at the moving parts related to partition 5 in Kafka.
There are some fundamental problems that are difficult to impossible to automate—why was something named poorly, correlation vs causation—but Honeycomb let us quickly slice and compare metrics against each other, along different dimensions, to quickly rule out factors that didn’t actually matter (dataset, server hostname) to hone in on the metrics that really showed what was wrong.
This is another installation in a series of dogfooding posts showing how and why we think Honeycomb is the future of systems
observability. Stay tuned for more!
Curious? Give us a try!
Honeycomb is a next-generation tool for understanding systems, combining the speed and simplicity of pre-aggregated time series metrics with the flexibility and raw context of log aggregators. Sign up and give us a shot today!
Want to know more?
Talk to our team to arrange a custom demo or for help finding the right plan.