Import Datadog Traces Into Honeycomb
Getting existing telemetry into Honeycomb just got easier! With the release of the Datadog APM Receiver, you can send your Datadog traces to the OpenTelemetry Collector, and from there, to any OpenTelemetry-compatible endpoint.

By: Michael Sickles

Getting existing telemetry into Honeycomb just got easier! With the release of the Datadog APM Receiver, you can send your Datadog traces to the OpenTelemetry Collector, and from there, to any OpenTelemetry-compatible endpoint.
Often, evaluating a new tracing solution requires re-instrumenting your applications from the ground up in a new vendor’s tooling. It’s a pretty high bar to clear just to see if a solution is worth adopting. We at Honeycomb have made our own solution easier to adopt by providing a variety of on-ramps to get your data in quickly. This blog will look at the newest addition to our helpers, the Datadog APM Receiver.
OpenTelemetry and the OpenTelemetry Collector
The primary reason that Honeycomb is All-In on OpenTelemetry is that a rising tide raises all boats. Because OpenTelemetry is an open standard, the second most popular CNCF project (behind kubernetes!), and supported by APM and observability vendors alike, it provides a way to instrument your applications while avoiding vendor lock-in. There’s just one catch: in order to benefit, you first have to have an application instrumented with OpenTelemetry.
While migrating to OpenTelemetry may be a worthwhile goal in its own right, it doesn’t do you any good today if you’re looking to evaluate Honeycomb and are on another vendor’s toolchain. That’s where the OpenTelemetry Collector comes in.
The OpenTelemetry Collector provides a way to gather observability data from a variety of sources and send that data to Honeycomb. With the release of the Datadog APM receiver, this includes traces in the Datadog Trace Agent Format. In just a few minutes you can generate a configuration file to send your existing Datadog traces to Honeycomb, and evaluate whether it’s the right solution for you.
Let’s take a look at how.
OpenTelemetry Collector Builder
To set up the Datadog APM receiver, we’ll use the OpenTelemetry Collector Builder to build a custom distribution of the Collector by choosing which receivers, processors, and exporters to include. Make sure to update your configuration with the desired version of the OpenTelemetry Collector. As of the publication of the receiver, the latest version was 0.56.0. The full release list is available here.
Save the below yaml in a `builder.yml` file. Notice how it references the Datadog receiver:
dist:
  #radical
  name: custom-collector
  output_path: "./bin"
  otelcol_version: 0.56.0
exporters:
  - import: go.opentelemetry.io/collector/exporter/otlpexporter
    gomod: go.opentelemetry.io/collector v0.56.0
  - import: go.opentelemetry.io/collector/exporter/loggingexporter
    gomod: go.opentelemetry.io/collector v0.56.0
receivers:
  - import: go.opentelemetry.io/collector/receiver/otlpreceiver
    gomod: go.opentelemetry.io/collector v0.56.0
  - gomod: "github.com/honeycombio/opentelemetry-collector-configs/datadogreceiver v0.1.0"
processors:
  - import: go.opentelemetry.io/collector/processor/batchprocessor
    gomod: go.opentelemetry.io/collector v0.56.0
replaces:Next, build the custom Collector with the following command:
builder --config ./builder.ymlThis will output a custom binary in the bin folder to be deployed to the target machine.
Running
To run this Collector, start the binary referencing your Collector configuration file that includes the Datadog receiver.
Collector Config Example:
receivers:
 otlp:
   protocols:
     grpc: # on port 4317
     http: # on port 4318
 datadog:
processors:
 batch:
exporters:
 otlp:
   endpoint: "api.honeycomb.io:443"
   headers:
     "x-honeycomb-team": ${HONEYCOMB_API_KEY}
service:
 extensions: []
 pipelines:
   traces:
     receivers: [otlp, datadog]
processors: [batch]Run this command:
./custom-collector --config=./path/to/collectorconfig.ymlThe default configuration is to listen for Datadog traces on port 8126.
Testing
Now that it’s running, the Collector is able to receive traces. Your Datadog-instrumented application just needs to output to wherever your Collector is installed on the specified port. By default, Datadog tracing agents output to 8126. If you have your Collector on the same machine as the application, it should pick up the traces. Use the DD_TRACE_AGENT_URL property to change where traces are sent if your Collector is running remotely (for example, on the application): DD_TRACE_AGENT_URL=http://custom-collector-url:8126.
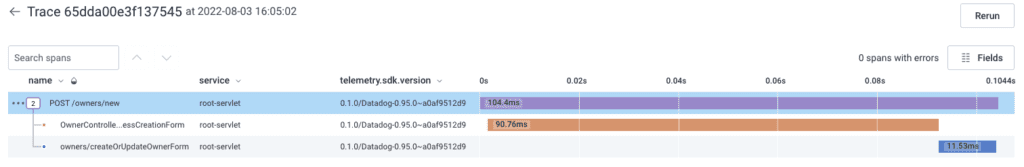
The telemetry.sdk.version property should tell you which version of the receiver you are using, as well as which version of the Datadog agent you are using.
Caveats
- The receiver can only ingest tracing data.
- A Datadog agent can only output to one location. If you need to dual-send to Honeycomb and Datadog, you will have to either set up a proxy to do this, or set up a Datadog exporter along with the OTLP exporter in your Collector config.
- It would be to your advantage to switch to OpenTelemetry. This receiver is not meant to be a long-term solution, only a placeholder while you switch to OpenTelemetry.
- The code was originally written in a closed PR from the opentelemetry-collector-contrib repo and then updated to the latest standards.
Next Steps
With the release of the Datadog APM Receiver, you can now send your datadog traces to Honeycomb—even if your applications haven’t been instrumented with OpenTelemetry. You can learn more about using the OpenTelemetry Collector with Honeycomb in our documentation.
Don’t have a Honeycomb account? No worries! You can create a free account any time, or check out our interactive sandbox to get hands-on with no signup required.
Want to know more?
Talk to our team to arrange a custom demo or for help finding the right plan.