Incident Review: Working as Designed, But Still Failing
A few weeks ago, we had a couple of incidents that ended up impacting query performance and alerting via triggers and SLOs. These incidents were notable because of how challenging their investigation turned out to be. In this review, we’ll go over interesting patterns associated with growth, and complex systems—and how these patterns challenged our operations.

By: Fred Hebert
A few weeks ago, we had a couple of incidents that ended up impacting query performance and alerting via triggers and SLOs. These incidents were notable because of how challenging their investigation turned out to be. In this review, we’ll go over interesting patterns associated with growth, and complex systems—and how these patterns challenged our operations.
This post contains a superficial overview of the incident and focuses on some of the lessons we learned. A long-form report is available here, which contains more technical details and in-depth versions of the lessons we learned.
The incident
Context
Our data storage has two tiers: hot data, stored on the query engine hosts, and cold data, stored in S3 and queried via AWS Lambda. Hot storage is usually reserved for recent data, and cold storage for older data.
Queries use both types of storage, whereas triggers are expected to use recent data and mostly hot storage. SLOs do stream analysis independently, and only access cold storage when derived columns for SLIs change: we run a backfill, looking at old events and recomputing what stream analysis would have found.
A week before the incidents, we noticed one of our enterprise customers had inaccurate timestamps in their telemetry data, containing few events very far in the future. Short trigger queries started consistently looking into cold storage via Lambda, which tied triggers to Lambda capacity, and coupled trigger performance to other query types.
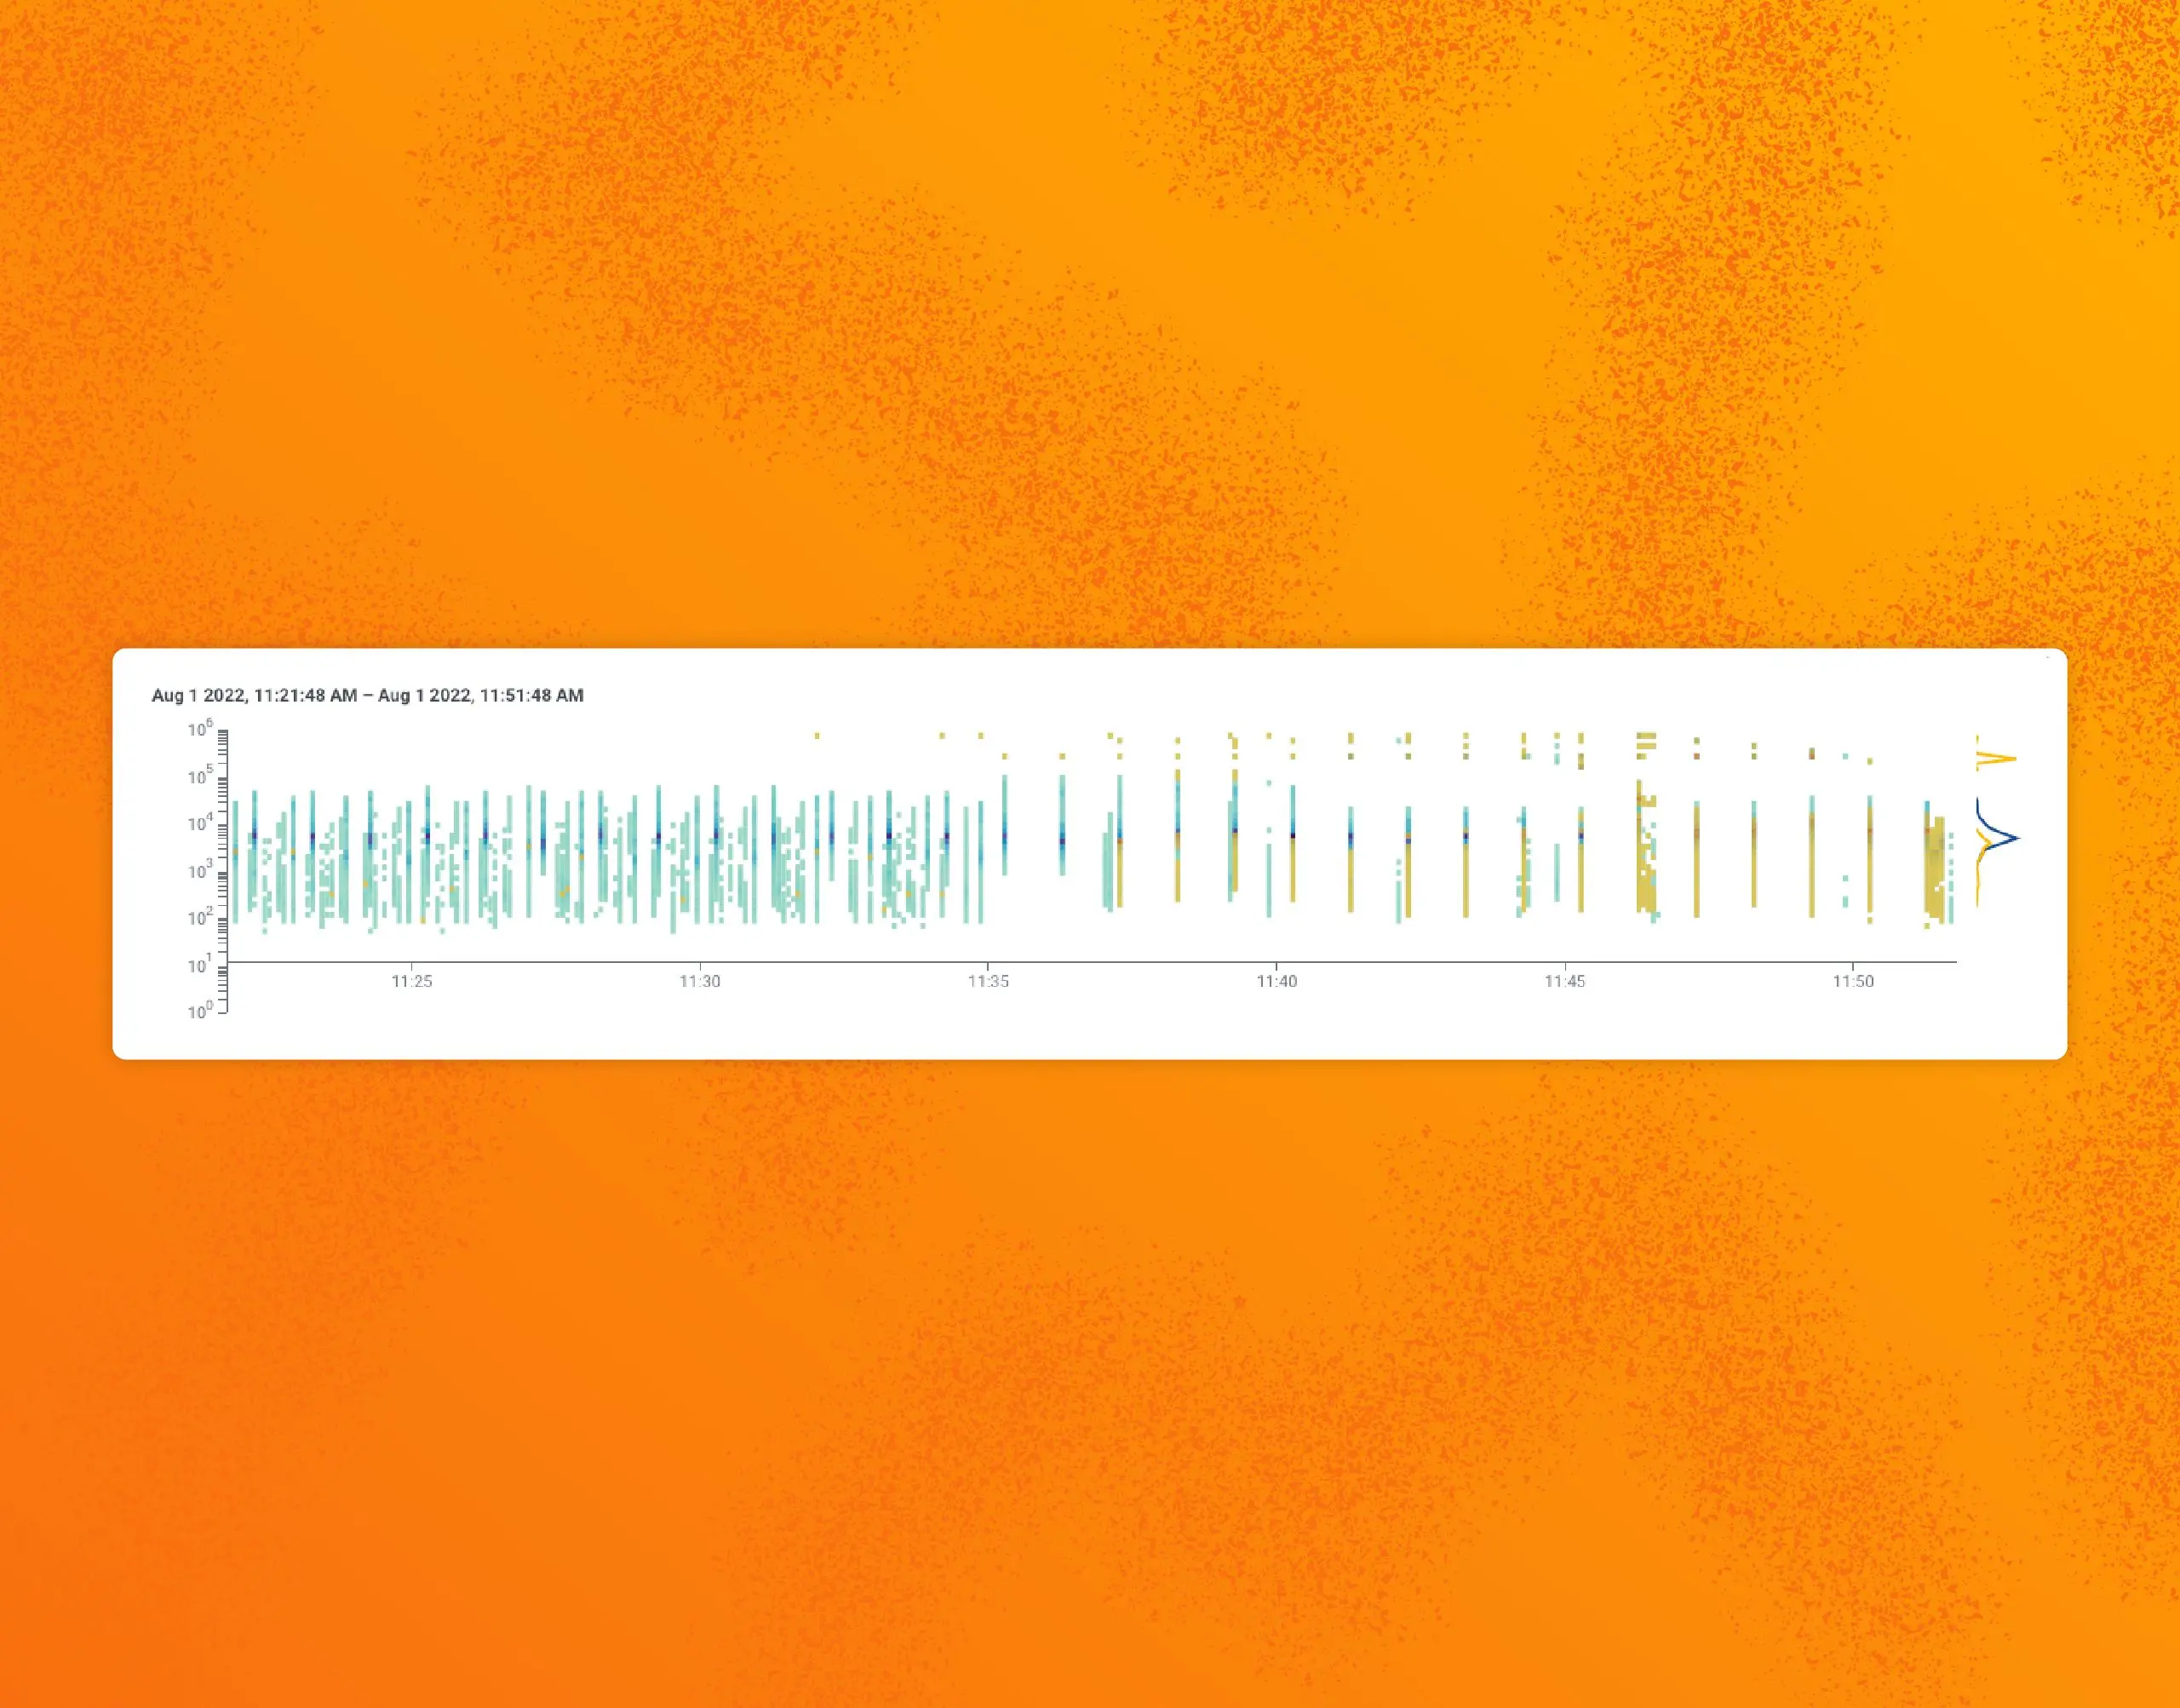
During the first week of August, our SLO measuring trigger runs started blaring. Our BubbleUp view of the last few hours showed the problem:
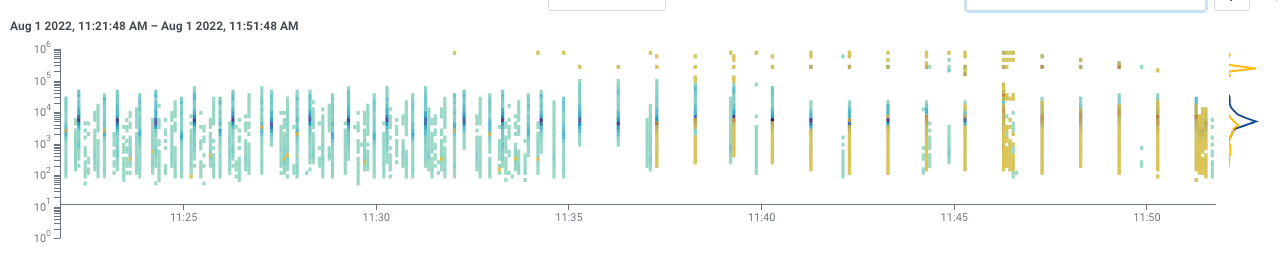
Around 11:35 a.m. ET, runs become spaced apart, taking longer or failing. We believed triggers were exhausting Lambda capacity and tried mitigating the impact, but we ran into a lot of red herrings. We tweaked query timeouts and other internal flags to bring it all under control.
A resurgence, then resolution
It took another engineer—one who wasn’t on call, wasn’t tied to the ongoing context—investigating to notice that, in fact, while triggers’ Lambda usage was higher than usual, much of the burden came from Basset evaluating SLOs:
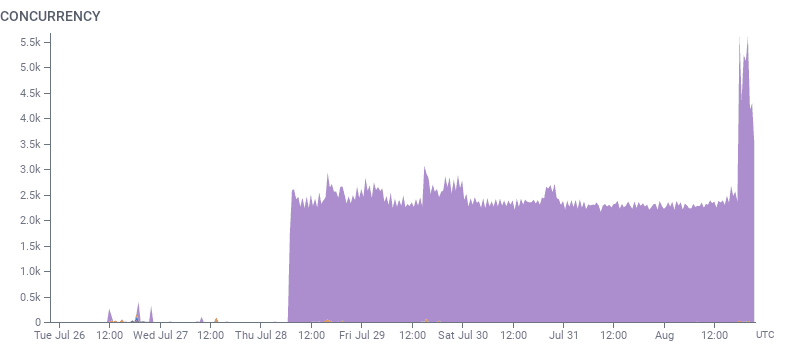
This big purple mass of pain was a single SLO from one of our large enterprise customers with lots of data.
We’d been aggressively backfilling only this one SLO, for days. We noticed that this was due to one SLI that never returned valid results (true, false, or null).
Whenever Basset encountered an SLO with no cache line, it assumed that a backfill was required, which may have looked at as much as 60 days worth of cold data. Since it had no valid results, it wouldn’t create a cache line.
Every minute, another check would relaunch the backfill. That was where all the Lambda capacity was going.
To stop the bleeding, we fixed the SLO on behalf of the customer, who was looped in. Overall, the incident and its direct investigation spanned roughly 9 hours out of the day, though the worst of its impact lasted 4 hours.
We had about a week or two worth of work done to correct the system, and we’re now in a situation where this specific set of weird interactions isn’t a significant risk.
Analysis
Complex interactions
This incident required a convergence of factors:
- Known issues with future stamps suddenly being used by a customer, which tripped usage alerts and hid their broken SLOs.
- Various query paths relying on a shared pool of resources.
- Features that usually work well resulting in heavy resource usage when hitting edge cases.
- Red herrings making investigation and resolution more challenging.
There were, strictly speaking, no bugs. Everything worked as intended, customers used the system in legitimate ways, and operators used information that was valid. But when put together, things were broken.
This type of fault is hard to see and prevent ahead of time. Decoupling can minimize their impact by restricting points of interactions of various components. However, decoupling often comes at a higher cost: duplicated efforts, higher fixed overheads, and impacts on the organization structure. It also carries its own failure scenarios. Where possible, we did decouple—however, some coupling was necessary to keep for abstraction and efficiency purposes. As a solution, we added constraints at ingest time to restrict how much triggers may depend on Lambda.
Broad perspectives
The Incident Commander (IC) turned out to be the engineer who had been monitoring the future-stamps already. Once this engineer became IC, that framing was shared and turned dominant for most engineers that were part of the incident. This led to a key unquestioned assumption: Lambda usage was assumed to be due to future-stamps in triggers, but the bulk of it came from the backfill issue.
Most alert signals even validated this assumption. The volume of Lambda usage for triggers did not fully match the overall Lambda usage on the platform, but that went unnoticed. A better framing came when an engineer who was not yet involved decided to reinvestigate from first principles, which led to the SLO issue and a resolution.
To break out of a dominating, inadequate theory, there’s a need for contradictory evidence—particularly in the presence of evidence that supports a dominant-but-inaccurate theory. New viewpoints depend on outside eyes. External viewpoints coming in at a later time means that the signals and evidence have new context. What was important early on may no longer be useful when you start from now and information is framed differently.
Valid but unexpected use cases
We give attention to typical use cases when designing software. We also know that what is possible is broader than what is going to be the garden path we encourage. This incident implied usage patterns that we thought were acceptable but infrequent, or slightly different. This is common when your development is experimental and involves a lot of prototyping and feedback cycles. Some of these risks never get addressed, and live in production for years without issue.
There are a few useful practices here:
- Adding controls that can be tweaked to quickly clamp down on usages we expect could be problematic. If you have a trigger, that trigger can be disabled. If you send us future data, we have a way to choose how far it can go before we restamp it. This has saved us countless times by temporarily stabilizing the system and giving engineers time to address surprises.
- Fight alert fatigue. Before usage alerts get crossed often enough that it feels normal, create an exception on the current tier and add an extra alert tier. This lets us know that a “not great but not terrible” situation has degraded to “terrible.”
- Re-evaluating whether what we consider “normal” usage lines up with our ambitions. As we grow as a company, so do typical or atypical workloads.
A trap we can fall into is thinking “using it that way may be abuse.” What we keep seeing is that preventing unexpected behavior as if it were done by an abusive entity is not acceptable: our worst surprises come from users who love the product and find it solves problems in ways we had not imagined.
Conclusion
Since the incident, the SLO behavior for failures has been corrected, and we’re thinking of new ways to communicate these issues to customers directly. We’ve changed the default policy to clamp down on future-stamps more aggressively.
We’re also looking for other patterns, such as increasing our on-call engineers’ ability to search and categorize feature flags when operating components without being familiar with them, and we’re looking for better ways to support the role of Incident Commanders to prevent cognitive overload.
We hope that sharing this type of information and experience helps surface more ideas and practices that can be useful when dealing with emerging challenges and complexity. Let us know if you have any ideas in our Pollinators slack. We’d love to collaborate!
If you’d like to read the full report, you may do so here: Full Incident Report.
Want to know more?
Talk to our team to arrange a custom demo or for help finding the right plan.