Investigating Mysterious Kafka Broker I/O When Using Confluent Tiered Storage
Earlier this year, we upgraded from Confluent Platform 7.0.10 to 7.6.0. While the upgrade went smoothly, there was one thing that was different from previous upgrades: due to changes in the metadata format for Confluent’s Tiered Storage feature, all of our tiered storage metadata files had to be converted to a newer format.

By: Terra Field
Earlier this year, we upgraded from Confluent Platform 7.0.10 to 7.6.0. While the upgrade went smoothly, there was one thing that was different from previous upgrades: due to changes in the metadata format for Confluent’s Tiered Storage feature, all of our tiered storage metadata files had to be converted to a newer format:
[2024-05-22 00:32:03,023] INFO Migrating tier partition state file format for flE-6I70RCyT2gK2Qc3YBw:retriever-mutation-10 (kafka.tier.state.FileTierPartitionState)
[2024-05-22 00:32:29,962] INFO tier partition state file format migration complete for topicIdPartition flE-6I70RCyT2gK2Qc3YBw:retriever-mutation-10, state file size changed from 508509470 to 591531390 (kafka.tier.state.FileTierPartitionState)Unfortunately, this process does not have a similar setting to num.recovery.threads.per.data.dirthat would allow the work to be parallelized, and so only one of these will run at a time. The files themselves were fairly large (over 600 megabytes in the case of our busier partitions) so it wasn’t surprising that the conversion process took time (in the case above, one tier partition state file took 26 seconds). However, since it was only going to happen on upgrades (and presumably they won’t do metadata changes that often), I decided to put in a support ticket and otherwise not worry about it.

Tiered storage metadata—the sequel
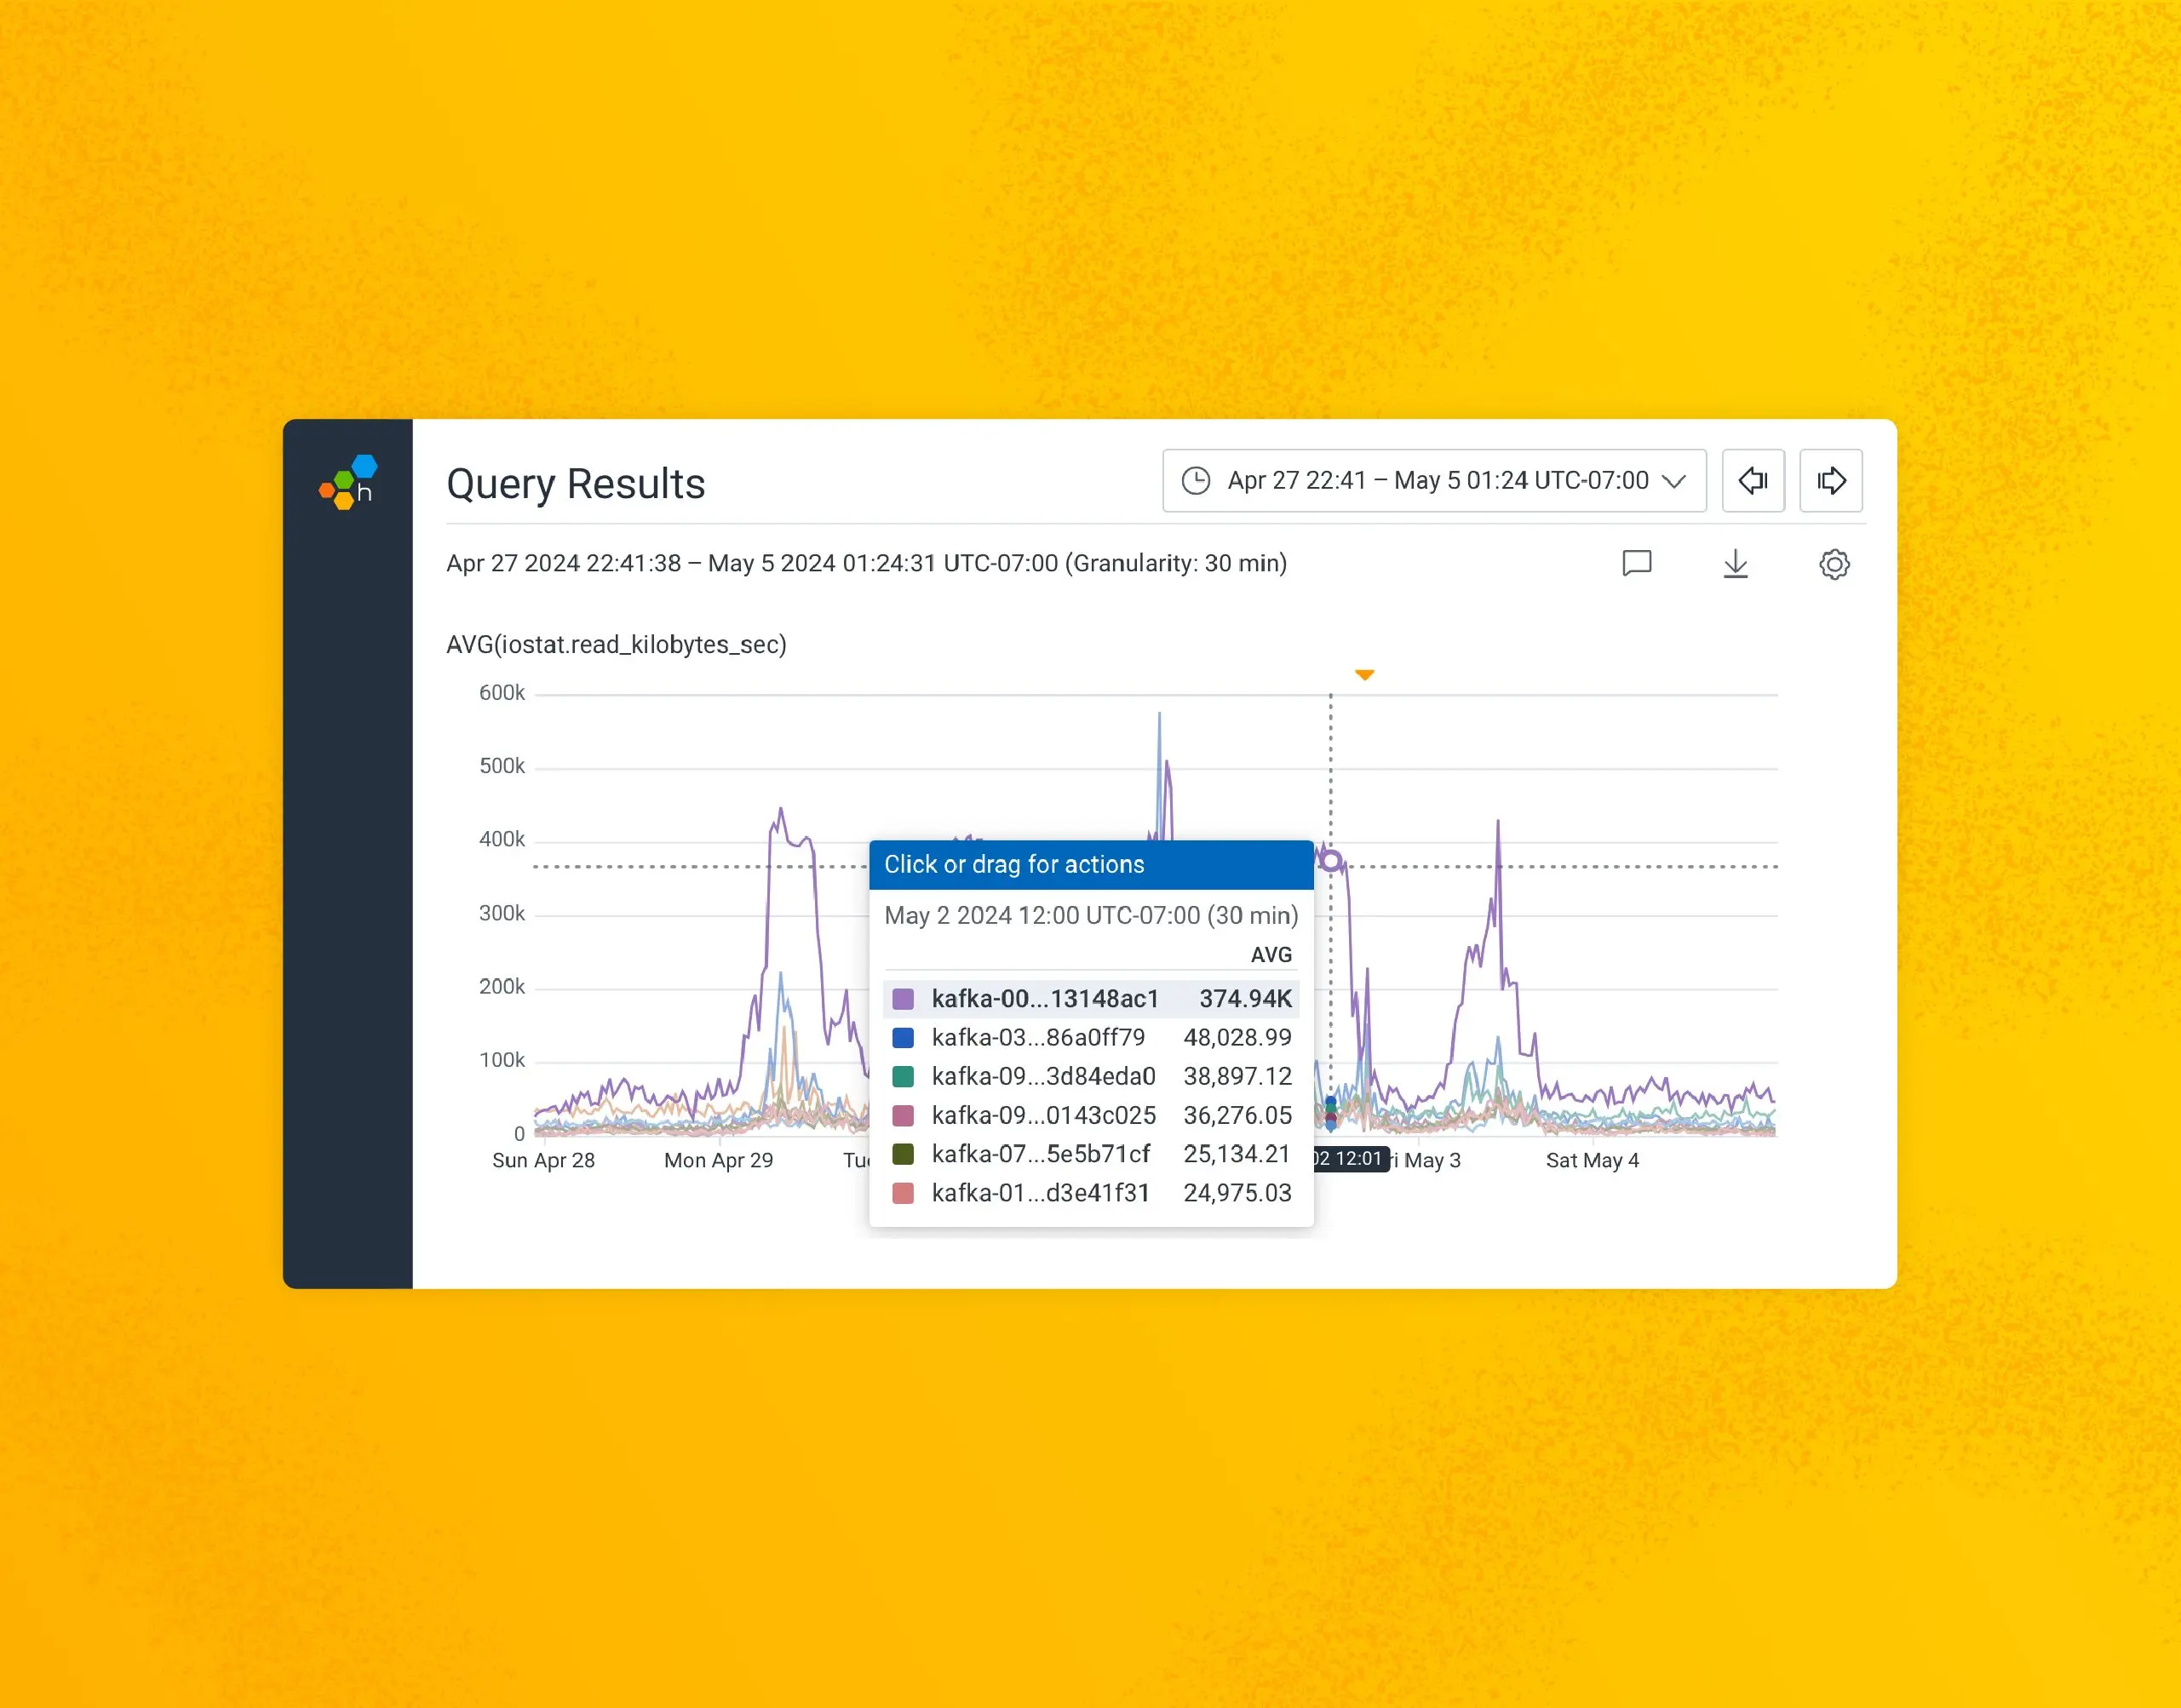
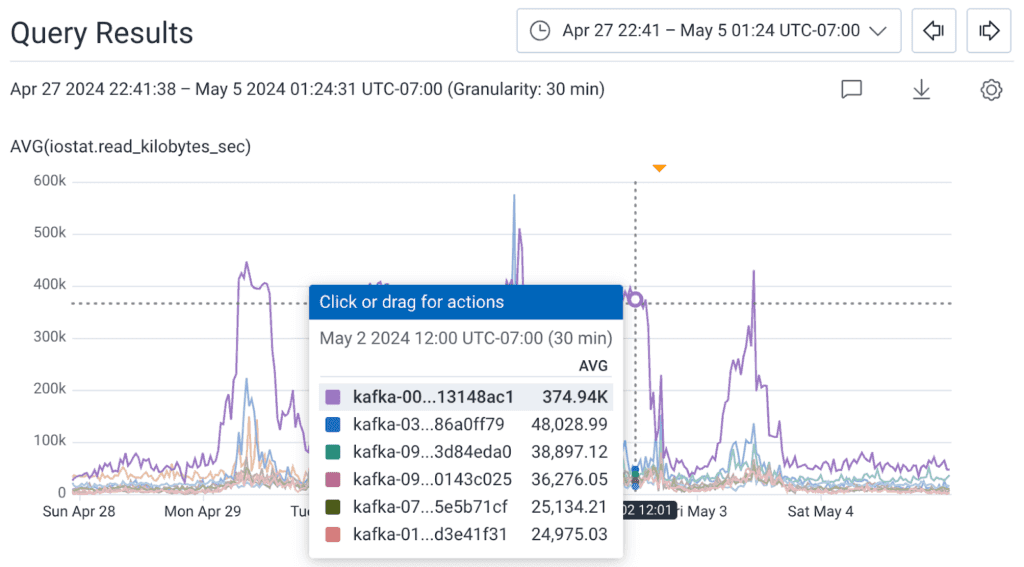
A few months later, I was investigating an incident where some SQL updates caused Kafka Connect to send a larger amount of data than normal to our brokers, and I noticed something strange: one broker in our production cluster had dramatically higher sustained read I/O than the other eight. During peak, it was doing eight times more read IOPS (input/output operations per second) on the NVMe SSD that we store Kafka data on than the other brokers.
And that’s what we call balance
We use Confluent’s Self-Balancer (based on LinkedIn’s Cruise Control) to keep our brokers in balance, so they’re usually within a few % of each other in terms of utilization. Not only that, but it is pretty unusual for our brokers to read from their disk at all.
One of the reasons Kafka is so fast is that it politely asks the Kernel to store data on a filesystem, but doesn’t much care how fast the data is persisted. This means that the kernel is free to write this data to its page cache but doesn’t have to write it to disk immediately, and that the kernel can optimize how it eventually writes the data out to the storage device. This might seem dangerous, but remember: as soon as a Kafka broker has a copy of something, that data is then read by the replicas (assuming they are in sync). With a proper replication configuration, you’d need a failure on multiple brokers for a piece of data in the page cache to be lost.
This behavior also affects how reads occur in Kafka. On a broker with sufficient memory, and depending on how much incoming traffic it has, if all of the consumers read from the very end of the log, they will always read from the page buffer. This means that a “read” in most cases for our Kafka clusters doesn’t actually involve disk I/O. Therefore, it is pretty unusual for our brokers to do much I/O at all, let alone saturate their SSDs. During normal operations, the only time we see extensive read I/O is when we terminate a broker (which we do weekly in each of our clusters) and its replacement goes to grab the data it is missing from the replicas.
What is that you’re reading? 📖
In a scenario like this, the first thing I check is whether this is tied to how much data we’re ingesting. If someone is sending us a lot more data, it can sometimes cause a broker to be overloaded. Usually, this would manifest itself as a replica going in and out of sync with its leader (flapping). There was no flapping though, and the shape of our incoming customer data hadn’t changed significantly.
Additionally, the pattern of the unexplained IOPS definitely matched our pattern for incoming customer data, so it was pretty clearly tied to our ingestion. I then went to see where this data was going. If something is reading data that isn’t in the page cache (such as by requesting data that was now a couple hours old), that data would be going somewhere, but the only thing interesting about our network traffic was how uninteresting it was. There was no corresponding change to network traffic to go with the change in IOPS.
Why would we be reading data from the disk but not sending it anywhere?
In order to figure this out, I decided to use a tried and true solution I’ve used to answer this question in the past: What data is actually being read from a file system/block device?
Thankfully, I’ve had the SystemTap script from this excellent Stack Overflow answer saved to my Giant Directory of Random Scripts™ for quite some time. One install of SystemTap and Kernel debug symbols later, I was ready to track down what exactly was doing all of these IOPS, and the answer was… not at all what I expected!
R 111724 /var/lib/kafka/data/retriever-mutation-53/00000000000000000000.tierstate.mutable
R 112825 /var/lib/kafka/data/retriever-mutation-18/00000000000000000000.tierstate.mutable
R 112843 /var/lib/kafka/data/retriever-mutation-19/00000000000000000000.tierstate.mutable
R 119265 /var/lib/kafka/data/retriever-mutation-10/00000000000000000000.tierstate.mutable
R 125779 /var/lib/kafka/data/retriever-mutation-35/00000000000000000000.tierstate.mutable
R 125857 /var/lib/kafka/data/retriever-mutation-33/00000000000000000000.tierstate.mutable
R 127535 /var/lib/kafka/data/retriever-mutation-34/00000000000000000000.tierstate.mutable
R 128281 /var/lib/kafka/data/retriever-mutation-27/00000000000000000000.tierstate.mutable
R 130245 /var/lib/kafka/data/retriever-mutation-11/00000000000000000000.tierstate.mutable
R 138090 /var/lib/kafka/data/retriever-mutation-29/00000000000000000000.tierstate.mutable
R 140152 /var/lib/kafka/data/retriever-mutation-20/00000000000000000000.tierstate.mutableWhat you are looking at there is the top files in terms of read IOPS in a given one minute period on one of our production Kafka brokers. That’s right: the unusual I/O I was seeing is reading those same metadata files that caused our long broker upgrades in February. Totalling all of the read IOPS in a given minute during peak time to our Kafka data directory on the problem broker, we were doing ~54,000 IOPS on a device that for our im4gn.4xlarge AWS instances is rated for 40,000 IOPS. 😳
Where is the impact?
One thing that we haven’t talked about up until this point is: what is the impact of this extra I/O? In terms of practical impact, I’m fairly certain there wasn’t any—this is I/O that would go mostly unused under normal circumstances, and even during a broker replacement it didn’t seem to have a noticeable impact. In fact, the replacement broker picked up the symptoms once it came online. I was still concerned though, because while most of the time these devices aren’t heavily utilized, they are sometimes—and I’d hate to find out this was bottlenecking us during something latency or throughput sensitive. Plus, it was weird. Who doesn’t want to figure out something weird??
What a long strange KIP it’s been
Ok, so now we’ve figured out where the mystery IOPS are going. What’s our next step? Unfortunately, even though Tiered Storage (KIP-405) is now a feature of the Apache Kafka project, Confluent’s implementation is still closed source. This didn’t leave me a lot of options beyond checking Confluent’s documentation, which didn’t really cover the topic. So, I put in a support ticket. I worked with an excellent support engineer at Confluent who was able to dig on their side and find some settings that enable cleaning of tier storage metadata.
I never metadata I didn’t like*
Confluent advertises Tiered Storage as “infinite retention,” and that is sort of true, but I suspect for people who never delete their Kafka data, this metadata will eventually become a scaling issue of its own—as it did for us. We don’t use Tiered Storage for infinite retention—we only keep our data in S3 for a few days—and we’ve been using it for three years so you can imagine how much metadata we’ve been keeping about data that expired before I joined the company.
The relevant settings that we found are these:
# Enable Tier Partition State Cleanup
confluent.tier.partition.state.cleanup.enable=true
# Delay metadata cleanup until this many milliseconds after something has been deleted from Tiered Storage (default 30 days)
confluent.tier.partition.state.cleanup.delay.ms=2592000000
# How often metadata should be cleaned up, with a 50% skew to avoid all metadata being cleaned up at the same time.
confluent.tier.partition.state.cleanup.interval.ms=86400000One caveat about these settings is that until you set confluent.tier.partition.state.cleanup.enable=true, the cleaner does not track the age set in confluent.tier.partition.state.cleanup.delay.ms, meaning that that many milliseconds from when you first enable this, all data that has been tombstoned up until the moment you enabled it will become eligible for cleanup. Which results in something like this (as seen on one of our development clusters):
[2024-05-19 15:04:47,458] INFO 1292021 segments removed by cleanup from tier partition state file for topicIdPartition 7XWCdjQqTIyy9OgycPxg2A:retriever-mutation-0, state file size changed from 147891612 to 601218 (kafka.tier.state.FileTierPartitionState)
[2024-05-19 17:54:17,697] INFO 1407595 segments removed by cleanup from tier partition state file for topicIdPartition 7XWCdjQqTIyy9OgycPxg2A:retriever-mutation-2, state file size changed from 161056104 to 590274 (kafka.tier.state.FileTierPartitionState)
[2024-05-19 19:12:32,810] INFO 1435936 segments removed by cleanup from tier partition state file for topicIdPartition 7XWCdjQqTIyy9OgycPxg2A:retriever-mutation-1, state file size changed from 164283900 to 587196 (kafka.tier.state.FileTierPartitionState)That is a reduction in size by ~2.4 orders of magnitude. Not too shabby. Knowing how much time Kafka spends reading these files on boot and reading/writing them during operations, having them in the hundreds of kilobytes is a lot more manageable than hundreds of megabytes. With the cleaner running periodically, we will ensure that the files stay a reasonable size. I do wonder what benefit (if any) folks will see from these settings who are using Tiered Storage for “infinite retention.” I’m also going to do some reading and testing to see how the open source version of Tiered Storage handles this.
Shrinkflation
In order to figure out just how much of a reduction we were seeing, I needed to extract some data from the Kafka logs we collect and do a little bit of math, so I built some Derived Columns in Honeycomb to generate the data in the table above:
Name: dc.tiered_storage_state.difference
Description: returns the percent reduction in size of the tiered storage state file

IF(
  CONTAINS(
    $message,
    `removed by cleanup`
  ),
  MUL(
    DIV(
      SUB(
        INT(
          REG_VALUE(
            $message,
            `state file size changed from \d+ to (\d+)`
          )
        ),
        INT(
          REG_VALUE(
            $message,
            `state file size changed from (\d+)`
          )
        )
      ),
      INT(
        REG_VALUE(
          $message,
          `state file size changed from (\d+)`
        )
      )
    ),
    100
  )
)In every partition of our largest topic, the tiered storage metadata saw over 99% reduction in size, totaling nearly 700 megabytes for our largest partition, which contained the metadata for 6 million segments that had been deleted, weeks, months, or even years ago.
As for the mysterious I/O that had been consistently showing up on some of our brokers for months that started me down this path?
Gone!
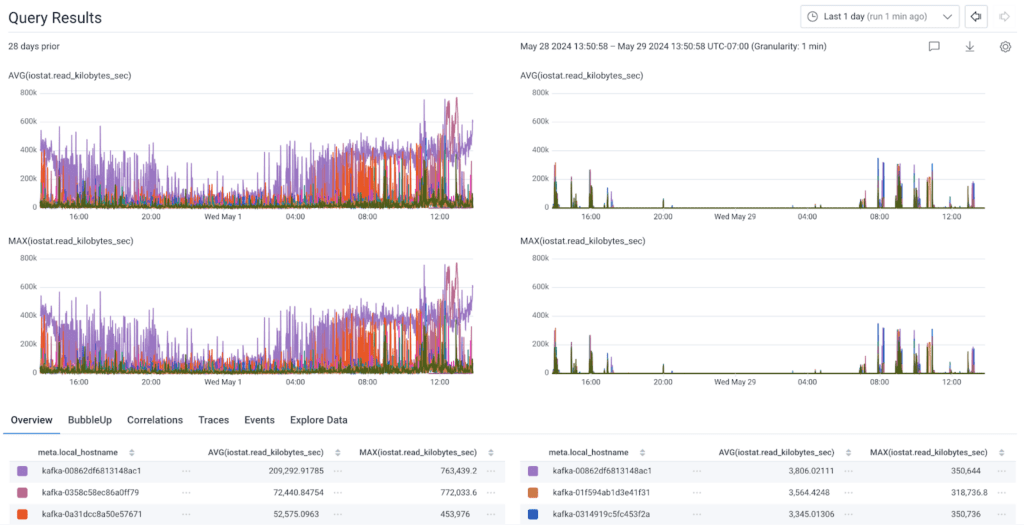
Our brokers are back to not doing very much with their SSD under normal circumstances, which is exactly what we expect and where we want them to be. It also reduced the time it takes our brokers to start in the event of a rolling upgrade—from over 20 minutes in most cases to under a minute now.
Closing thoughts
This investigation ended up exposing a few different shortcomings in our Kafka infrastructure, from gaps in observability to decisions we made years ago that haven’t been reevaluated even as we scaled Kafka further and further.
One really common issue with Kafka and other systems (RabbitMQ, etc.) that have resiliency baked into their architecture is that they are “out of sight, out of mind.” Kafka doesn’t break often, and generally we don’t have performance problems with it. This is great, but also means that it might not get the attention it would if it was more frequently causing us issues.
This is a good reminder to be intentional about maintaining and modernizing your infrastructure—even the quieter parts.
Are you a fan of our internal discovery posts? You might get a kick out of this one: How We Leveraged the Honeycomb Network Agent for Kubernetes to Remediate Our IMDS Security Finding.
* I can’t tell you how many times I’ve used this joke. I’m sorry.**
** No she isn’t.
Try Honeycomb and you too can write your own fun internal discovery blog posts.
Want to know more?
Talk to our team to arrange a custom demo or for help finding the right plan.