Lessons Learned From the Migration to Confluent Kafka
Over the last few months, Honeycomb’s platform team migrated to a new iteration of our ingest pipeline for customer events. Our migration to this newer architecture did not go too smoothly, as can be…

By: Fred Hebert
Over the last few months, Honeycomb’s platform team migrated to a new iteration of our ingest pipeline for customer events. Our migration to this newer architecture did not go too smoothly, as can be attested by our status page since February. There were also many near-incidents where we got paged and reacted quickly enough to avoid major issues.
We’ve decided to write a full overview of all the challenges we had encountered, which you can download. It contains more details and challenges than this blog post, which summarizes the overarching theme for this migration—dynamic changes on the performance envelope of a critical system getting modified and its impact on operations—along with some lessons learned.
Kafka cluster updates
As we continue to scale and grow, we regularly tune our Kafka cluster around various factors such as cost or retention. The important characteristics we were trading off against each other are:
- Storage costs. At least 24 hours—ideally 5 days—of Kafka data retention in case of any mishaps downstream (e.g., data corruption).
- Instances count. We’re storage-bound, so our instances sit around with non-disk resources idle.
- Operational costs. Load and partition management is mostly manual and tedious to do.
This led us toward the Tiered Storage feature in Confluent Platform 6.0, which let us offload cold Kafka segments to S3. In turn, our cluster would no longer be scaled only by disk size (expensive), and we could use the CPU, RAM, and network that we pay for. We could scale down from 36 instances to 6 (of a different type), and turn on features like auto-rebalancing and rack awareness.
The confluent Kafka migration
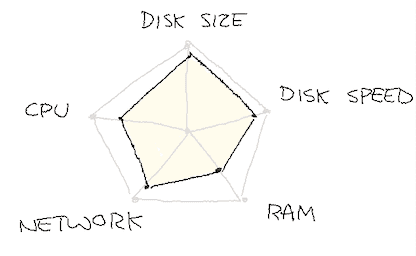
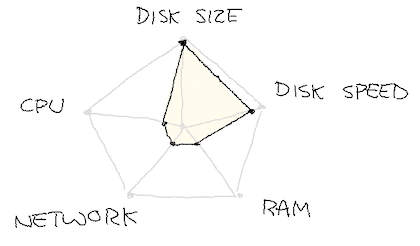
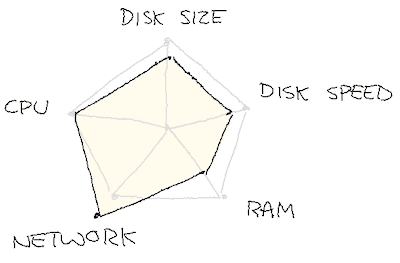
We expected that we could move from the utilization profile on the left (over dozens of hosts) to the one on the right (over only 6):
We turned on tiered storage, progressively uploading all of our longer retention data to S3, and only keeping a few hours locally. We then booted up 6 new hosts of type m6g.xlarge, manually moved the topics over, up until we could get rid of the 36 i3en.xlarge instances.
Things were going fine until we lost an instance, and hell broke loose. One of our engineers found out that we had mistakenly migrated to the m6g.large instance type—the same one we used in internal environments—instead of the m6g.xlarge type we had planned for.
This was subtle enough that reviews and careful rollouts over days just made it invisible. Since nothing went wrong, we put more and more load onto the new hosts. It’s only when a failure happened that they could no longer cope with demand.
Of positive feedback loops
We started moving partitions back to the older bigger machines, and things got even worse. The new hosts were replicating slower than expected.
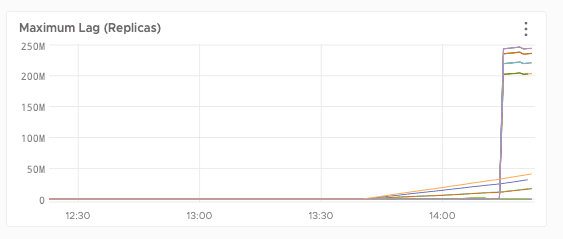
We tried helping things catch up by using administrative functions to shift traffic from underpowered instances to others that had spare capacity, so the former could have all the resources they needed to replicate while shifting most of the work back to the old cluster.
Unfortunately, we had been over-using the network: AWS throttled us and our capacity got even more constrained.
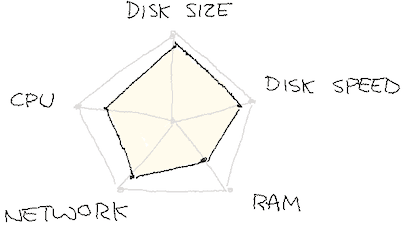
We unknowingly had been running over our allocated share of resources, blowing out our ability to cope with the load we had. It’s still unclear right now if the limits we ran into were due to the network or the disk speed (through Amazon’s Elastic Block Store (EBS) rate-limiting under similar mechanisms). Both profiles below are as likely, and we possibly hit each one of them in succession:
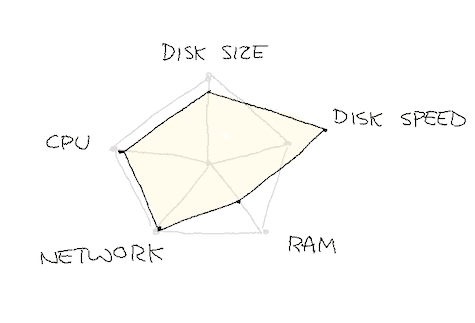
Just replicating data out of the m6g.large instances was over-saturating the host. We picked a bigger instance size, and slowly rolled things out while throttled, until things were stable again.
Auto-balancing capacity
A Confluent Kafka feature we turned on for the rollout was self-balancing clusters, which would automate the distribution of partitions to keep everything stable. Given the circumstances, auto-balancing turned out to be an amplifier for our cluster issues.
Our cluster is atypical (we use a few big partitions rather than many small ones) and some hidden default configuration values were too aggressive for us. We have since managed to find a sweet spot that lets us benefit from the auto-balancer without saturating our resources under common emergency situations.
Further Issues
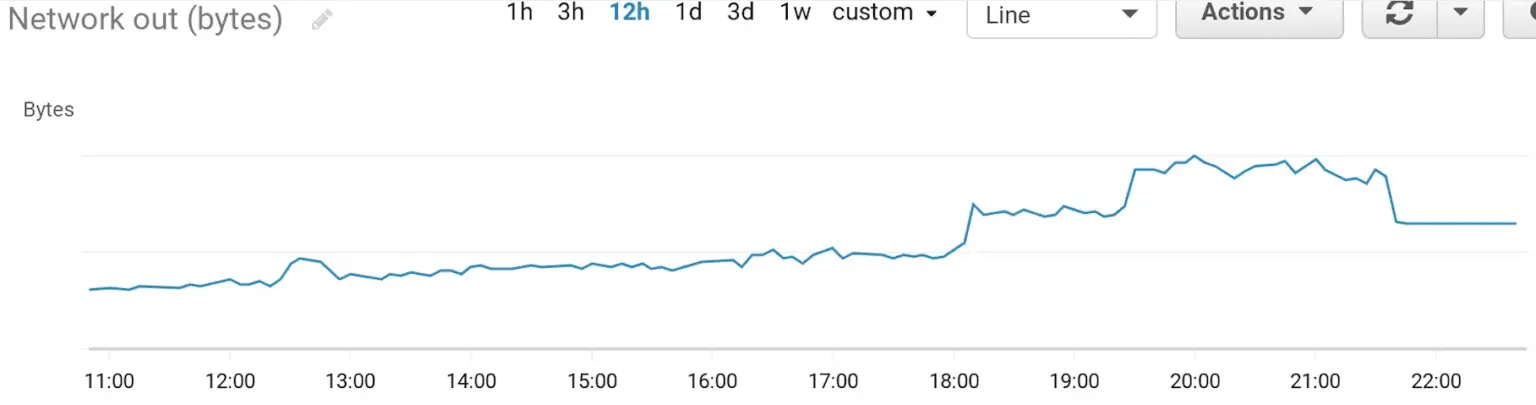
After a few days of stability, we started having hiccups once again. Some of our brokers started getting heavy bursts of activity on their EBS volume (within allowed limits), with serious performance degradations.
We later suffered a never-ending series of outages, where adequately-sized instances would be reaped when coming under normal load. We even had messy interplay with Kafka itself, which brought back a host with a truncated log but advertised itself as ISR, which we made leader and caused partial data loss.
We couldn’t explain what was going on with our cluster. After days of constant firefighting, we ran an emergency migration to i3en.2xlarge instances with a local SSD. This was more than we needed, to get stability both for normal and disaster scenarios (even accounting for the persistence of EBS drives, which would have felt counter-intuitive without our spate of outages).
Other contributing factors
There were lots of other things in play; if you’re interested, I encourage reading the full report.
Lessons learned and things to keep in mind
Plan for bad days
We have a tendency to plan optimizations for steady state scenarios: In other words, assuming things are right, how close to the edge can we bring performance? In practice, our performance envelope should keep room for operational concerns such as moving topics around, restarting brokers without ill effects (and within acceptable delays), and recovery plans for Availability Zone failures.
While we can’t necessarily do this evaluation for each and every component, at Honeycomb, we aim to answer most of these questions and have clear ways of tackling these situations.
Falling back to manual operations is always an option
When shit hits the fan and automation goes bad, you must have awareness and understanding of how to manually do what automation was supposed to do.
Unless we are absolutely 100% sure that automation is correct and that there is no other way to do things, we have to consider the possibility of having to run steps manually when things are on fire.
Performance and operational envelopes shift dynamically
Changing the way we run things means we change the performance envelope and operational pressures around them.
Moving from one operating point to the other carries the risk of new types of faults that we hadn’t seen before, which were triggered by events that were previously acceptable and playing in the slack capacity we had. We often only discover where limits were when we hit a wall or break boundaries. Changes of this kind shift the boundaries in ways that are hard to see.
But we learned there are some steps we can take to help avoid something like this from happening again (and what we did as part of recovery in the following weeks), including:
- Allocating more resources than expected—e.g., bigger instances with more capacity.
- Counteracting the risk of hitting many sensitive pressure points at once by slowly clamping down on resources until you find the early inflection points, and then tackling those one at a time.
Do you have any migration experiences or best practices you’d like to share? We’d love to hear from you! Give us a shout on Twitter or, if you’re already a Honeycomb user, send us a note in our community Slack group, Pollinators.
Want to know more?
Talk to our team to arrange a custom demo or for help finding the right plan.